What Is a Map in 2027? 33rd International Cartographic Conference 2027 Brings the Question Back to Warsaw
A map no longer has to be something we look at.
An autonomous car can use a map that no passenger will ever see. A robot can navigate through a structured spatial model built for computation rather than visual interpretation. AI systems increasingly process geographic representations as part of their reasoning. At the same time, people still depend on beautifully designed paper maps, atlases and interactive visualizations.
So what exactly counts as a map today?
Geoawesome explored this question in 2021, reporting on international research into how people understand the term map. Based on nearly 900 respondents, the study found that the public already understood maps more broadly than the traditional idea of a flat graphical representation of geographic space.
Maps were increasingly seen as models of geographic reality and carriers of spatial information. A visible graphic was not always considered essential. Respondents also largely accepted that a map’s user does not have to be human. It can be a machine.
Five years later, Geoawesome returned to that idea in Maps for Machines: A Paradigm Shift in Cartography. The discussion around high-definition maps for autonomous vehicles showed how far the transformation had progressed. Some of today’s most advanced maps are not primarily designed to be seen. They are designed to be processed.
This is not the end of traditional cartography. It is an expansion of its role.
From map images to intelligent spatial models
That expansion sits at the heart of the featured theme for the 33rd International Cartographic Conference, which will take place in Warsaw from 18 to 23 July 2027:
Big Data Cartography: Understanding More Than Ever Before
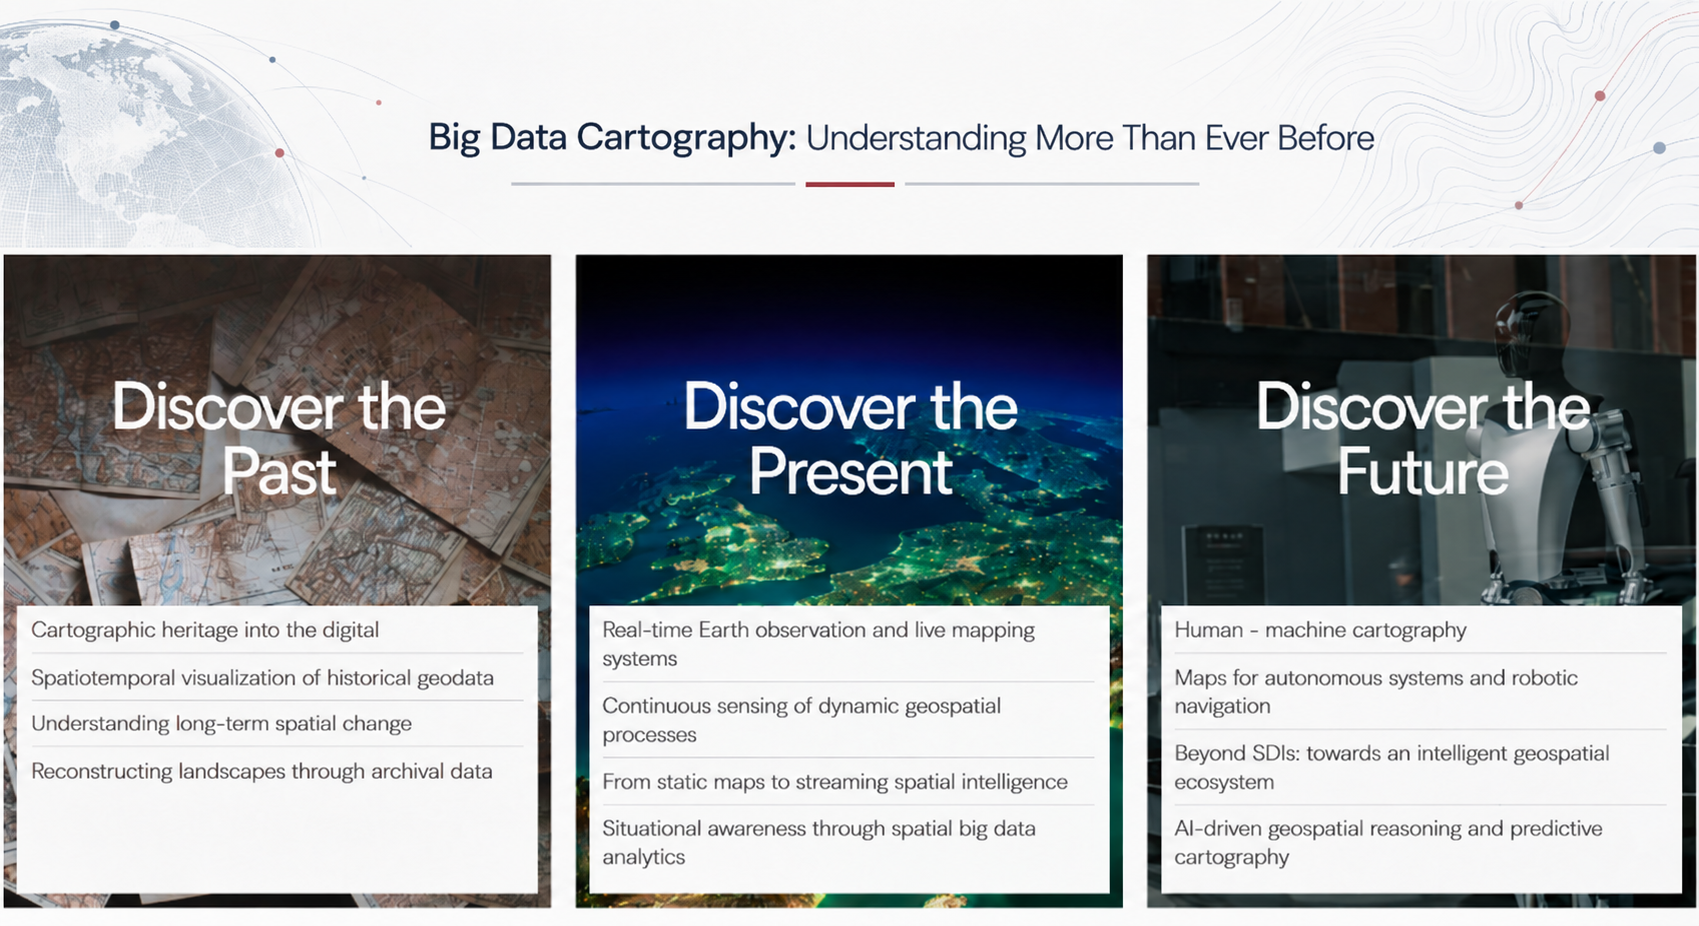
The phrase is deliberately broader than big data. Cartography can help us discover the past by integrating historical maps, archives and spatiotemporal data. It can help us observe the present through Earth observation, sensors, real-time mapping and continuously updated spatial information. Increasingly, it also allows us to explore possible futures through GeoAI, predictive modelling, digital twins and intelligent geospatial systems.
The growth of spatial data is not simply allowing us to map more. It is allowing us to understand more.
That understanding is no longer created exclusively for people. The emerging geospatial ecosystem must communicate spatial knowledge among humans, machines and increasingly autonomous AI systems. Cartography is becoming part of a much larger technological transformation.
Where does cartography go next?
The shift raises fundamental questions:
- What makes a spatial dataset a map?
- Is visualization still a necessary part of cartography?
- What happens when the primary map user is an algorithm, autonomous vehicle or robot?
- Where is the boundary between cartography, GIScience, GeoAI and spatial systems engineering?
Most importantly, what is the unique contribution of cartographic knowledge when machines increasingly analyse, interpret and act on geographic information?
ICC 2027 is not presenting these questions as settled. The organizers expect the program to include a dedicated debate about the future development of cartography. Human-machine cartography, autonomous systems, GeoAI and the changing meaning of maps are precisely the issues that make such a debate necessary.
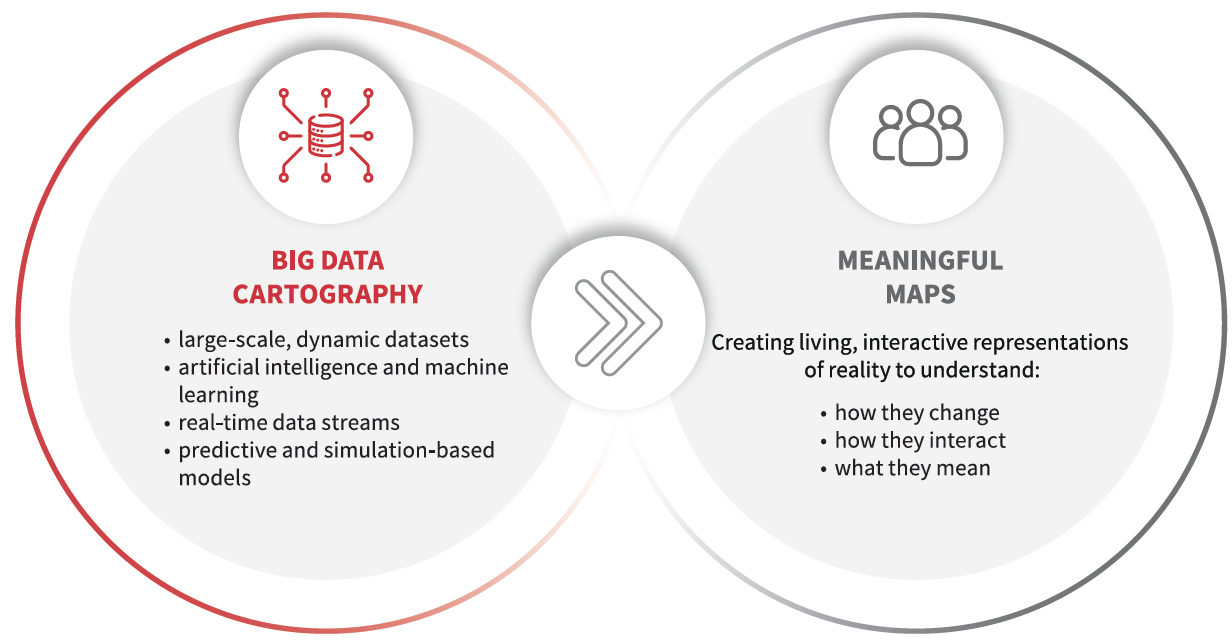
The conference remains equally committed to cartography in its full diversity. Traditional map design, visualization, atlases, cartographic heritage, cognition, education and the established fields of cartography and GIScience remain central to its 50-topic program. The goal is not to replace one understanding of cartography with another, but to ask how much larger the field is becoming.
A conversation for the whole geospatial community
This discussion should reach beyond the traditional cartographic community because modern data-driven systems often rely on cartographic principles without naming them as such.
Developers of navigation applications, mobility platforms, digital twins, dashboards, location-based services, autonomous systems and virtual environments may not describe themselves as cartographers. Yet many of the problems they solve are fundamentally cartographic: how to model geographic reality, structure spatial knowledge and communicate it effectively.
ICC 2027 aims to bring together cartographers, GIS specialists, GeoAI researchers, Earth observation experts, navigation and autonomy developers, digital twin specialists, computer scientists, smart-city professionals and geospatial industry leaders. All of them increasingly face the same challenge: turning growing volumes of spatial data into meaningful representations of the world for humans or machines.
The conference will be held across the University of Warsaw and Warsaw University of Technology, with the 21st General Assembly of the International Cartographic Association taking place alongside it. It will be the first ICC in Warsaw since 1982.
For prospective speakers, the submission system opens on 15 October 2026. Full papers are due on 20 November, abstracts on 1 December, and acceptance notifications are planned for 1 February 2027.
After 45 years, the global cartographic community is returning to Warsaw. There may be no better moment to revisit one of the discipline’s oldest questions: what is a map?
The answer is changing faster than ever.
Learn more at icc2027.org.

#Events

Next article
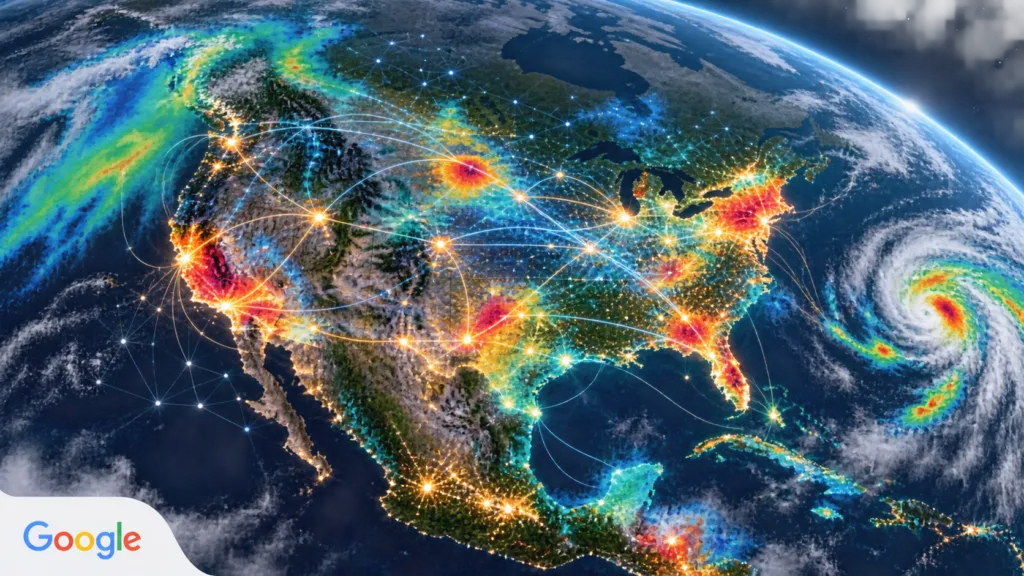
Google is making a bigger claim for geospatial AI than faster map production. Its latest research suggests that reusable mathematical representations of places could become part of the basic analytical infrastructure used to anticipate disease, fill gaps in health surveillance and direct limited resources.
The idea is being tested through Google Earth AI’s Population Dynamics Foundation Model, or PDFM. Instead of representing a location only through satellite pixels or census variables, PDFM combines aggregated search trends, patterns of mobility and place activity, weather, air quality and characteristics of the built environment. It compresses those signals into location embeddings, effectively numerical fingerprints of places that can be added to existing statistical and machine-learning workflows.
That distinction matters. Public-health teams frequently work with datasets that are several years old, spatially incomplete or trapped inside administrative boundaries. Google is not proposing that PDFM replace epidemiological records. It is proposing a reusable context layer that might help models work when conventional inputs are late or sparse.
Five tests, not one benchmark
The accompanying 41-page research paper, currently a preprint, brings together five partner-led evaluations across four countries and very different health problems.
Along the United States-Canada border, adding Canadian context increased the variation explained in county-level measles, mumps and rubella vaccination coverage from 16% to 22%. For cardiovascular mortality across roughly 3,100 US counties, PDFM-based models performed comparably to models using older census variables, while reducing large outlier errors.
In Mexico, combining PDFM with Google’s TimesFM model improved one-month dengue forecasts in up to 72% of municipalities experiencing active transmission. In the Democratic Republic of Congo, a model developed with WHO’s Regional Office for Africa improved the quality of shortlists for cholera emergence four to eight weeks ahead. At eight weeks, the average number of correct locations among the five highest-risk health zones rose from 1.78 to 2.10.
The fifth evaluation added geographic context to postpartum-depression risk screening. The improvement in headline predictive accuracy was small, but the signal transferred into states excluded from training. In simulations, that could help a constrained health system reach more rural mothers or reduce unnecessary follow-ups. The researchers are careful to say that area-level embeddings do not replace individual income, insurance or clinical information.
These are encouraging results, but not proof of a universal public-health model. Different experiments use different targets, baselines and geographies. The paper has not completed peer review, and several gains are statistically meaningful without being operationally transformative on their own.
From prediction to an agentic workflow
The more consequential development may be how Google packages the models. According to Google’s account, WHO AFRO used a prototype Geospatial Reasoning agent during the ongoing Ebola outbreak in the DRC to examine remote mining corridors, mobility and exposure. Google says the workflow identified 48 exposed settlements and more than 45,500 people at risk in minutes, supporting mobile-laboratory deployment and border surveillance.
That is a company-reported operational example, not an independently audited outcome. It does not establish that the model reduced transmission or saved lives. It does show the direction of travel: a public-health analyst asks a question in ordinary language, while an agent discovers datasets, performs spatial processing and presents candidate areas for action.
A crowded geospatial intelligence layer
Google is not alone in building reusable spatial foundations. WorldPop produces open, high-resolution demographic datasets used in health systems and humanitarian response, with an emphasis on transparent methods and government collaboration. NASA and IBM’s open-source Prithvi family learns primarily from Landsat and Sentinel-2 imagery and can be adapted for floods, fires, crops and other Earth-observation tasks.
PDFM’s differentiation is its combination of environmental signals with aggregated human behavior and place activity. That may capture conditions that imagery alone cannot see. It also creates a dependence on signals and infrastructure that few organizations other than Google can reproduce.
The commercial path is already visible. The embeddings are available in preview as Population Dynamics Insights through Google Maps Platform, while selected academic and public-health users can request no-cost access. What begins as research infrastructure may therefore become a proprietary layer underneath government and humanitarian decisions.
The governance problem is spatial too
Google describes the underlying signals as aggregated and privacy-preserving. That does not resolve every governance question. Search activity and mobility are uneven proxies for human behavior, particularly in places with limited connectivity. A model can appear globally transferable while performing best where Google’s data exhaust is richest.
Public-health agencies will need more than an accuracy score. They will need geographic error analysis, uncertainty at the decision scale, documentation of changing source coverage, audit trails for agent-produced maps and a clear process for local experts to reject misleading outputs. Communities should also have a voice when behavioral data helps determine whether their area is labeled high risk.
The strategic shift is nevertheless important. Geospatial foundation models are moving beyond extracting objects from imagery. They are becoming representations of how places function. If those representations are independently validated and governed well, they could shorten the distance between a weak signal and a public-health intervention. If they are treated as an automated substitute for local knowledge, they could make old data inequalities harder to see.