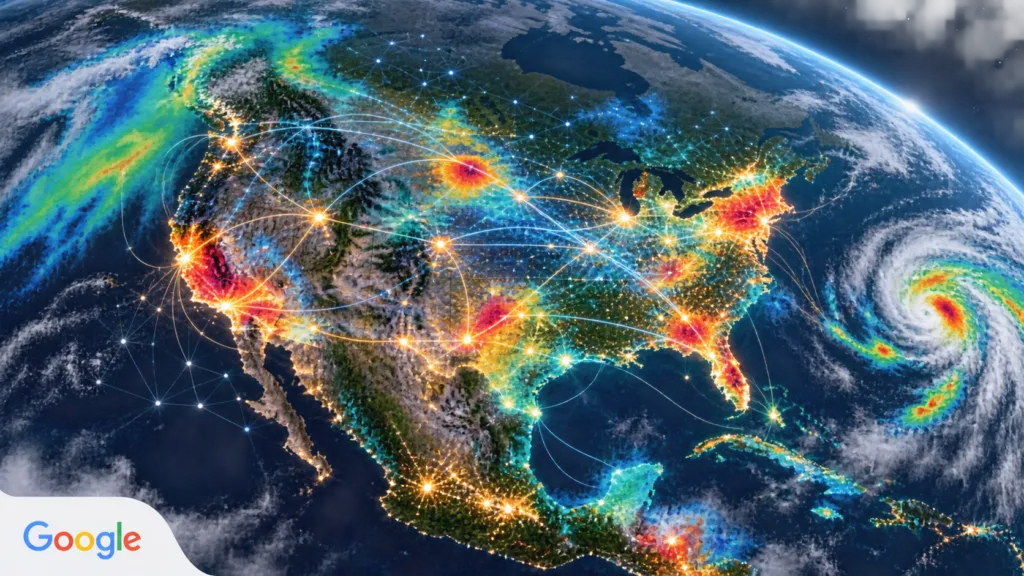

Google is making a bigger claim for geospatial AI than faster map production. Its latest research suggests that reusable mathematical representations of places could become part of the basic analytical infrastructure used to anticipate disease, fill gaps in health surveillance and direct limited resources.
The idea is being tested through Google Earth AI’s Population Dynamics Foundation Model, or PDFM. Instead of representing a location only through satellite pixels or census variables, PDFM combines aggregated search trends, patterns of mobility and place activity, weather, air quality and characteristics of the built environment. It compresses those signals into location embeddings, effectively numerical fingerprints of places that can be added to existing statistical and machine-learning workflows.
That distinction matters. Public-health teams frequently work with datasets that are several years old, spatially incomplete or trapped inside administrative boundaries. Google is not proposing that PDFM replace epidemiological records. It is proposing a reusable context layer that might help models work when conventional inputs are late or sparse.
Five tests, not one benchmark
The accompanying 41-page research paper, currently a preprint, brings together five partner-led evaluations across four countries and very different health problems.
Along the United States-Canada border, adding Canadian context increased the variation explained in county-level measles, mumps and rubella vaccination coverage from 16% to 22%. For cardiovascular mortality across roughly 3,100 US counties, PDFM-based models performed comparably to models using older census variables, while reducing large outlier errors.
In Mexico, combining PDFM with Google’s TimesFM model improved one-month dengue forecasts in up to 72% of municipalities experiencing active transmission. In the Democratic Republic of Congo, a model developed with WHO’s Regional Office for Africa improved the quality of shortlists for cholera emergence four to eight weeks ahead. At eight weeks, the average number of correct locations among the five highest-risk health zones rose from 1.78 to 2.10.
The fifth evaluation added geographic context to postpartum-depression risk screening. The improvement in headline predictive accuracy was small, but the signal transferred into states excluded from training. In simulations, that could help a constrained health system reach more rural mothers or reduce unnecessary follow-ups. The researchers are careful to say that area-level embeddings do not replace individual income, insurance or clinical information.
These are encouraging results, but not proof of a universal public-health model. Different experiments use different targets, baselines and geographies. The paper has not completed peer review, and several gains are statistically meaningful without being operationally transformative on their own.
From prediction to an agentic workflow
The more consequential development may be how Google packages the models. According to Google’s account, WHO AFRO used a prototype Geospatial Reasoning agent during the ongoing Ebola outbreak in the DRC to examine remote mining corridors, mobility and exposure. Google says the workflow identified 48 exposed settlements and more than 45,500 people at risk in minutes, supporting mobile-laboratory deployment and border surveillance.
That is a company-reported operational example, not an independently audited outcome. It does not establish that the model reduced transmission or saved lives. It does show the direction of travel: a public-health analyst asks a question in ordinary language, while an agent discovers datasets, performs spatial processing and presents candidate areas for action.
A crowded geospatial intelligence layer
Google is not alone in building reusable spatial foundations. WorldPop produces open, high-resolution demographic datasets used in health systems and humanitarian response, with an emphasis on transparent methods and government collaboration. NASA and IBM’s open-source Prithvi family learns primarily from Landsat and Sentinel-2 imagery and can be adapted for floods, fires, crops and other Earth-observation tasks.
PDFM’s differentiation is its combination of environmental signals with aggregated human behavior and place activity. That may capture conditions that imagery alone cannot see. It also creates a dependence on signals and infrastructure that few organizations other than Google can reproduce.
The commercial path is already visible. The embeddings are available in preview as Population Dynamics Insights through Google Maps Platform, while selected academic and public-health users can request no-cost access. What begins as research infrastructure may therefore become a proprietary layer underneath government and humanitarian decisions.
The governance problem is spatial too
Google describes the underlying signals as aggregated and privacy-preserving. That does not resolve every governance question. Search activity and mobility are uneven proxies for human behavior, particularly in places with limited connectivity. A model can appear globally transferable while performing best where Google’s data exhaust is richest.
Public-health agencies will need more than an accuracy score. They will need geographic error analysis, uncertainty at the decision scale, documentation of changing source coverage, audit trails for agent-produced maps and a clear process for local experts to reject misleading outputs. Communities should also have a voice when behavioral data helps determine whether their area is labeled high risk.
The strategic shift is nevertheless important. Geospatial foundation models are moving beyond extracting objects from imagery. They are becoming representations of how places function. If those representations are independently validated and governed well, they could shorten the distance between a weak signal and a public-health intervention. If they are treated as an automated substitute for local knowledge, they could make old data inequalities harder to see.



#GeoAI

Next article

Updated October 2026 · Navigation & mobile mapping
AI can help you plan a trip, but it cannot replace an offline map. Conversational search, AI route builders and review summaries generally need a connection, while downloaded maps keep working when the signal disappears. This guide compares 18 navigation and travel apps, with particular attention to what still works in airplane mode.
What changed since 2024
Since our 2024 guide, AI has moved from a novelty to a mainstream feature in navigation and travel apps. Google Maps added Gemini-powered navigation and Ask Maps, Waze introduced Gemini-based reporting and a motorcycle mode, and AllTrails expanded its AI Custom Routes feature. Other apps, including Komoot and Strava, now use AI to help users discover or refine routes.
The key distinction is not whether an app has AI, but whether the AI output can be downloaded and used without a connection. A route created online is useful only if you can save it to an offline map before leaving.
Quick picker: which app fits your trip?
Tap a filter. The dots indicate how much of the app remains useful without a signal:
●●●●● Full offline navigation and search
●●●●○ Strong offline navigation, with some connected features unavailable
●●●○○ Limited offline use
●○○○○ Mostly online
Switch your phone offline
Flip the switch: green features work offline, purple features require a connection. “Offline” means the feature can be used after the necessary map, route or itinerary has been downloaded in advance.
| App | Best for | Features | Offline cost |
|---|---|---|---|
| Google Maps | Driving, cities | Downloaded areasTurn-by-turnOffline place informationLive trafficGemini in navigationAsk Maps | Free |
| Waze | Commuting | Route loaded before signal lossCrowd alertsGemini voice reportingRerouting | Free |
| HERE WeGo | Road trips abroad | Country / region / continent downloadsTurn-by-turnOffline navigationLive transitIncident reporting | Free |
| Apple Maps | iPhone users | Downloaded map areasTurn-by-turnPlace cardsNatural-language searchLive transit | Free |
| Wanderlog | Trip planning | Saved itinerary and map, where supportedAI assistantRoute optimisationLive collaboration | Pro subscription required for offline access |
| Citymapper | Urban transit | Saved journeysMetro maps, where availableNew route planningLive disruptions | Free |
| Tripadvisor | Choosing what to see | ReviewsAI trip builderAI review summaries | Not primarily an offline navigation app |
| MAPS.ME | Rural tourism | Country downloadsTurn-by-turnPOI searchContoursHotel booking | Freemium; check current in-app pricing |
| Organic Maps / CoMaps | Privacy, hiking | Country downloadsTurn-by-turnSearchOSM editing, synced later | Free |
| Komoot | Cycling, hiking | Downloaded region mapsVoice navigationClimb detection@komoot in ChatGPTRoute planner | Free region; additional regions or Premium |
| Strava | Training | Offline maps for subscribersGPS recordingAI route suggestionsAthlete Intelligence | Subscription |
| Ride with GPS | Long rides | Offline routesVoice cuesWaypoint alertsCollaborative planning | Paid tiers |
| REVER | Motorcycle touring | Downloaded routesRide trackingCommunity routesWeather overlay | Freemium / Pro |
| Scenic | Motorcycle day rides | Offline mapsNavigationRoute sharing | Freemium |
| AllTrails | Hiking | Offline trail maps, PlusWrong-turn alertsSaved custom routesAI Custom Routes builderConditions forecastOutdoor Lens | Plus or Peak |
| MapMyWalk | Fitness walking | GPS trackingBasemapChallenges | Freemium |
| OsmAnd | Off-grid power users | Country downloadsTurn-by-turnContours and hillshadeGPX tracksHourly map updates, Pro | Free core; paid Maps+ and Pro plans |
Based on vendor documentation and app-store listings checked in October 2026. Availability and prices vary by country, platform and subscription.
Drivers
Google Maps: The all-rounder UPDATED
- Offline: Download selected areas for turn-by-turn directions and offline place information. Live traffic, alternative routing and connected AI features are unavailable offline.
- AI: Gemini in navigation can help with stops and route-related questions while driving, walking or cycling. Ask Maps adds conversational search for places.
- Availability: Ask Maps began rolling out in the United States and India. Feature availability may differ by device, language and account.

Waze: The crowd-sourced navigator UPDATED
- Offline: Waze does not offer a full official offline-map mode. A route loaded before losing signal may continue from cache, but rerouting, search and crowd reports require a connection.
- New: Waze has added Gemini-powered conversational reporting and destination search, plus motorcycle mode in selected countries.
- Motorcycle mode: Google lists Argentina, Brazil, Colombia, Malaysia, Mexico, Peru and the Philippines among the initial markets.

HERE WeGo: The offline champion
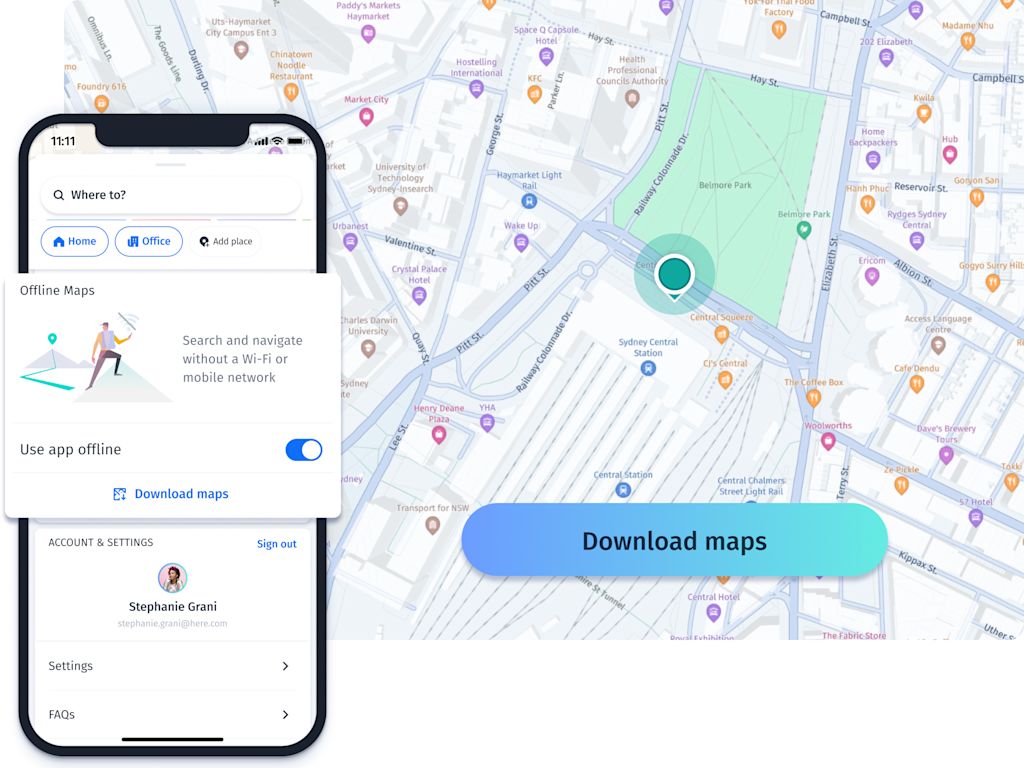
- Offline: Download regions, countries or continents in advance for offline navigation.
- Online: Live transit information and incident reporting require a connection.
- Best for: Travellers who want a simple, free offline backup for driving and public transport.
Apple Maps: The iPhone default NEW IN GUIDE
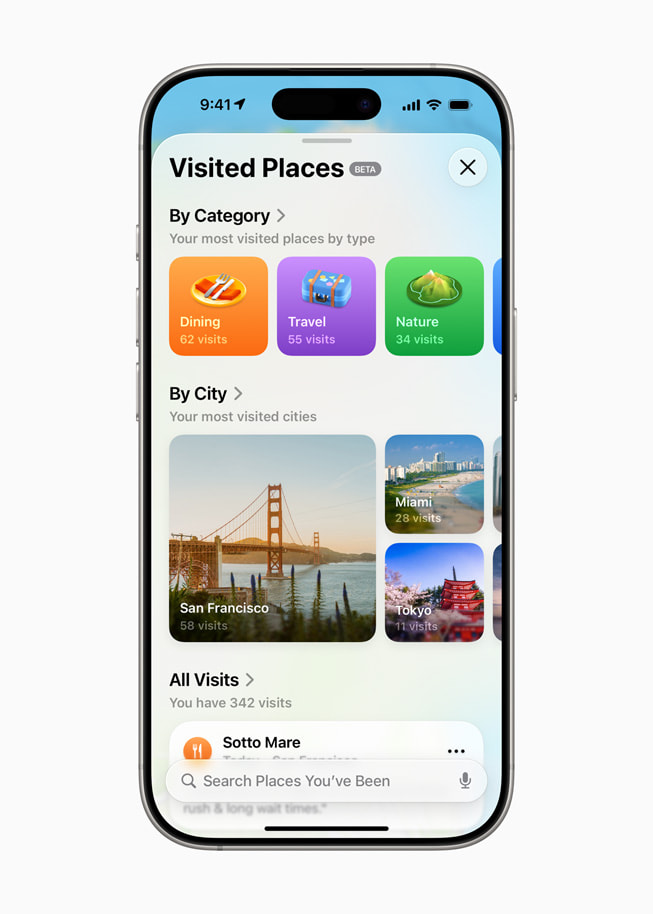
- Offline: Download map areas for turn-by-turn driving, walking, cycling and transit directions, including on Apple Watch where supported.
- Online: Natural-language search, live transit and other connected features require a connection.
- Availability: iPhone only. Offline-map coverage and feature availability vary by region.
Travellers and trip planning
Wanderlog: The trip planner that puts everything on a map NEW PLAYER
- Best for: Building an itinerary around places, bookings and a map view.
- Offline: Offline access is part of the paid Pro plan. Confirm the exact offline behaviour for your itinerary and device before relying on it.
- Limitation: Wanderlog is a planner, not a full turn-by-turn navigator. Pair it with Google Maps, Apple Maps or HERE WeGo.

Citymapper: Your urban transit companion
- Best for: Public transport in major cities.
- Offline: Save key journeys before travelling. Do not assume that full route planning works underground or without coverage.
- Online: Live multimodal planning, disruptions and real-time departure information.
Tripadvisor: Reviews, now with AI DOWNGRADED
- Best for: Researching destinations, restaurants and attractions.
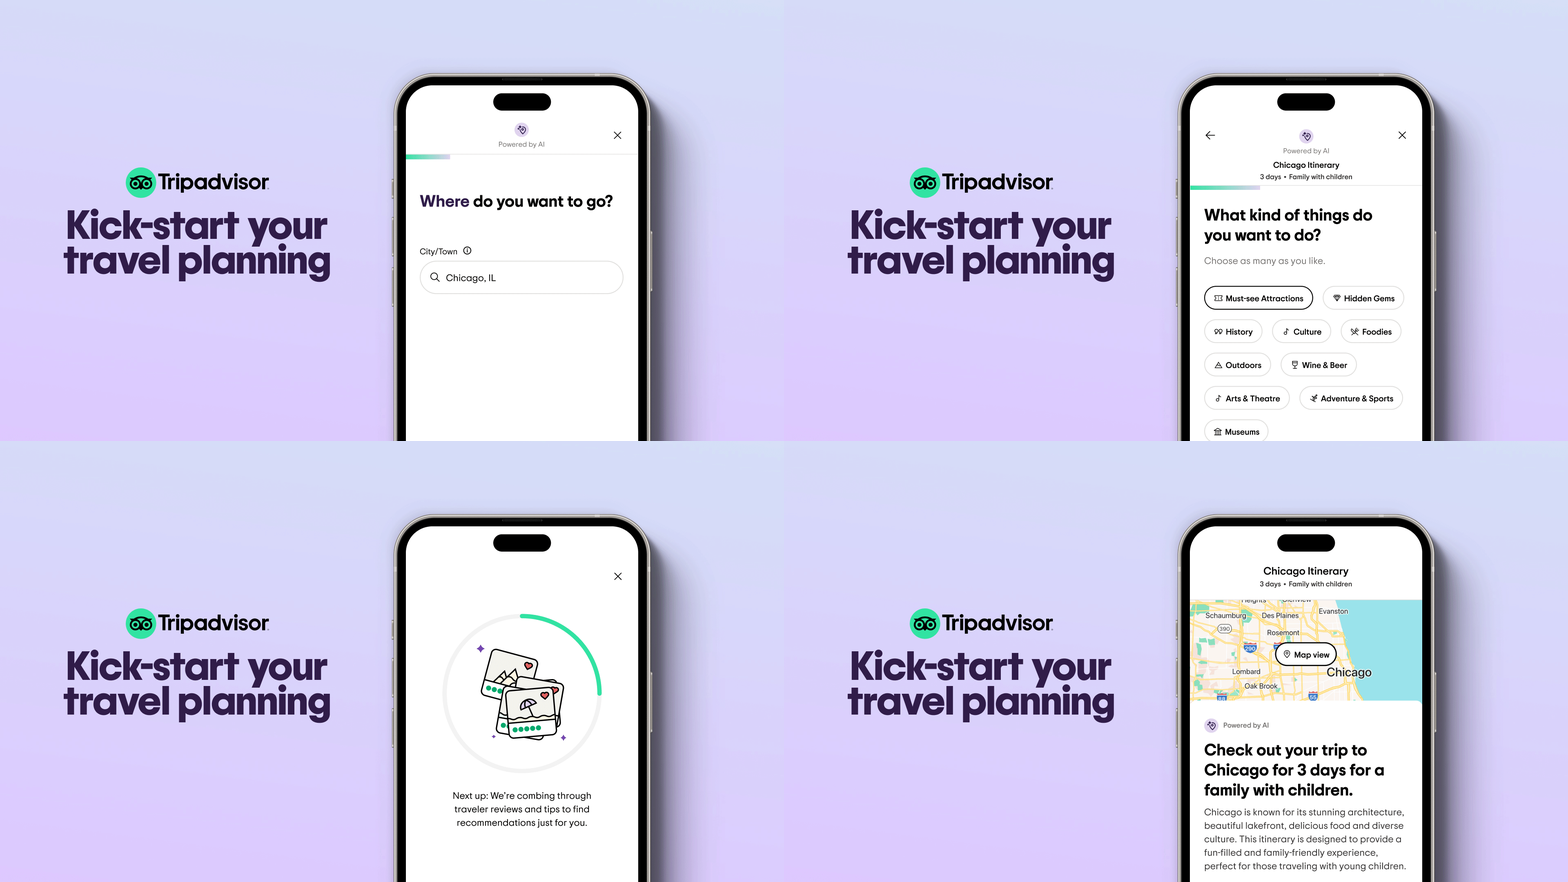
- AI: Tripadvisor offers an AI trip builder and AI-generated review summaries.
- Offline: We found no current official documentation confirming downloadable offline city maps. Treat it as an online research tool rather than an offline navigator.
MAPS.ME: Global offline navigation, with caveats UPDATED
- Offline: OpenStreetMap-based downloads with turn-by-turn navigation, POI search and contour lines.
- Extras: Hotel booking and eSIM purchases are built into the app.
- Caveat: Pricing and download limits vary by platform and country. Check the current in-app purchase screen before relying on it.
Organic Mapsand CoMaps: Open source, no tracking NEW IN GUIDE
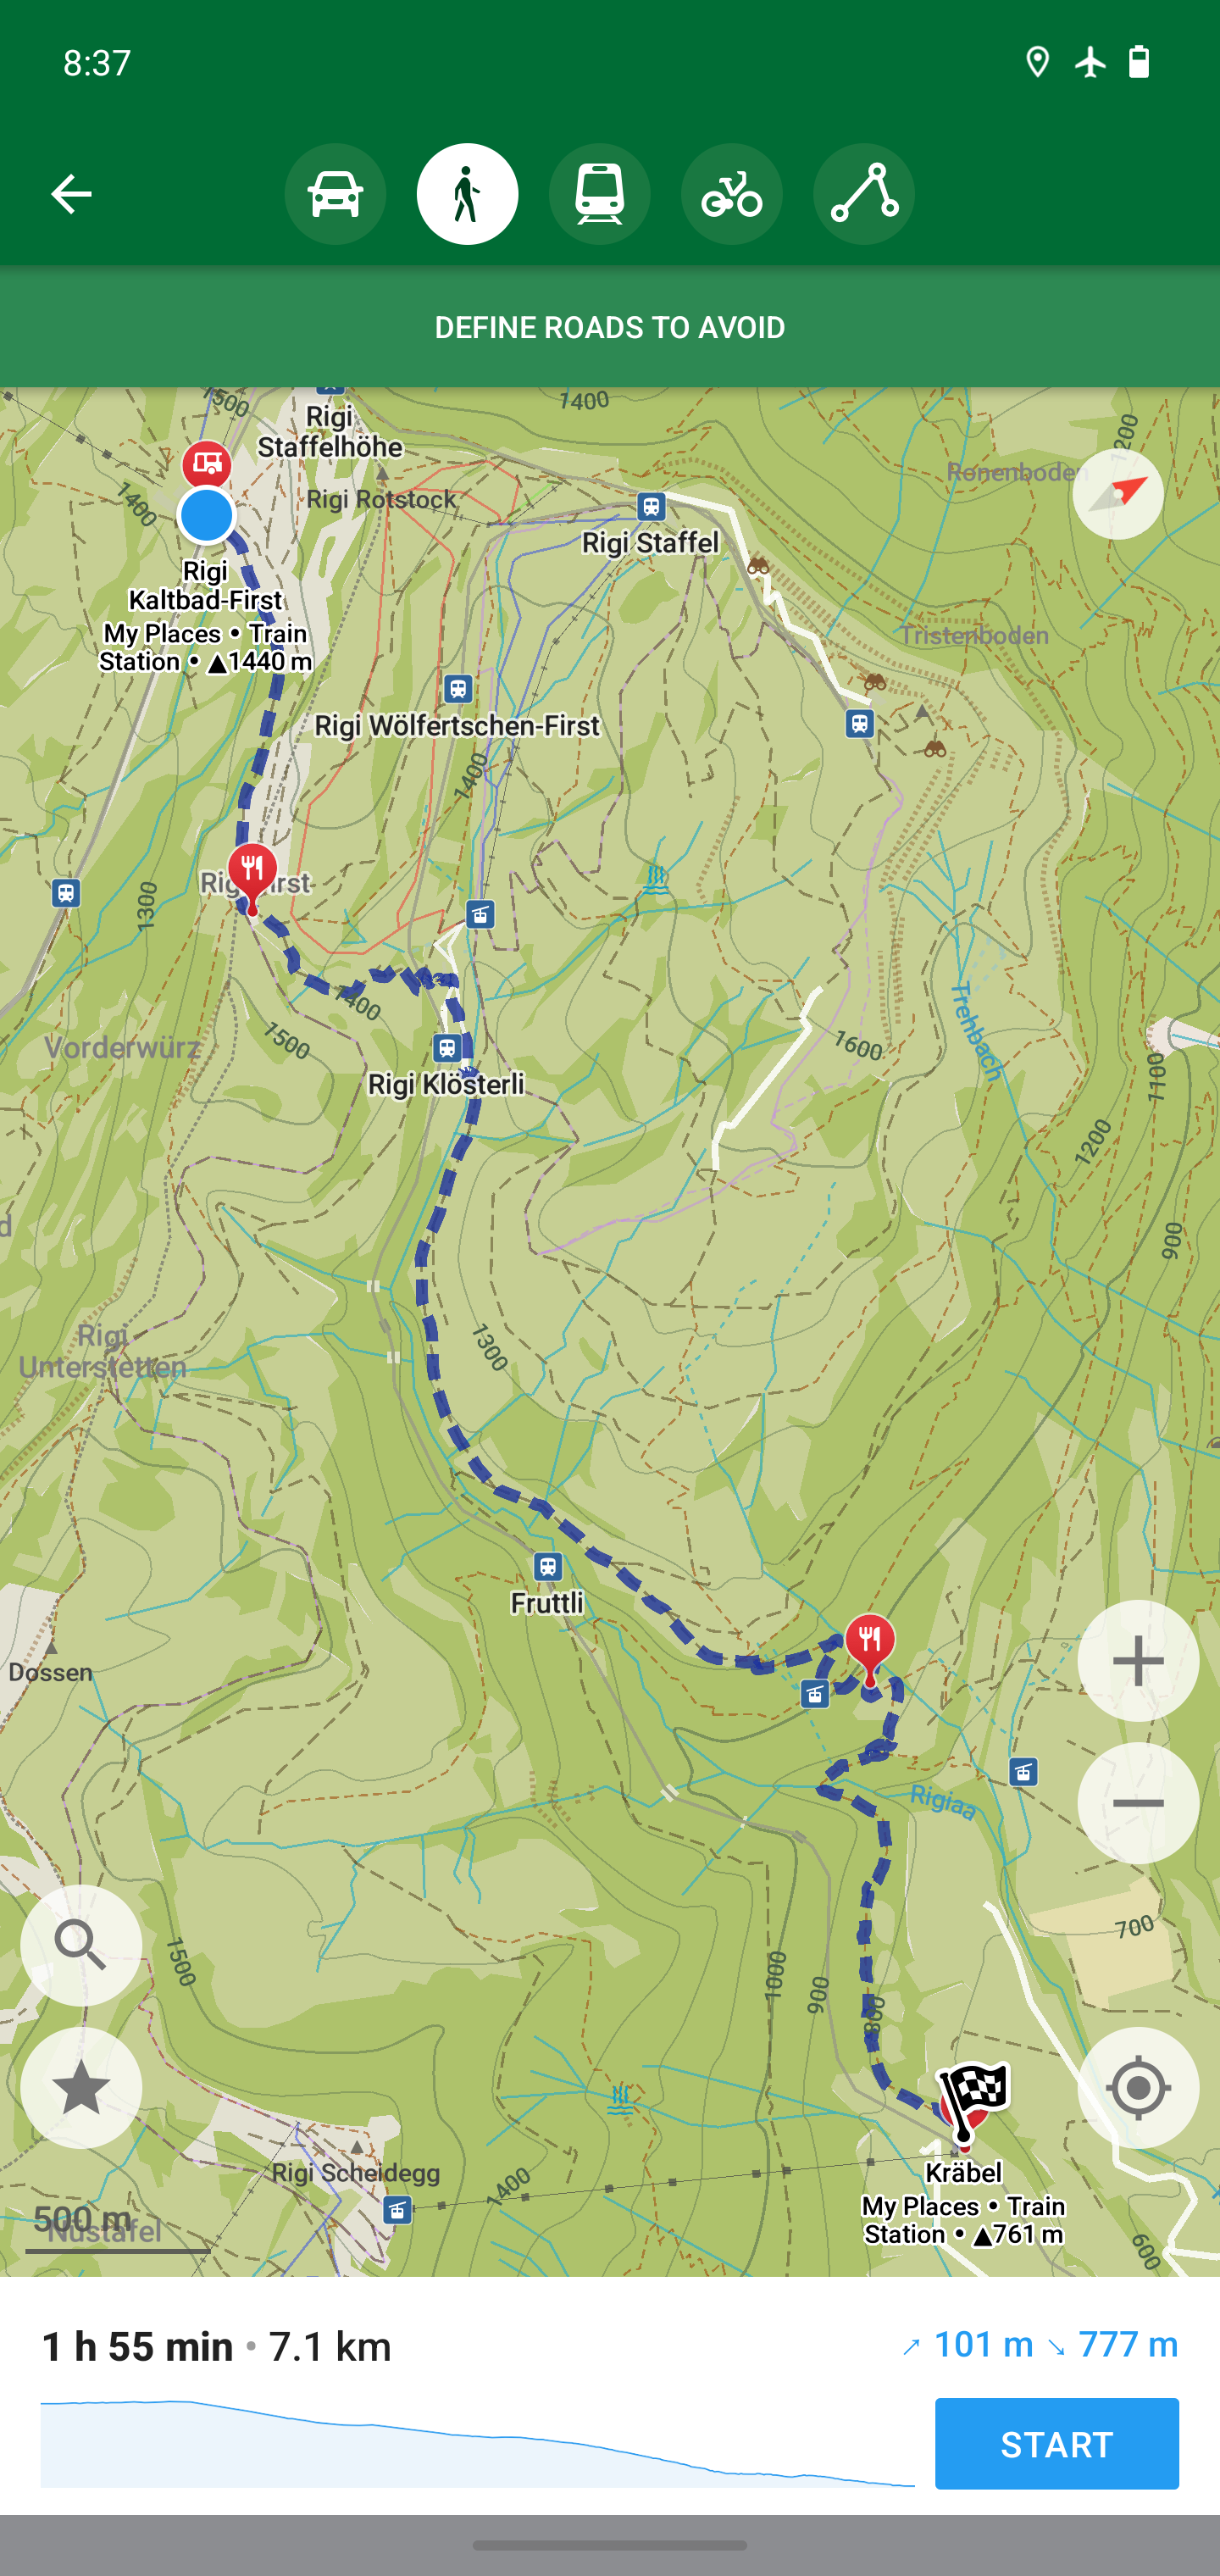
- Offline: Both provide OpenStreetMap-based downloads, offline search and navigation for driving, cycling and walking.
- Privacy: No account is required, and the projects emphasise no ads and no tracking.
- Data quality: Coverage depends on local OpenStreetMap contributors. Trails are often strong; opening hours and smaller POIs can be incomplete.
Cyclists
Komoot: The outdoor enthusiast’s choice UPDATED
- Offline: One region is included free; additional regions can be purchased individually or accessed through Premium.
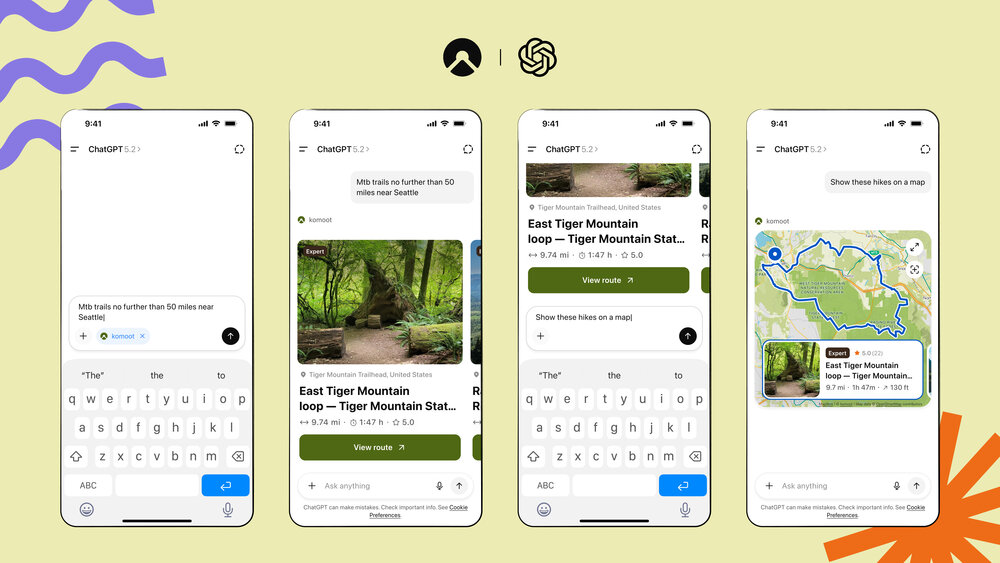
- AI: Komoot’s ChatGPT integration helps users discover routes from Komoot’s route database. Open the resulting route in Komoot and download it before riding.
- Context: Bending Spoons acquired Komoot in March 2025. Multiple reports estimated that a large share of the original team was laid off after the acquisition; the precise figure was not officially confirmed.
Strava: The athlete’s guide UPDATED
- Offline: Offline maps are available to subscribers.
- AI: Strava’s AI-powered Routes use its Global Heatmap to suggest routes based on where athletes actually run, ride and walk.
- Limitation: Routing and offline-map features are largely tied to a paid subscription.
Ride with GPS: The cyclist’s navigator UPDATED
- Offline: Paid tiers support offline routes, voice cues and cue sheets.
- Newer features: Waypoint alerts, collaborative planning with version history and an MTB trail layer.
- Best for: Bikepacking, long-distance rides and cyclists who need precise navigation.
Motorcyclists
REVER: Route planning made easy
- Best for: Motorcycle touring, community routes and ride tracking.
- Offline: Download routes for use without a signal.
- Extras: Butler Maps roads are available to Pro members.
Scenic: Discover the road less travelled
- Best for: Curated scenic and twisty roads.
- Offline: Offline maps and navigation are available.
- Extras: Rider-specific stops and viewpoints.
Walkers and hikers
AllTrails: For trail hikers UPDATED
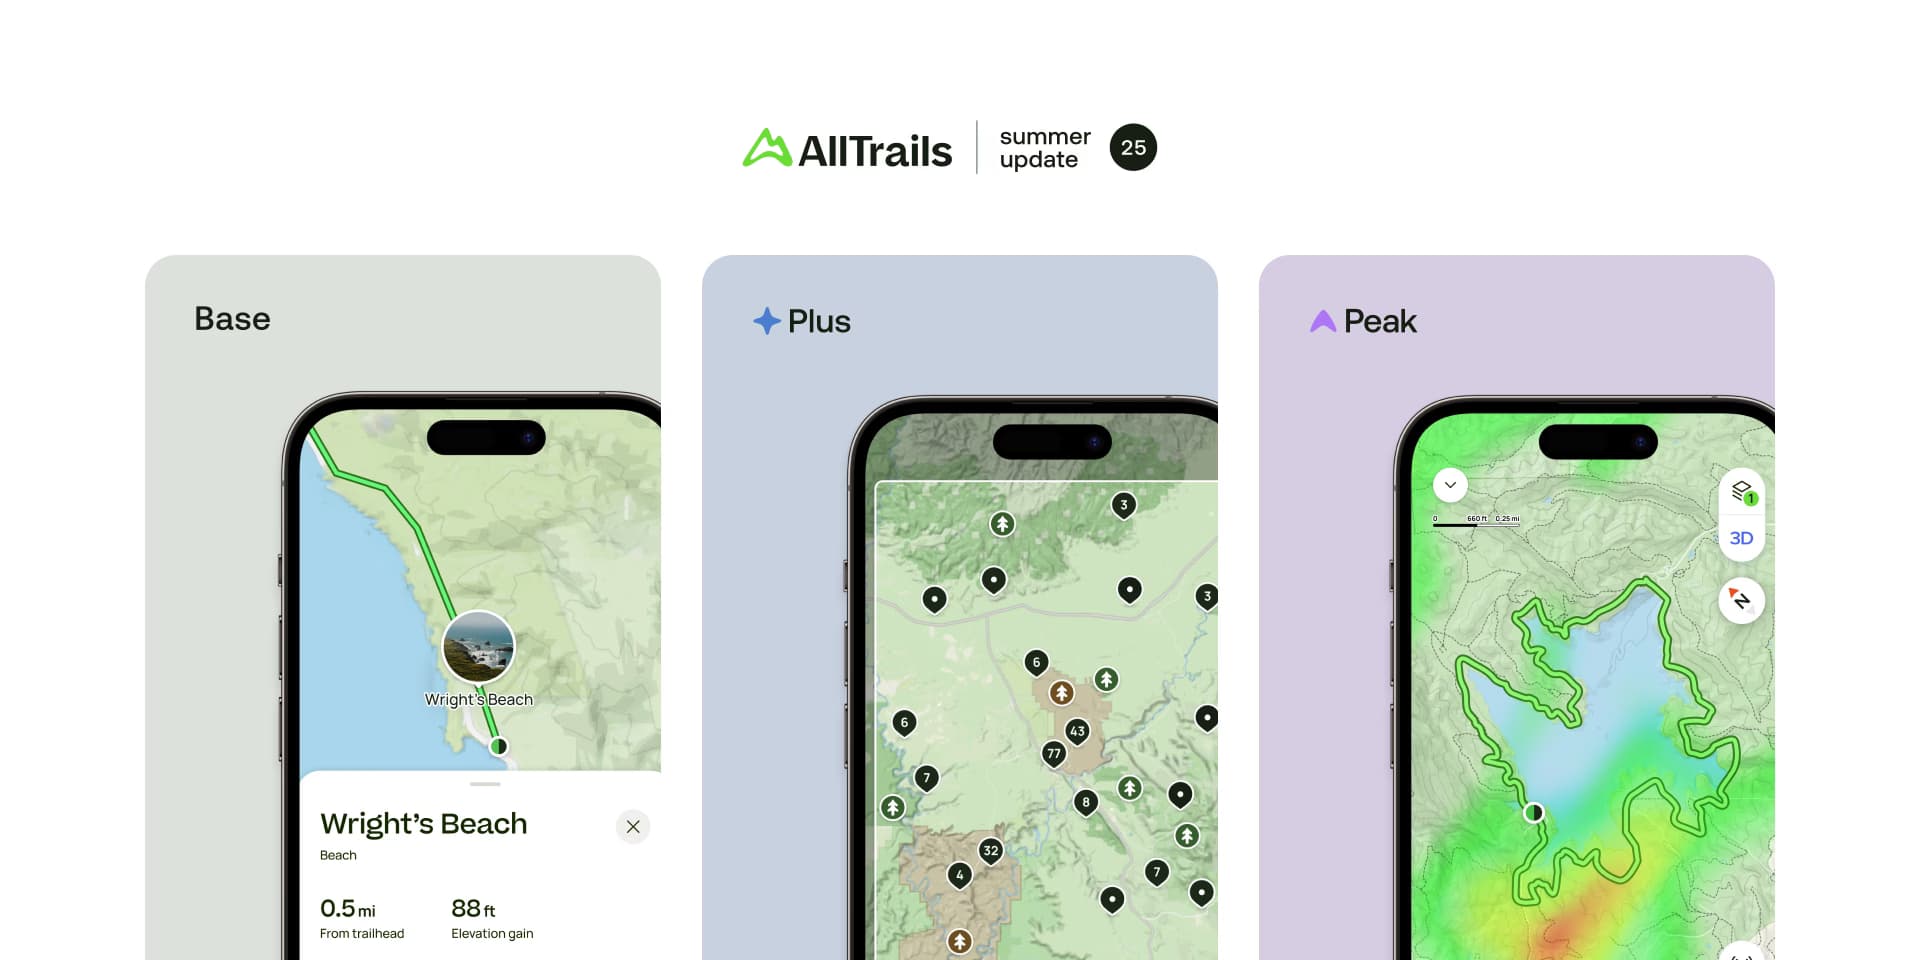
- Plus: Includes offline maps and wrong-turn alerts.
- Peak: Adds AI Custom Routes, conditions forecasts, crowd heatmaps and Outdoor Lens plant identification.
- Offline workflow: Create or modify a route online, save it, then download the relevant offline map before hiking.
MapMyWalk: Fitness meets navigation
- Best for: Fitness tracking and walking goals.
- Offline: We could not confirm reliable offline basemaps. Use it alongside a dedicated offline map app.
- Context: MapMyWalk is part of Outside.
OsmAnd: The power user’s offline map NEW IN GUIDE
- Offline: OpenStreetMap-based downloads, turn-by-turn navigation, contours, hillshade and GPX import.
- Paid plans: Maps+ unlocks additional features; Pro adds advanced features such as hourly map updates.
- Pricing: Prices differ by platform, region and billing channel. Check OsmAnd’s current pricing page or in-app store before publication.
AI scorecard
This scorecard is an editorial assessment, not a laboratory benchmark. It rates each app’s main AI feature for usefulness, offline value, reach and trust. “Offline value” measures whether the AI output can lead to something usable without a connection.
AllTrails Peak: Custom Routes 16/20
The clearest path from AI output to an offline route: build it, save it, download it and hike it. The main drawbacks are the Peak subscription and the need to check trail closures and conditions independently.
Komoot: @komoot in ChatGPT 15/20
The ChatGPT integration helps discover real Komoot routes rather than inventing them. To use a result offline, open it in Komoot and download the route.
Google Maps: Gemini navigation and Ask Maps 15/20
Google’s AI features are highly capable but connection-dependent. Ask Maps is initially limited to selected markets, and review-based answers are only as reliable as the reviews behind them.
Strava: AI routes and Athlete Intelligence 15/20
Strava’s routes are informed by its Global Heatmap, and subscribers can use downloaded maps. Most routing and offline features require a subscription.
Waze: Gemini reporting and search 15/20
Waze’s voice reporting is useful, but the app depends heavily on live data. It is not a reliable standalone offline navigator.
Tripadvisor: AI trip builder and review summaries 13/20
Useful for shortlisting places, but review summaries can flatten disagreement and inherit unreliable reviews.
Wanderlog: AI assistant 13/20
Best for refining a plan rather than building one from scratch. Offline access is tied to the paid tier.
Apple Maps: natural-language search 13/20
Natural-language search is convenient, but it is limited to compatible Apple devices and may require a connection. Download maps separately for offline use.
Before you go
- Download maps on Wi-Fi, covering your route plus a margin.
- Download routes and itineraries, not just the base map.
- Test the download in airplane mode before leaving.
- Keep a second fully offline app, such as OsmAnd, Organic Maps, CoMaps or HERE WeGo, as a backup.
- Check closures, access rules, weather and local safety advice separately.
This guide was checked in October 2026. Features, prices and availability can change without notice.
How do you like this article? Read more and subscribe to our monthly newsletter!