
Overture Maps Foundation’s latest release is easy to describe as another increase in address points, transport features and physical geography. The more consequential story, however, is how Overture is turning open map data into governed infrastructure that software, and increasingly AI agents, can consume predictably.
Published on August 19, release 2026-08-19.0 uses schema version 1.18.0 and distributes its datasets through GeoParquet, PMTiles and cloud-hosted registries. Overture’s base, buildings, divisions, places and transportation themes are considered generally available, while addresses remain alpha. The complete release notes are available here.
The release contains approximately 472.8 million candidate address records. Overture refreshed data from Fresno County and Statistics Canada, adding richer attributes, and incorporated several thousand records from Land Information New Zealand and Italy’s ICAR system.
Its base dataset also expanded. Infrastructure features increased by 1.8% to approximately 155.5 million, while land features grew by 1.6% to 75.6 million. Peaks, ridges, saddles, mountain ranges and volcanoes all increased, although the official notes do not support the previously circulated claim that exactly 131,189 mountain landforms were added.
Transportation changes include more parking facilities, parking spaces, bicycle parking, bus stops and stop positions. The release also added nearly 497,000 TomTom road segments and around 1.3 million OpenStreetMap segments, alongside improvements to attributes such as road surface, class and access restrictions.
Yet raw feature growth is not the best measure of the release.
Overture’s building count actually fell by 0.6%, to approximately 2.53 billion, despite millions of new Microsoft and OpenStreetMap contributions. Its places dataset also declined by 0.8%, even as BrightQuery and AllThePlaces supplied additional records.
Those reductions do not necessarily mean coverage deteriorated. They illustrate that conflation, deduplication, filtering and quality controls can matter more than simply accumulating objects. That is especially important for machine-driven applications, where duplicate or contradictory features can be more damaging than a slightly smaller dataset.
The release also advances an important schema transition. Overture has deprecated the broad categories field and will remove it in September, replacing it with basic_category and taxonomy. Developers have one transition release in which both representations are available.
This is the kind of change that determines whether an open dataset functions as dependable infrastructure. Stable identifiers, documented schemas and predictable migration paths are essential when map data feeds analytics pipelines, digital twins or the emerging class of machine-oriented maps.
The release notes also contain an unusually useful disclosure: an August changelog incorrectly classified 60,060 bathymetry features as newly added, when the correct number was zero. Publishing the correction strengthens transparency, but it also shows why downstream teams should validate machine-readable changes rather than treating release summaries as unquestionable truth.
Overture says its data is already being used by Microsoft, Esri, Meta, Uber and other members. In a Foundation case study, Microsoft reports that replacing an existing buildings layer with Overture improved address accuracy by several percentage points and shortened some map-production cycles from months to weeks. These remain company-reported results rather than independently audited benchmarks. Microsoft’s case study and Overture’s Esri User Conference report nevertheless offer evidence that the project is moving beyond experimental downloads.
Practitioner questions on Overture’s public GitHub forum continue to focus on confidence values, category decisions, changes in feature locations and practical data access. There was little substantive independent discussion of this exact release, suggesting adoption evidence still lags the Foundation’s technical progress.
As Geoawesome has previously explored in its discussion of Overture’s purpose and the relationship between Google Maps and OpenStreetMap, competition in mapping is no longer only about who possesses the most features. It is increasingly about who can provide reliable, interoperable and continuously governed spatial infrastructure.
Overture’s August release is another step in that direction, less a dramatic map update than an indication of how open maps are being prepared for machines.


#News

Next article
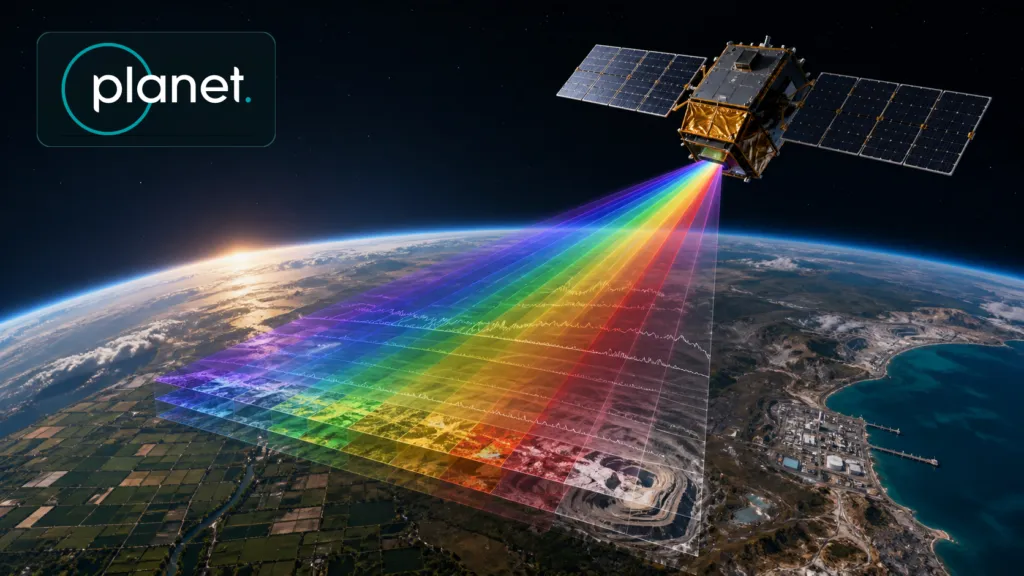
Planet has shipped Tanager-2 and 18 SuperDove satellites to Vandenberg Space Force Base for SpaceX’s Transporter-18 mission. The SuperDoves provide the numerical headline, but Tanager-2 may represent the more consequential shift: hyperspectral Earth observation moving from an impressive single sensor toward a service with operational capacity and useful revisit times.
Planet says a commissioned Tanager-2 would double its hyperspectral capacity and halve revisit times. That remains a forward-looking claim. The spacecraft still has to launch, complete commissioning and demonstrate consistent performance in orbit. Nevertheless, Tanager-1 has already established a credible technical foundation.
Seeing materials, not just colors
A conventional optical satellite measures Earth through a handful of broad spectral bands. Tanager divides reflected light into approximately 426 contiguous bands spanning 380 to 2,500 nanometers. Each 30-meter pixel contains a detailed spectrum that can reveal absorption patterns associated with gases, minerals, vegetation chemistry and other materials.
The distinction is important. Multispectral imagery can show that two fields look different. Hyperspectral data may help determine whether that difference is caused by crop variety, water stress, nitrogen content or disease.
An independent USGS characterization of Tanager-1 examined its geometric, radiometric and spectral performance. It found strong band-to-band alignment while also documenting variations that analysts must understand when comparing Tanager with other sensors. The report validates the instrument’s basic scientific utility, but not every commercial claim made for it.
Methane provides the clearest business case
Tanager’s most mature application is locating methane and carbon dioxide super-emitters. Carbon Mapper reports that Tanager-1 produced 14,400 published methane-plume observations and 3,900 CO₂-plume observations between September 2024 and August 2026. It also says California used Tanager and Carbon Mapper data to identify and mitigate ten oil-and-gas super-emitters. These are mission-partner figures, not an independent audit, but they demonstrate a data-to-action pathway.
For an operator, finding a large leak can reduce lost product, regulatory exposure and reputational risk. For governments, the same observation supports enforcement and emissions inventories. The value therefore comes from identifying the source, estimating its emissions and delivering the result quickly enough for someone to act.
Beyond greenhouse gases
Hyperspectral data could support several other markets. Mining companies can map mineral signatures, monitor waste and identify environmental changes around operations. Agriculture users can distinguish crops, assess plant chemistry and potentially detect stress before it becomes obvious in normal imagery. Water authorities can investigate algal blooms, sediment, chlorophyll and pollution. Conservation teams can classify vegetation communities or monitor coral health. Security users can search for materials or objects whose spectral signatures differ from their surroundings.
Tanager’s 30-meter resolution imposes an important boundary. It is suited to fields, plumes, water bodies, mine areas and other relatively large targets. It is not designed to inspect individual plants, vehicles or pieces of industrial equipment.
The difficult part begins after collection
A hyperspectral scene is a large data cube rather than a familiar photograph. Before analysis, teams may need to correct atmospheric absorption, illumination, viewing geometry, sensor noise and band alignment. A single pixel can contain several materials, creating a mixed signature. Models trained in one season, geography or sensor may fail somewhere else.
Planet offers calibrated radiance and atmospherically corrected surface-reflectance products, while its methane products add plume identification and emissions estimates. That packaging is strategically important. Most customers do not want hundreds of bands; they want a leak alert, mineral map, crop-risk score or API response with known uncertainty.
Hyperspectral AI can accelerate classification, but it does not remove the need for spectral libraries, field measurements and domain expertise. More bands can produce more information, but they also create more opportunities for false confidence.
A competitive market is taking shape
Planet is not alone. Pixxel offers higher-resolution VNIR hyperspectral imagery through Firefly and plans broader VNIR-SWIR coverage with Honeybee. Wyvern emphasizes 5.3-meter, taskable VNIR imagery. Orbital Sidekick targets pipeline monitoring and security with its GHOSt constellation and analytics platform. Kuva Space combines tunable VNIR sensors with onboard AI. In emissions monitoring, GHGSat operates a larger fleet of specialized greenhouse-gas satellites.
Tanager’s position is different: broad VNIR-SWIR coverage, strong methane sensitivity and integration with Planet’s global monitoring business. Planet can use PlanetScope to identify change, Tanager to investigate composition and its software layer to deliver results.
That combination is the potential business. Tanager-2 will matter if it converts spectral richness into reliable, repeatable decisions. Reaching the launch site is progress. Operational cadence, validated analytics and paying customers will be the real test.