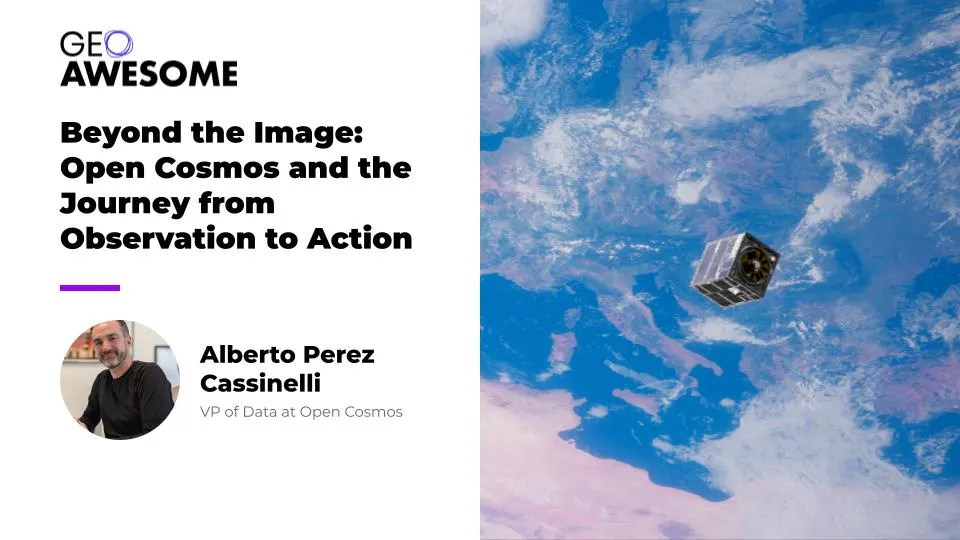

At INTERGEO 2026, Alberto Perez Cassinelli spoke with Geoawesome about combining Earth observation, onboard processing and satellite communications. The conversation began with the case for another constellation and ended with a harder question: what makes the information it delivers trustworthy?
Why another satellite constellation?
That was the question I put to Alberto Perez Cassinelli, VP of Data at Open Cosmos, when we sat down at INTERGEO. I wanted to understand what the company was proposing beyond another source of imagery. For the people using Earth observation, the important question is what those observations allow them to do.
Perez Cassinelli’s answer brought together two businesses that might otherwise be discussed separately: observing the Earth and connecting it. Open Cosmos, he explained, is developing Earth observation and telecommunications constellations within a common architecture. The intention is to shorten the path between collecting a measurement in space and getting useful information into someone’s hands.
“What we are doing is creating the ultimate machine for understanding and connecting our world,” he said. It is an expansive description, but the practical idea behind it is worth exploring: what if a satellite could do more of the analytical work itself, then pass the result through a communications network rather than treating collection, processing and delivery as separate problems?
That question became the thread running through our conversation. It connected the company’s near-real-time ambitions to disaster response, its shared infrastructure model to national control, and its plans for AI-ready data to a discussion about provenance. The more we talked about moving information quickly, the more important it became to ask what happens to that information along the way.
Bringing observation and communication together
When Perez Cassinelli described the relationship between imaging and telecommunications, I asked what it would mean in practice. Was the idea to relay information through other satellites rather than wait for a ground station pass?
His answer went beyond transmission. “We are going to provide not only imaging capacity but more processing capacity,” he explained. Customers would be able to process products in space and use the telecommunications constellation to deliver the results.
In that model, processing is part of the observation service, not simply something that happens after an image reaches a customer. Perez Cassinelli described DataCosmos as the access point for collecting new imagery, finding archive data and, as the onboard capabilities develop, running customers’ own analytics in orbit.
OpenConstellation 1.0 gives that architecture a specific ambition: actionable intelligence in as little as 30 minutes, combining rapid tasking, onboard AI processing and communications through ConnectedCosmos and partner networks, according to the company’s announcement. The first two satellites, Posidònia and Hyperion GR-1, launched on 7 July 2026, according to the launch announcement.
In the interview, Perez Cassinelli described a planned 15-satellite constellation, with four to five revisits a day and collection capacity of approximately three million square kilometres daily. Those are the intended capabilities of the constellation, rather than a description of what two spacecraft alone can provide.
The 30-minute figure also needs to be understood in context. The DataCosmos product page distinguishes 30-minute insights delivered through inter-satellite links from four-hour rush delivery and 24-hour standard delivery. It is the company’s best-case proposition, not a promise that any location can be observed and analysed within half an hour of a request.
For a user, however, the underlying ambition is easy to understand. Reducing the time spent moving and processing data could leave more time to act on what it reveals. Disaster response is where that proposition becomes particularly tangible.
When the useful product is an answer
I asked Perez Cassinelli where he saw the strongest demand. Defence remained important, he said, but his answer quickly broadened to civil government: wildfires, floods and earthquakes, alongside maritime monitoring.
Consider the questions a response team might need to ask after a flood. Which areas appear to be inundated? Has the situation changed since the last observation? Where should teams seek further confirmation before committing resources? These are questions about a developing situation, not requests for imagery for its own sake.
The same distinction applies to a wildfire, earthquake or landslide. An image can be part of the evidence, but its operational value depends on what can be established from it and how quickly that finding reaches the people responsible. A rapid but ambiguous result may still require interpretation; a well-understood result delivered too late may miss the decision it was meant to support.
Open Cosmos’s government missions give this ambition a concrete setting. The Posidònia mission is intended to support the Balearic Islands in responding to fires, storms and floods, while Hyperion GR-1 lists flood monitoring and disaster assessment among its applications. These are intended uses, rather than evidence that the complete 30-minute service has already been demonstrated across those hazards.
There is also earlier work behind the onboard-processing approach: on ESA’s Φsat-2 mission, built and operated by Open Cosmos, the Sat2Map application was designed to generate maps for teams responding to disasters including floods and earthquakes, according to the mission announcement. The relevance is the approach itself: undertaking analysis close to where observations are collected, then transmitting information selected for its usefulness.
When I suggested that this could mean sending results rather than every pixel, Perez Cassinelli put it simply: “We can sell the pixels, but we also sell the results.” Customers, he added, could use the infrastructure to deliver those results to their own end users.
That does not make imagery unimportant. It changes what the service is being asked to deliver. The customer may want to inspect an image, run a specialised analysis or receive a result inside an existing workflow. The proposition is to support those different needs without making every customer assemble the entire chain themselves.
Who gets to decide where the satellites look?
For a government, a faster service is only part of the equation. It also matters whether the required collection capacity will be available when needed, and who controls it. That brought us back to the business model behind OpenConstellation.
Perez Cassinelli described a shared system built around anchor customers. A country commissions a mission and controls collection over its area of interest. Outside that area, Open Cosmos uses available capacity to serve other customers; in return, the anchor customer gains access to capacity from the wider constellation.
He described the intended benefit as doubling or tripling the customer’s collection capacity within its area of interest. “We deliver sovereign solutions with a lower CAPEX,” he said. “We lower the entry barrier for many countries and governments.”
When I asked whether this additional capacity meant buying existing images or commissioning new observations, he was clear: it was about collecting new imagery through tasking. The distinction matters because access to an archive and the ability to request a fresh observation answer different needs.
There is an industrial dimension, too. Perez Cassinelli emphasised local integration and the effort to involve local suppliers. In his account, the proposition is not simply access to a satellite, but participation in the capability behind it.
This helps explain how the commercial model connects to the technical ambition. A shared constellation is intended to offer more collection opportunities than an individual national asset, while preserving defined customer control. For governments, the detail of those arrangements will matter as much as the headline performance: faster delivery is useful only if they can obtain the observation they need.
The next user may be an AI system
From there, our conversation moved to another kind of customer. I asked Perez Cassinelli about foundation models, and he described plans to develop an AI-ready embedding layer on top of OpenConstellation 1.0 for AI agents. He presented it as work ahead, not an already available product.
His broader expectation was clear. “We see in the future a big demand coming from AI-based systems,” he said. “We believe that Earth observation is a critical data for knowing our physical world.”
For me, the important connection is between that demand and the earlier discussion about new collections. A model can work with the observations it has, but an older image cannot establish what happened after it was acquired. Historical data remains valuable as a baseline; a current observation allows a system to test whether that baseline still describes the situation.
That is also why the discussion extends to digital twins, which Open Cosmos identifies among the integration targets for its data services. Consider a twin intended to support decisions about a changing landscape. Its usefulness should depend not just on how convincingly it represents the world, but on which conditions have actually been observed, when they were measured and how confidently they can be interpreted.
Perez Cassinelli’s sensor strategy fits that ambition. Rather than prioritising a single type of imagery, he described combining multispectral, shortwave infrared and hyperspectral observations into a common product. His emphasis was on the combination of spatial and spectral information and the applications it could support.
The attraction is more than faster refreshes. It is the possibility of providing different measurements of the same changing world in a form that analytical systems can use. But making information easier for machines to consume also makes its history more important: an output should not become harder to question simply because it arrives ready for an AI workflow.
Faster information still needs a history
That was the point at which I pressed Perez Cassinelli on trust. If a product is passed between providers, processed into another form and used as input to an analytical system, how does the eventual user know what they are looking at?
He described metadata, unique identifiers and checksums as elements of Open Cosmos’s approach. I challenged the distinction between identifying a product and establishing that its pixels had not been altered. He acknowledged that pixels could be changed and argued for comparing the data used in analytics against the original.
I then raised a complication: processing intended to improve an image, such as removing cloud cover, also changes it. The question is therefore not simply whether a file has changed, but what was changed, by whom and for what purpose. We were no longer talking only about the source of an image; we were talking about the history of a result.
Perez Cassinelli returned to traceability across the supply chain. “I don’t think there is an ultimate solution yet for this,” he said. It was a useful acknowledgement of the difficulty, rather than a claim that an identifier alone resolves it.
We had started with why the industry needed another constellation. By the end, the more interesting question was what users should expect from one. Open Cosmos is proposing to connect collection, analysis and delivery more closely, with a business model designed to share capacity without eliminating national control.
The promise is not merely that information will arrive sooner. It is that the information will arrive in a form someone can use. As more of that interpretation happens in orbit or inside AI systems, the ability to trace the result back to its observations becomes part of the service itself.
Selling results rather than only pixels is a compelling direction. The strongest version of that proposition will give users both an answer they can act on and enough visibility to understand why they should trust it.
Interview excerpts: inside the operating model
The following excerpts add detail on operations, local industry and customers. Questions and answers have been condensed and edited for clarity; researched context has not been inserted into Alberto’s responses.
Do you hand a satellite over to the customer, or do you continue operating it?
Alberto Perez Cassinelli: We have different models. One is called OpenOrbit. With that model, we deliver the mission turnkey to the customer, so typically we transfer operations.
With OpenConstellation, the mutualised model, we operate the spacecraft. Governments control the tasking and the capacity over their area of interest.
How important is working with local industry to your approach?
Our approach is mainly this 2x–3x model with local integration. That is important. We work together with local industry and integrate the satellites locally. Typically, we put together a factory where we deliver the solutions, and we make a big effort to integrate local providers.
Are your customers mainly in Europe?
We have customers worldwide, mainly in Europe, but from Japan to Argentina. Regarding factories and offices, our main capacity is in Europe. We have factories at our headquarters in the UK, and also in Spain, Portugal and Greece.
Do you intend to prioritise a particular application?
Real time for emergencies, defence and intelligence is one of our competitive edges. The other is our combination of spatial resolution and spectral information in a broader product that can unlock applications for agriculture, for instance.
What does DataCosmos allow customers to do?
It is a space intelligence platform, the access point to the constellation for tasking satellites and accessing the archive. We deliver data services through the platform.
Users can upload their own analytics to the satellite, run products onboard with edge computing, and deliver the results using the constellation’s inter-satellite links. Customers can use our infrastructure to deliver results to their final users.



#Business

Next article

A new open-source GIS written in Rust runs natively and in the browser, starts in a fraction of a second, and treats every button as a scriptable command. Four releases appeared in thirteen days. We read the code, tested RustGIS 0.4 against QGIS and plain Python, and found a young tool with an unusually solid core and some clear rough edges.
Most open-source desktop GIS share the same foundations: GDAL for reading data, PROJ for coordinates, Qt or a web view for the interface. RustGIS replaces almost all of that with code written in Rust. It reads GeoPackage, GeoParquet, FlatGeobuf, Shapefile, GeoTIFF and COG with its own readers, draws maps on the GPU through wgpu, and compiles the whole application to WebAssembly, so the same program runs at web.rustgis.app with nothing to install. GDAL and DuckDB become optional extras on the desktop rather than requirements.
The project comes from opengeos, the organisation of Qiusheng Wu, best known for the Python packages geemap and leafmap. Version 0.1.0 appeared on 12 October 2026, three more releases followed by 25 October, and the repository passed roughly 2,000 stars and 280 forks within its first two weeks.
How it is built. The project README states that RustGIS is “primarily built with Claude Opus 5.5, an AI model by Anthropic, working under human direction and review”, and asks users to check results for their own use. That explains part of the release pace, and it is one more reason to test outputs rather than take them on trust, which is what the benchmark below does.
Four releases in thirteen days
Everything is a command
The design decision that matters most for professional users is not the language. Every action in RustGIS, every ribbon button and menu item, is an engine command with an id and JSON parameters. Version 0.4.0 exposes 497 of them. The ribbon, the command line, the Python package, the AI assistant and external AI agents all call the same commands, so a workflow clicked together in the desktop app can be repeated from a script without translation.
The code is split into layered crates, each depending only on the layers below it. That is what lets the same engine run headless on a server, inside a Jupyter kernel, as a desktop app and in a browser tab.
Inside RustGIS: the crate stack
Highlighted: the engine layer that the command line and Python package expose.
From the architecture table in the RustGIS README (v0.4.0).
Same terrain, two interfaces
RustGIS borrows its layout from ArcGIS Pro rather than QGIS: a ribbon with tabs ordered by workflow (Home, Data, Style, Edit, Analyze, View, Publish), a Layers pane on the left and context panes on the right. Here is the same Copernicus GLO-30 elevation tile over the Karkonosze mountains (Poland, Czech Republic) in both programs.
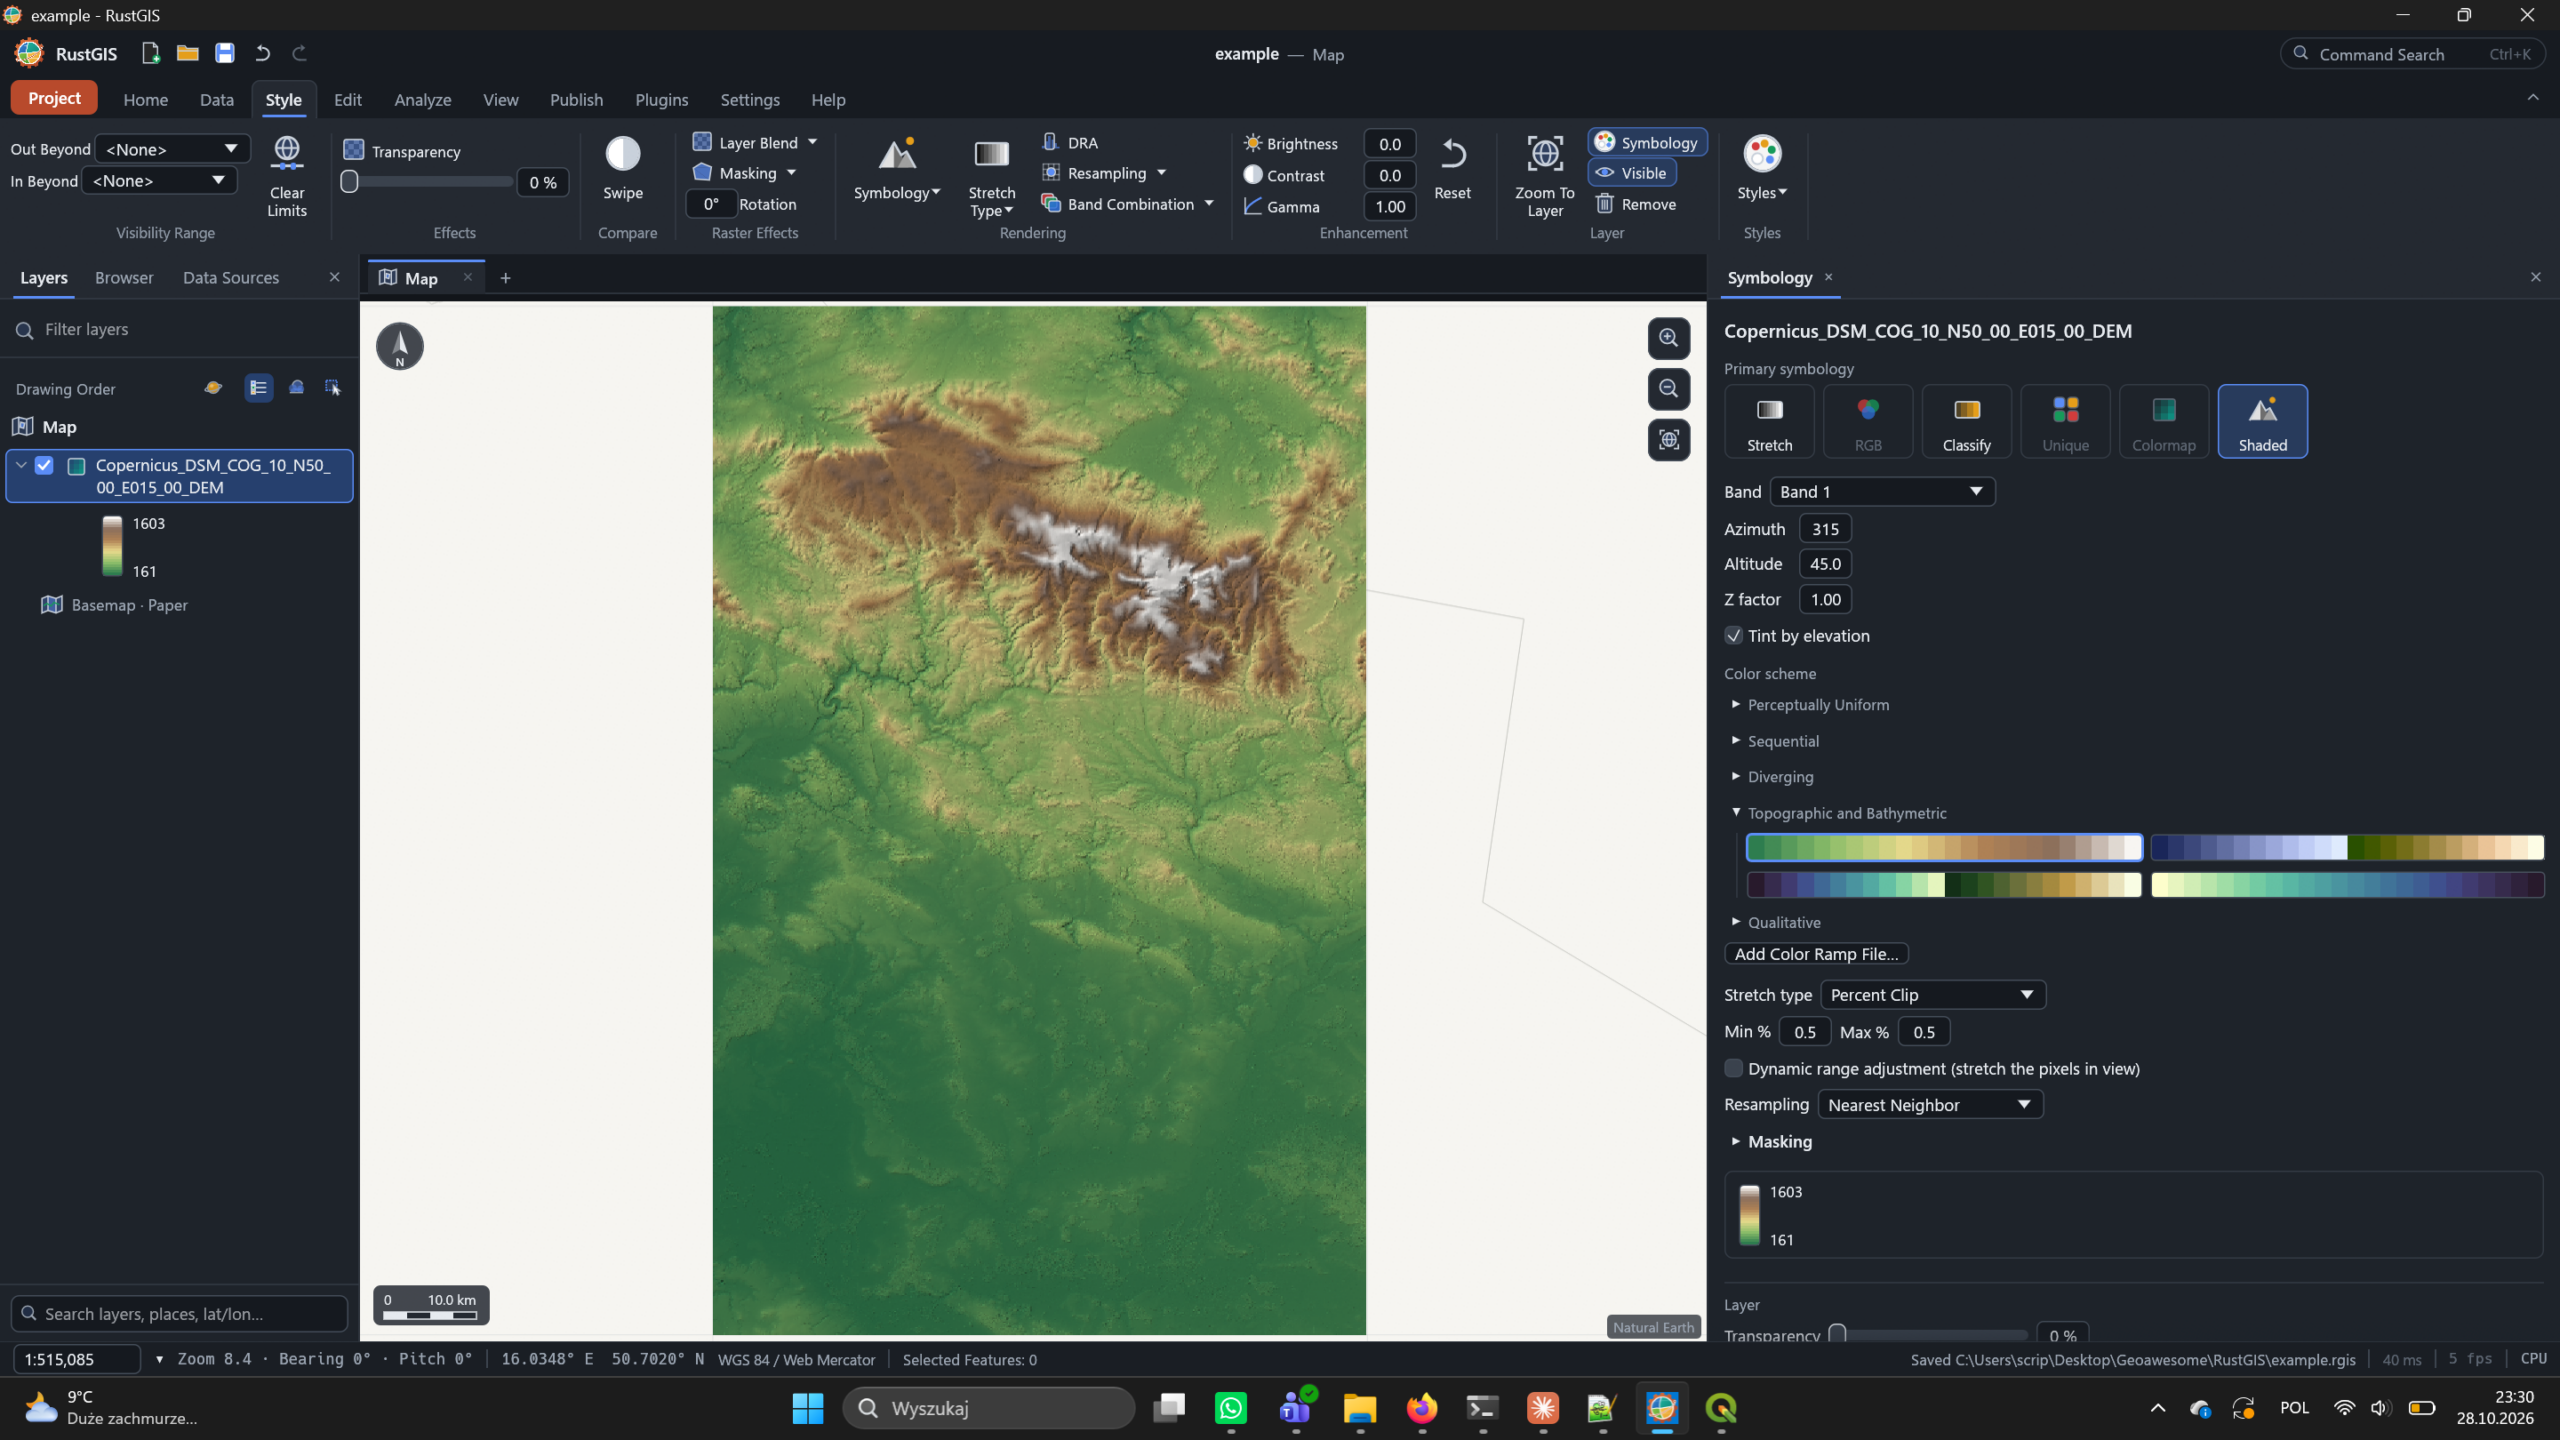
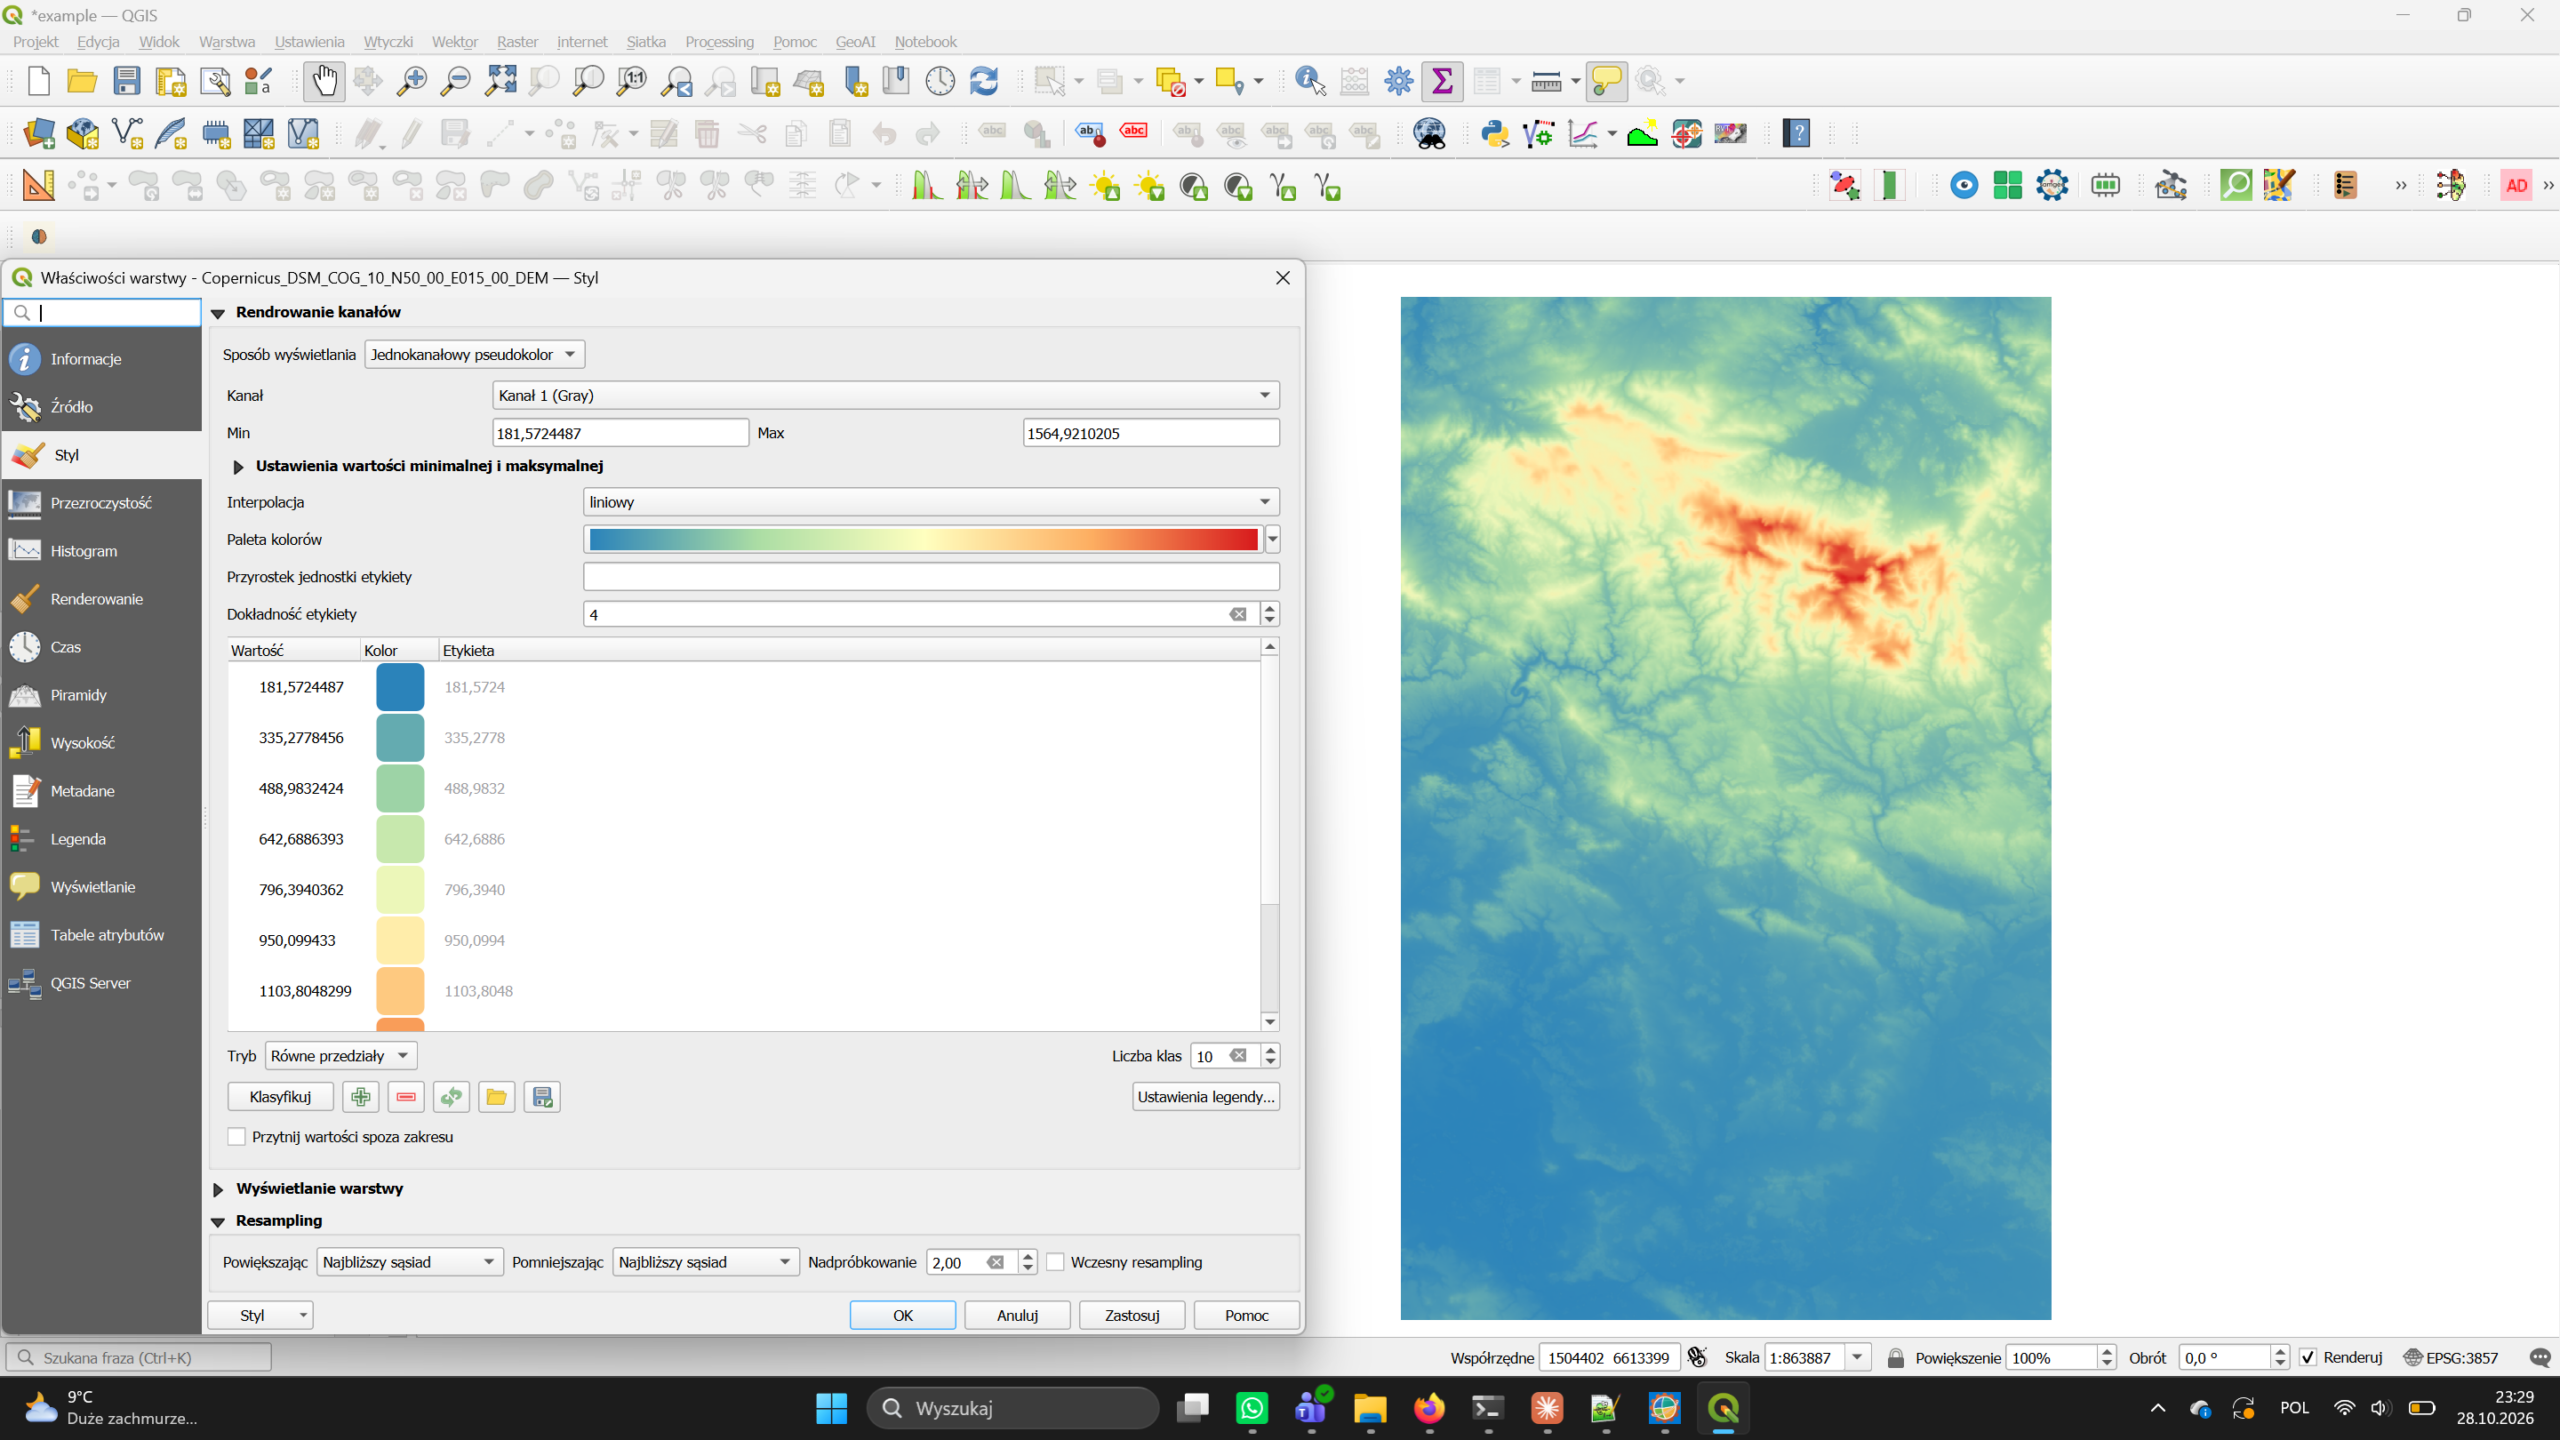
Copernicus DEM GLO-30, tile N50 E015 (© DLR e.V. 2010–2014 and © Airbus Defence and Space GmbH 2014–2018, provided under COPERNICUS by the European Union and ESA).
How it compares on paper
The RustGIS documentation includes its own comparison with QGIS and ArcGIS Pro. It is the developer’s description of their software, so read the RustGIS column as a claim.
| RustGIS 0.4 | QGIS | ArcGIS Pro | |
|---|---|---|---|
| Platform | |||
| Licence | Apache-2.0, free | GPL-2.0+, free | Proprietary |
| Runs on | Windows, macOS, Linux, browser | Windows, macOS, Linux | Windows only |
| Interface | Ribbon, tabs by workflow | Toolbars and panels | Ribbon |
| Data | |||
| Formats | Broad, own readers; GDAL optional | Widest (GDAL/OGR) | Very wide, Esri formats |
| Cloud-native | GeoParquet, FlatGeobuf, PMTiles, COG over HTTP; Zarr | GeoParquet, FlatGeobuf, PMTiles, COG, Zarr | GeoParquet, COG, Zarr |
| Projections | Rasters in any EPSG; vectors in lon/lat, no full PROJ | Full PROJ | Full support |
| Databases | PostGIS, MySQL, SQL Server read-only (desktop) | PostGIS, SpatiaLite, Oracle, SQL Server | Enterprise geodatabases |
| Analysis and maps | |||
| Tools | Built-in plus 1,000+ GeoLibre/Whitebox | 1,000+ (GDAL, GRASS, SAGA) | Most complete, paid extensions |
| Print layout | Presets, legends, map series; PDF, PNG, SVG | Full composer with atlas | Full layout view |
| Web export | Single-file HTML web map, OGC API Features | Via qgis2web | None |
| Automation | |||
| Scripting | Every action is a command: CLI and Python package | PyQGIS, qgis_process | arcpy |
| Plugins | Sandboxed WebAssembly plugins, new registry | Thousands of Python plugins | .NET add-ins, Python toolboxes |
| AI | Assistant with undo; MCP server for agents | Via plugins | Copilot features |
The same page is unusually candid about where RustGIS falls short:
- Vector data is held in longitude/latitude; there is no full PROJ.
- PostGIS, MySQL and SQL Server are read-only and desktop-only.
- No versioned or multi-user editing; edits are not written back to databases.
- DWG, JPEG 2000, NetCDF and HDF need GDAL; the web app cannot write GeoPackages.
- Network datasets and advanced spatial statistics need the external tool suite or another GIS.
- Many features are first versions; there is no Python console inside the app.
What we measured
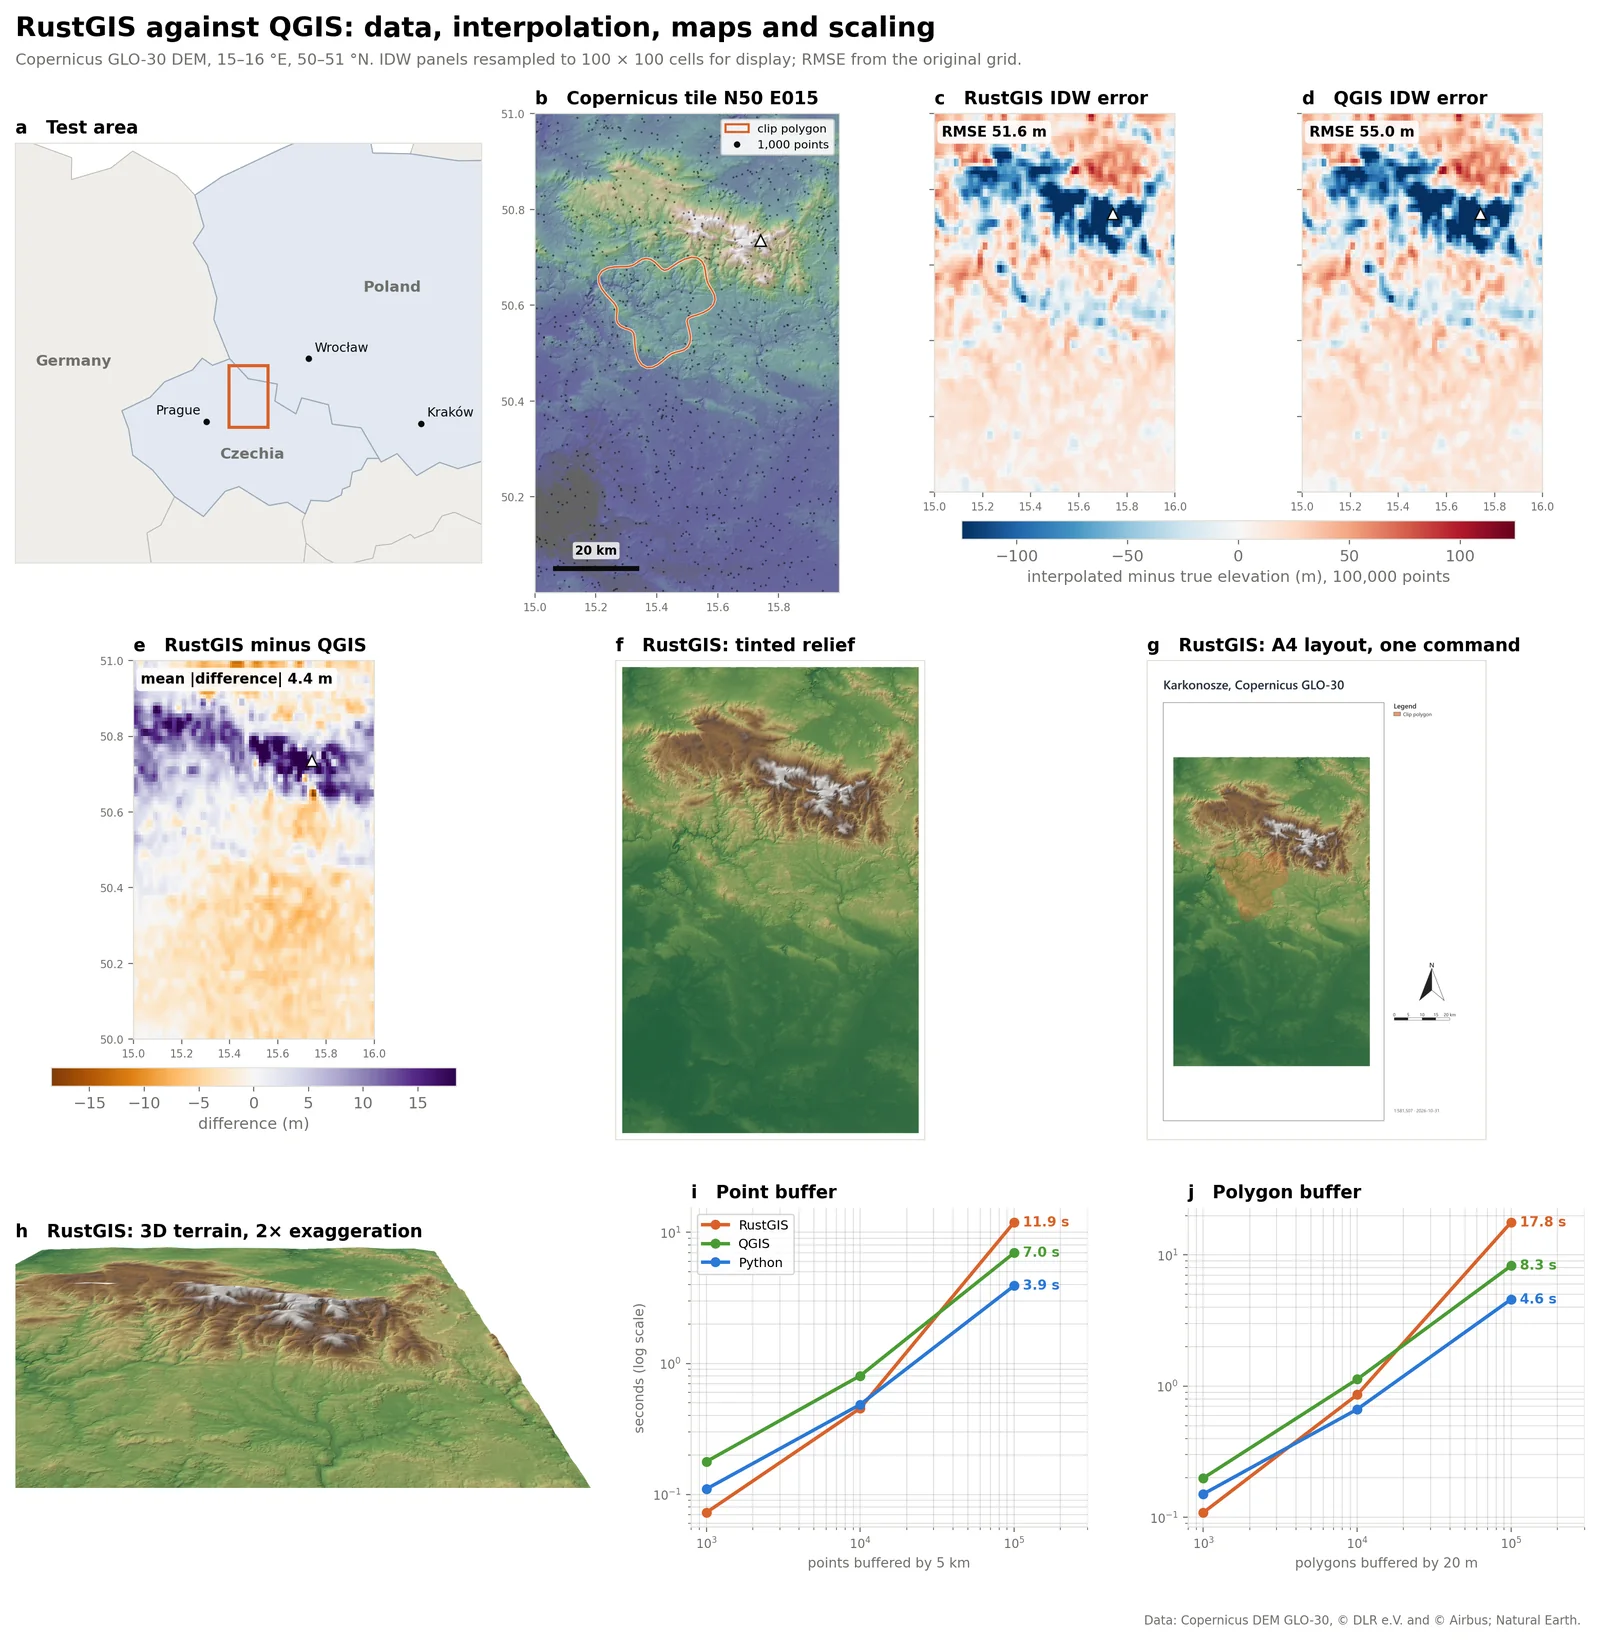
Claims of speed are easy to make, so we wrote a benchmark notebook that runs the same jobs on three engines: RustGIS 0.4.0 through its Python package, QGIS 3.34.11-Prizren through a persistent PyQGIS process (so QGIS starts once, as it does in the desktop app), and plain Python with GeoPandas, Shapely, NumPy and rasterio. Every engine reads the same files and writes the same outputs. Each case runs at least three times and we report the median. Shorter bars are faster; a tick marks the fastest engine.
Cold start: time to a ready engine
A fresh process starts and loads its GIS engine; median of five starts.
Memory at start-up
Peak resident memory while starting.
Buffer 100,000 points by 5 km
Read a GeoPackage, buffer every point, write a GeoPackage.
Slope of a 30 m DEM (8.9 million cells)
Same DEM and Horn method in every engine. GeoLibre is the tool suite RustGIS ships.
IDW, 100,000 points
On a 0.01° grid RustGIS refuses this job as “too much work”; on 0.02° it finishes. Python reproduces each engine’s distance method.
Draw 100,000 buildings, zoomed to 4 × 3 km
Almost every footprint is off-screen. QGIS and Python only read what is visible.
Export an A4 map at 300 dpi
Hillshade, AOI, title, legend, scale bar and north arrow.
Read and write 100,000 polygons as GeoParquet
This QGIS build had no Parquet driver, so QGIS is missing here.
Run the same small job 100 times from a script
A loop over QGIS’s command-line tool pays QGIS start-up on every call.
Reference run on Windows, 16 logical cores, 33.6 GB RAM, RustGIS 0.4.0, QGIS 3.34.11-Prizren. DEM: Copernicus DEM GLO-30, tile N50 E015 (Karkonosze), 2,389 x 3,722 cells in UTM 33N. Absolute times depend on hardware; the ratios between engines carry over better.
What the numbers say
Starting RustGIS costs almost nothing. Loading the engine and creating an empty project took 0.15 s and 16 MB of memory, against 3.16 s and 169 MB for PyQGIS and 1.88 s and 122 MB just to import the Python GIS stack. It is the clearest confirmation of the project’s “fast and small” pitch, and it matters for scripts, notebooks and servers that start many short jobs.
Buffering slows down sharply at scale. Up to 10,000 features RustGIS keeps pace with QGIS and GeoPandas. From 10,000 to 100,000 its buffer time grows about 26 times (an exponent of 1.42, where 1 means proportional), against roughly ten times for the other two. The cause sits in the buffer step itself, not in reading or writing files, which suggests an algorithmic issue the developers can fix.
RustGIS chooses geodesic methods, and they are measurably different. Its buffers are built on the ellipsoid and its IDW uses great-circle distance, where QGIS works in map units. Interpolating 100,000 DEM-sampled points, the geodesic IDW was closer to the real terrain (RMSE 51.6 m against 55.0 m for QGIS, a gain of 6.1 %; small, but consistent). Measured against a true 5 km circle, its buffers are 0.29 % too small, against 0.57 % for QGIS’s planar buffers in UTM.
QGIS is hard to beat on raster work. With QGIS already running, its GDAL-based slope, hillshade and GRASS flow accumulation were the fastest in our tests. RustGIS’s slope time grows in step with raster size, so its raster engine has no scaling problem, but it ran five to seven times slower than GDAL at every size we tried. Its built-in slope matches QGIS on 99.9 % of cells; the differences sit only on the first cell next to nodata.
Drawing is fast, but RustGIS draws what you cannot see. RustGIS rendered 1,000 and 10,000 building footprints faster than QGIS. Zoomed into a 4 × 3 km window of 100,000 buildings, though, it took as long as for the whole area, while QGIS and Python only read the footprints in view. Rendering the DEM from a cloud-optimised GeoTIFF instead of a plain one made QGIS about 1.6 times faster and RustGIS only about 1.1 times, which suggests RustGIS is not yet taking full advantage of COG overviews.
Input, output and scripting are where it shines. RustGIS was the fastest of the three at writing an A4 map at 300 dpi, at reading and writing 100,000 polygons as GeoJSON and as GeoParquet, and at running the same small job 100 times from a script. A loop over QGIS’s command-line tool pays QGIS start-up on every call and took more than fifteen times as long.
The core is fast where Rust is expected to be fast: start-up, file input and output, scripting. The algorithms behind buffering, raster processing and rendering are still catching up.
Our reading of the benchmark
Try it in a minute
The quickest route needs no install at all: the web app at web.rustgis.app is the full program compiled to WebAssembly. On the desktop, winget install OpenGeos.RustGIS (Windows) or brew install --cask opengeos/rustgis/rustgis (macOS) installs the app and its command line. In Python 3.12 or later:
pip install rustgis
import rustgis
s = rustgis.Session(sample=True)
s.run("gp.run", tool="buffer", params={"input": "Cities", "distance": 100})
s.to_png("map.png")
The command line renders maps headless, and registers RustGIS as an MCP server so agents such as Claude Code, Cursor and VS Code can run GIS commands:
rustgis-cli render dem.tif dem.png
claude mcp add rustgis -- rustgis-cli mcp --sample
Where RustGIS stands
Three weeks after its first release, RustGIS is not a QGIS replacement and does not claim to be. It is a credible second architecture for open-source GIS, with a different set of trade-offs.
Already useful for
- Quick looks at data. Opens GeoParquet, COG and GeoPackage in place, in the browser if needed.
- Teaching and workshops. The web app runs on any laptop with no install and no admin rights.
- Scripted maps. One command builds a layout with legend, scale bar and locator; the CLI renders maps headless.
- Agent workflows. An MCP server lets AI agents run GIS commands with undo.
Not ready for
- Projection-heavy work. Vector data is held in lon/lat without full PROJ.
- Large vector processing. Buffering 100,000 features took 1.7 times as long as QGIS in our tests.
- Shared editing. No multi-user or versioned database editing.
- Plugin-dependent workflows. QGIS has thousands of plugins; RustGIS has a new registry.
Worth watching
- Release pace. Four feature releases in thirteen days; we will track whether that holds and whether quality keeps up.
- The renderer. The GPU backend was still marked beta in v0.3.0, and it does not yet skip off-screen features or lean on COG overviews.
- Sandboxed plugins. WebAssembly plugins run with explicit permissions on the desktop, the CLI and the web.
- Contributors. The citation lists five authors; a wider maintainer base would reduce the bus factor.
For the geospatial community, the more interesting question may not be whether RustGIS overtakes QGIS, but what it shows is now possible: a full desktop GIS, with layouts, 3D, cloud-native data and a scripting interface, built in weeks on a modern stack that runs equally on a laptop and in a browser tab. If its algorithms catch up with its architecture, RustGIS will be a serious option for lightweight and web-first GIS work.
Sources
- RustGIS repository and README
- RustGIS releases
- rustgis on PyPI (release dates)
- RustGIS comparison with GeoLibre, QGIS and ArcGIS
- RustGIS Python documentation
- It’s FOSS: RustGIS is a desktop GIS tool that also runs in a browser
- Copernicus DEM GLO-30
Benchmark: eleven tests on identical, seeded inputs (buffering, IDW, slope, hillshade, flow accumulation, raster clipping, rendering, map export, batch scripting, file formats).
Did you like this post? Read more and subscribe to our monthly newsletter!


