Tech for Earth: Ask the Planet a Question

Tech for Earth: Ask the Planet a Question
Geoawesome Team · November 2026 · 9 min read
ESA put an Earth observation expert behind a chat box and opened it to everyone. Three new FireSat satellites returned their first images and picked out burns the size of two parking spaces. The ocean set another record. And right now, thousands of people are turning November into a global mapmaking marathon – one new map a day, driven by pure passion.
ESA Puts an Expert Behind a Chat Box
The most quietly useful release this month is a text box. ESA’s Φ-lab published Earth Virtual Expert, or EVE, on 8 October, and it is now live for anyone who wants to use it.
EVE is a language model fine-tuned specifically on Earth observation and Earth science material: ESA, NASA and Copernicus sources, technical documentation, and peer-reviewed research supplied through a collaboration with Wiley. The deployed model, EVE-Instruct, is a 24-billion-parameter model built on Mistral Small 3.2 and tuned for reasoning and question answering. On Earth observation benchmarks the team constructed for the purpose, it outperformed comparable general models while keeping its general capabilities intact.
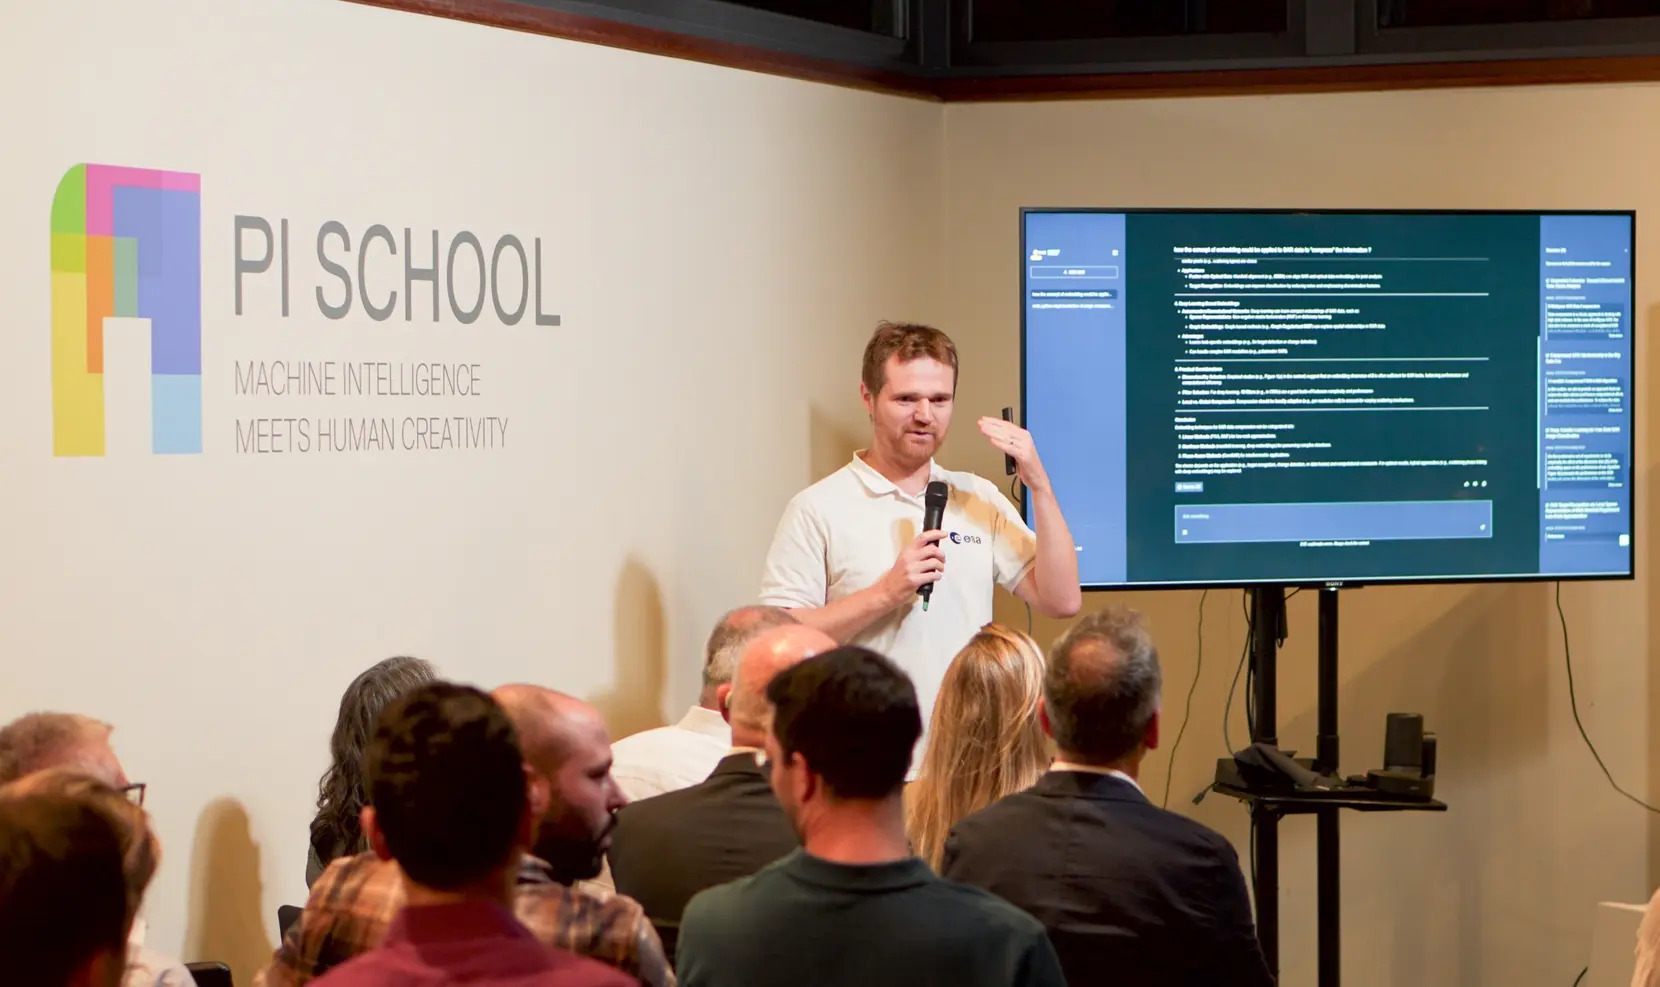
The part worth noting: the whole thing is open. Models, datasets and code are released under open licences at huggingface.co/eve-esa and github.com/eve-esa. That makes it one of the few domain-specific scientific language models you can inspect rather than just query.
For now, EVE is text-only and does not reason directly over Earth observation imagery or structured geospatial data.
ESA Φ-lab, stating the limits plainly
That caveat is ESA’s own, and more than most releases manage. EVE will explain what a backscatter coefficient is; it will not look at your scene. A second development phase began in September aimed at retrieving and analysing data and carrying out multi-step tasks, so the version you use today is the knowledge assistant, not the agent.
Chat with EVE
Free · open to all · no institutional login required
ESA Φ-lab with Pi School, Imperative Space, Mistral AI and Wiley
FireSat Opens Its Eyes
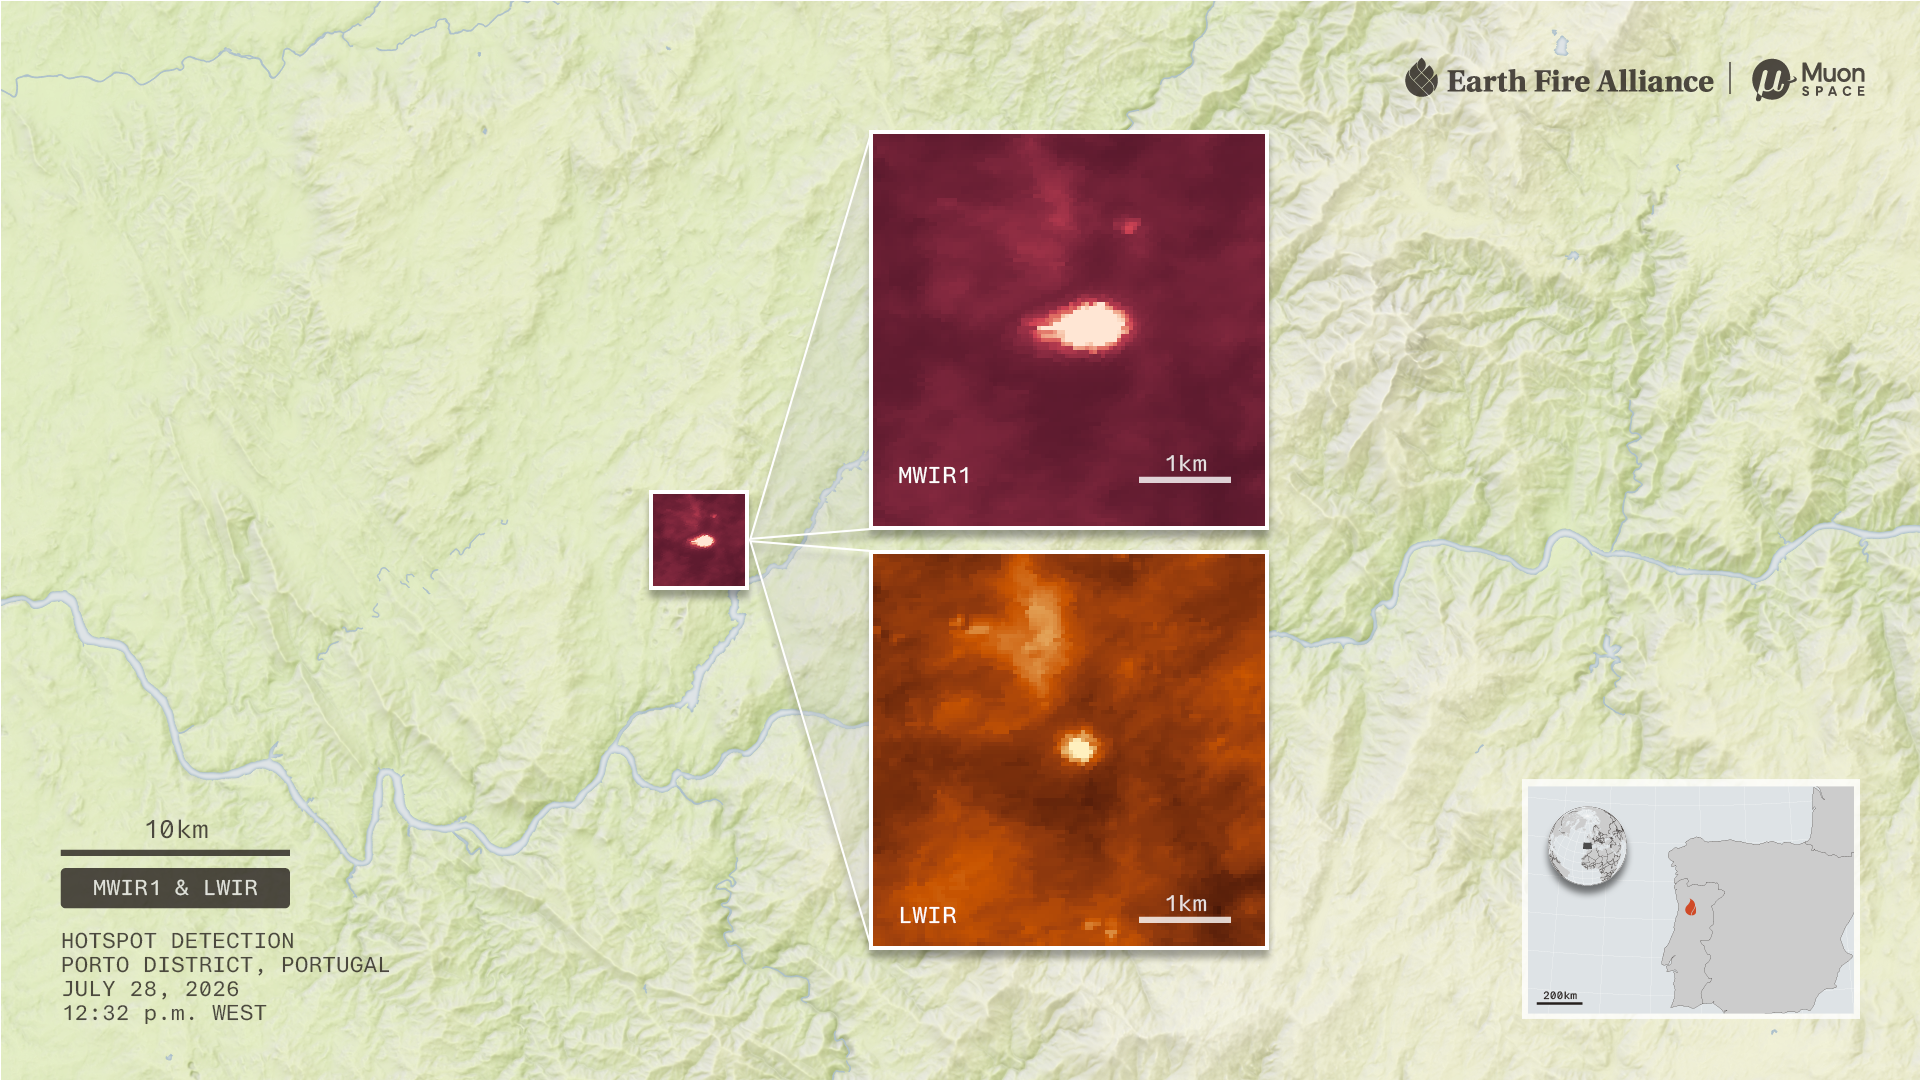
The first three operational FireSat satellites reached orbit on 7 July. On 16 September, Earth Fire Alliance and Muon Space released first light and the first active fire imagery from all three, collected about three weeks after launch.
First light is Dubbo, New South Wales, on 27 July, in three bands at once. The false-colour composite separates irrigated farmland from woodland, bare field and city. The midwave infrared band mixes temperature with surface type, so crop patterns and buildings still show through. The longwave band is a straight temperature map, with water and vegetation dark, bare field and pavement bright.
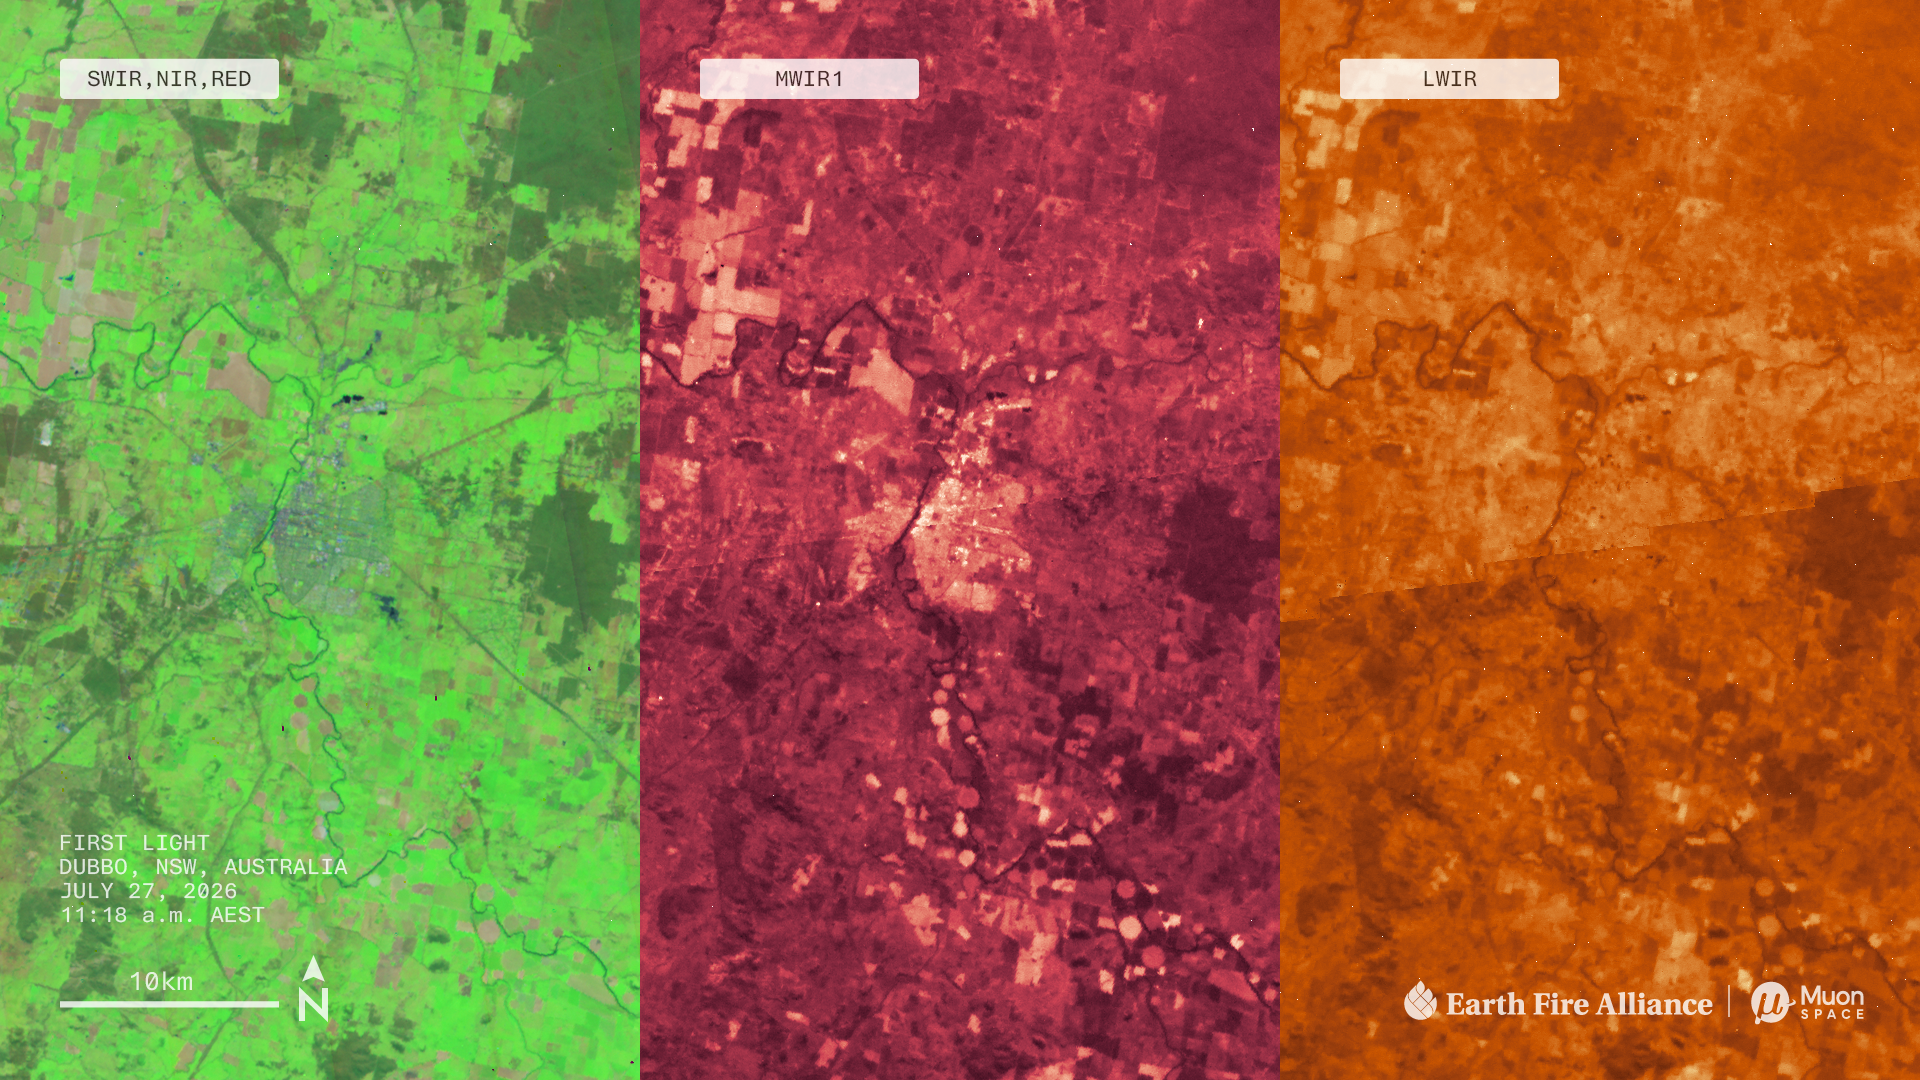
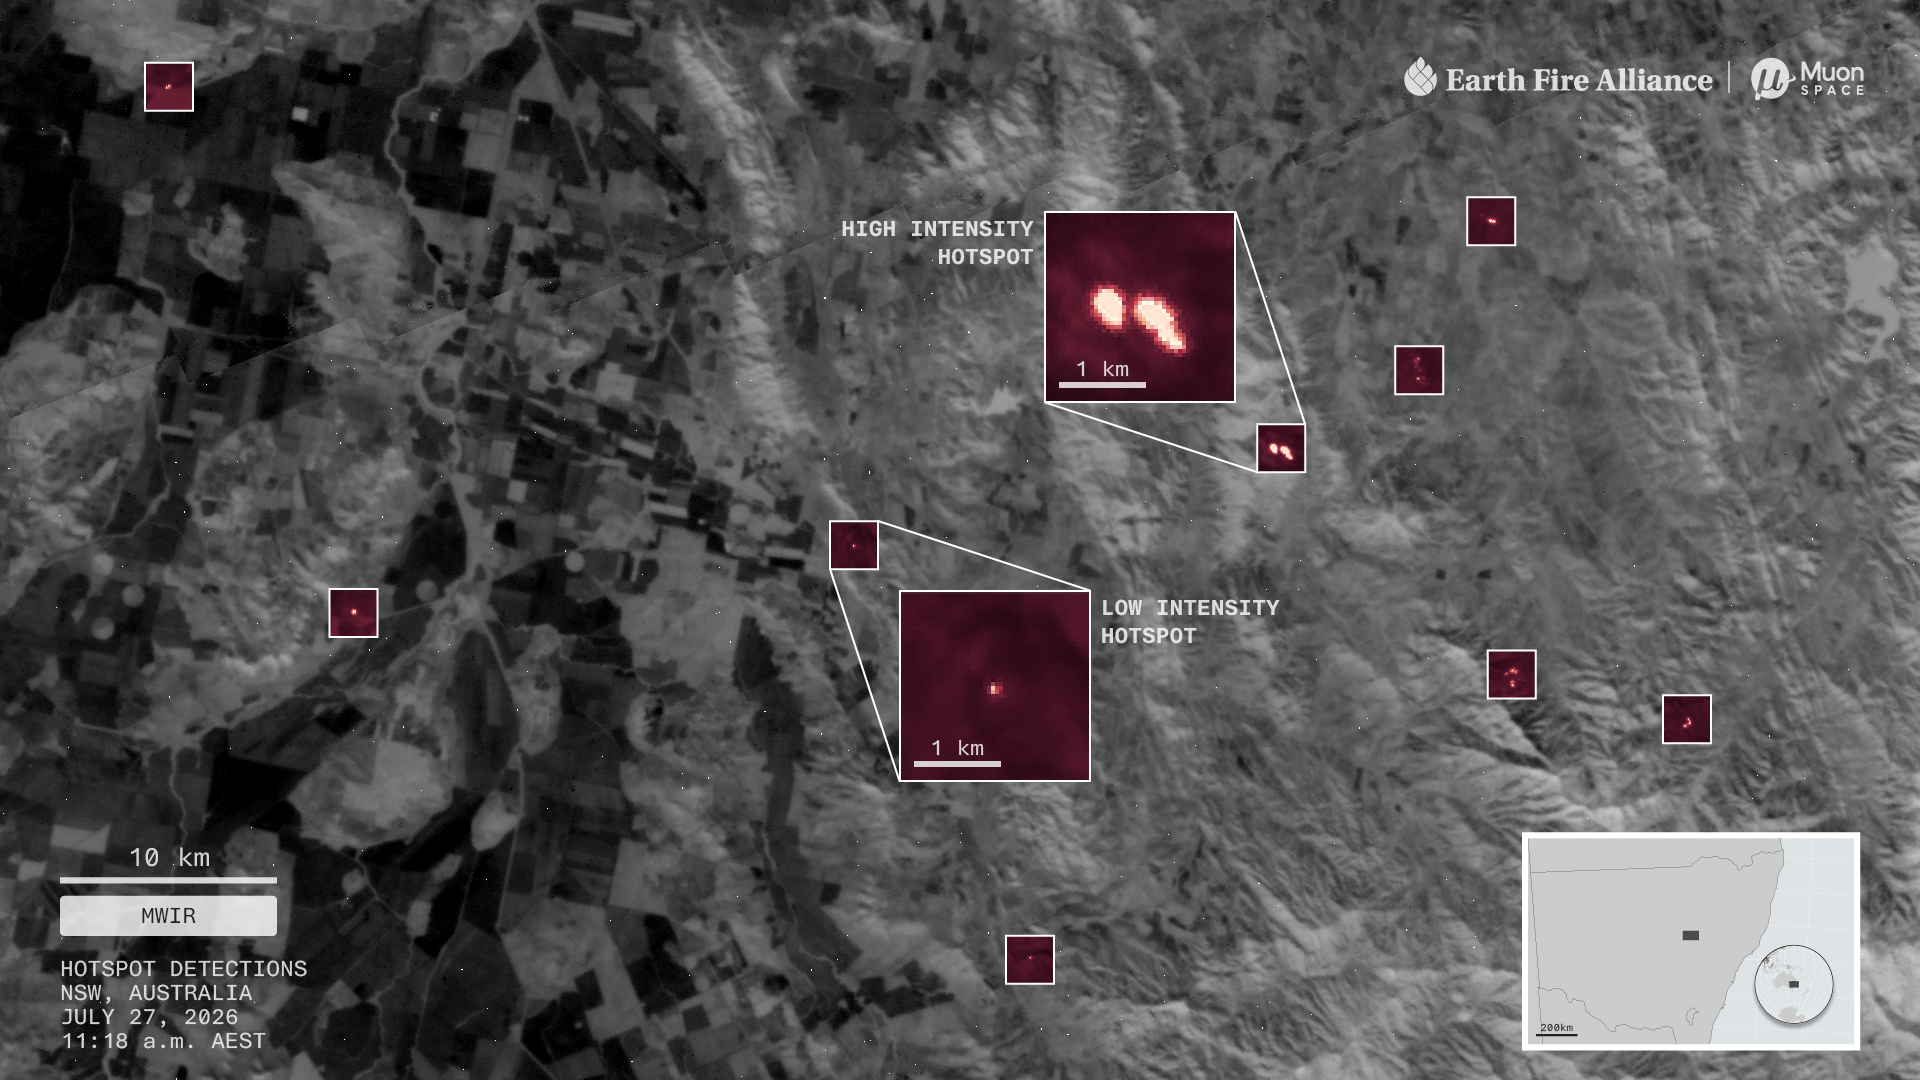
In the same pass the satellites picked up several small, cool fires scattered across the surrounding farmland, the kind associated with managed agricultural, hazard reduction or cultural burning. That is the capability that matters.
FireSat’s midwave infrared bands can detect fires as small as 5 by 5 metres, about the footprint of two parking spaces.
Muon Space and Earth Fire Alliance
The centrepiece is the Big Grass Fire on the Oregon-Idaho border, already 290,000 acres at the time of collection, about the area of Los Angeles. Grass and shrubland fires are chronically under-covered relative to their impact: between 1990 and 2020 they burnt more than twice the area of forest fires in the United States and accounted for nearly two thirds of homes lost to wildfire.
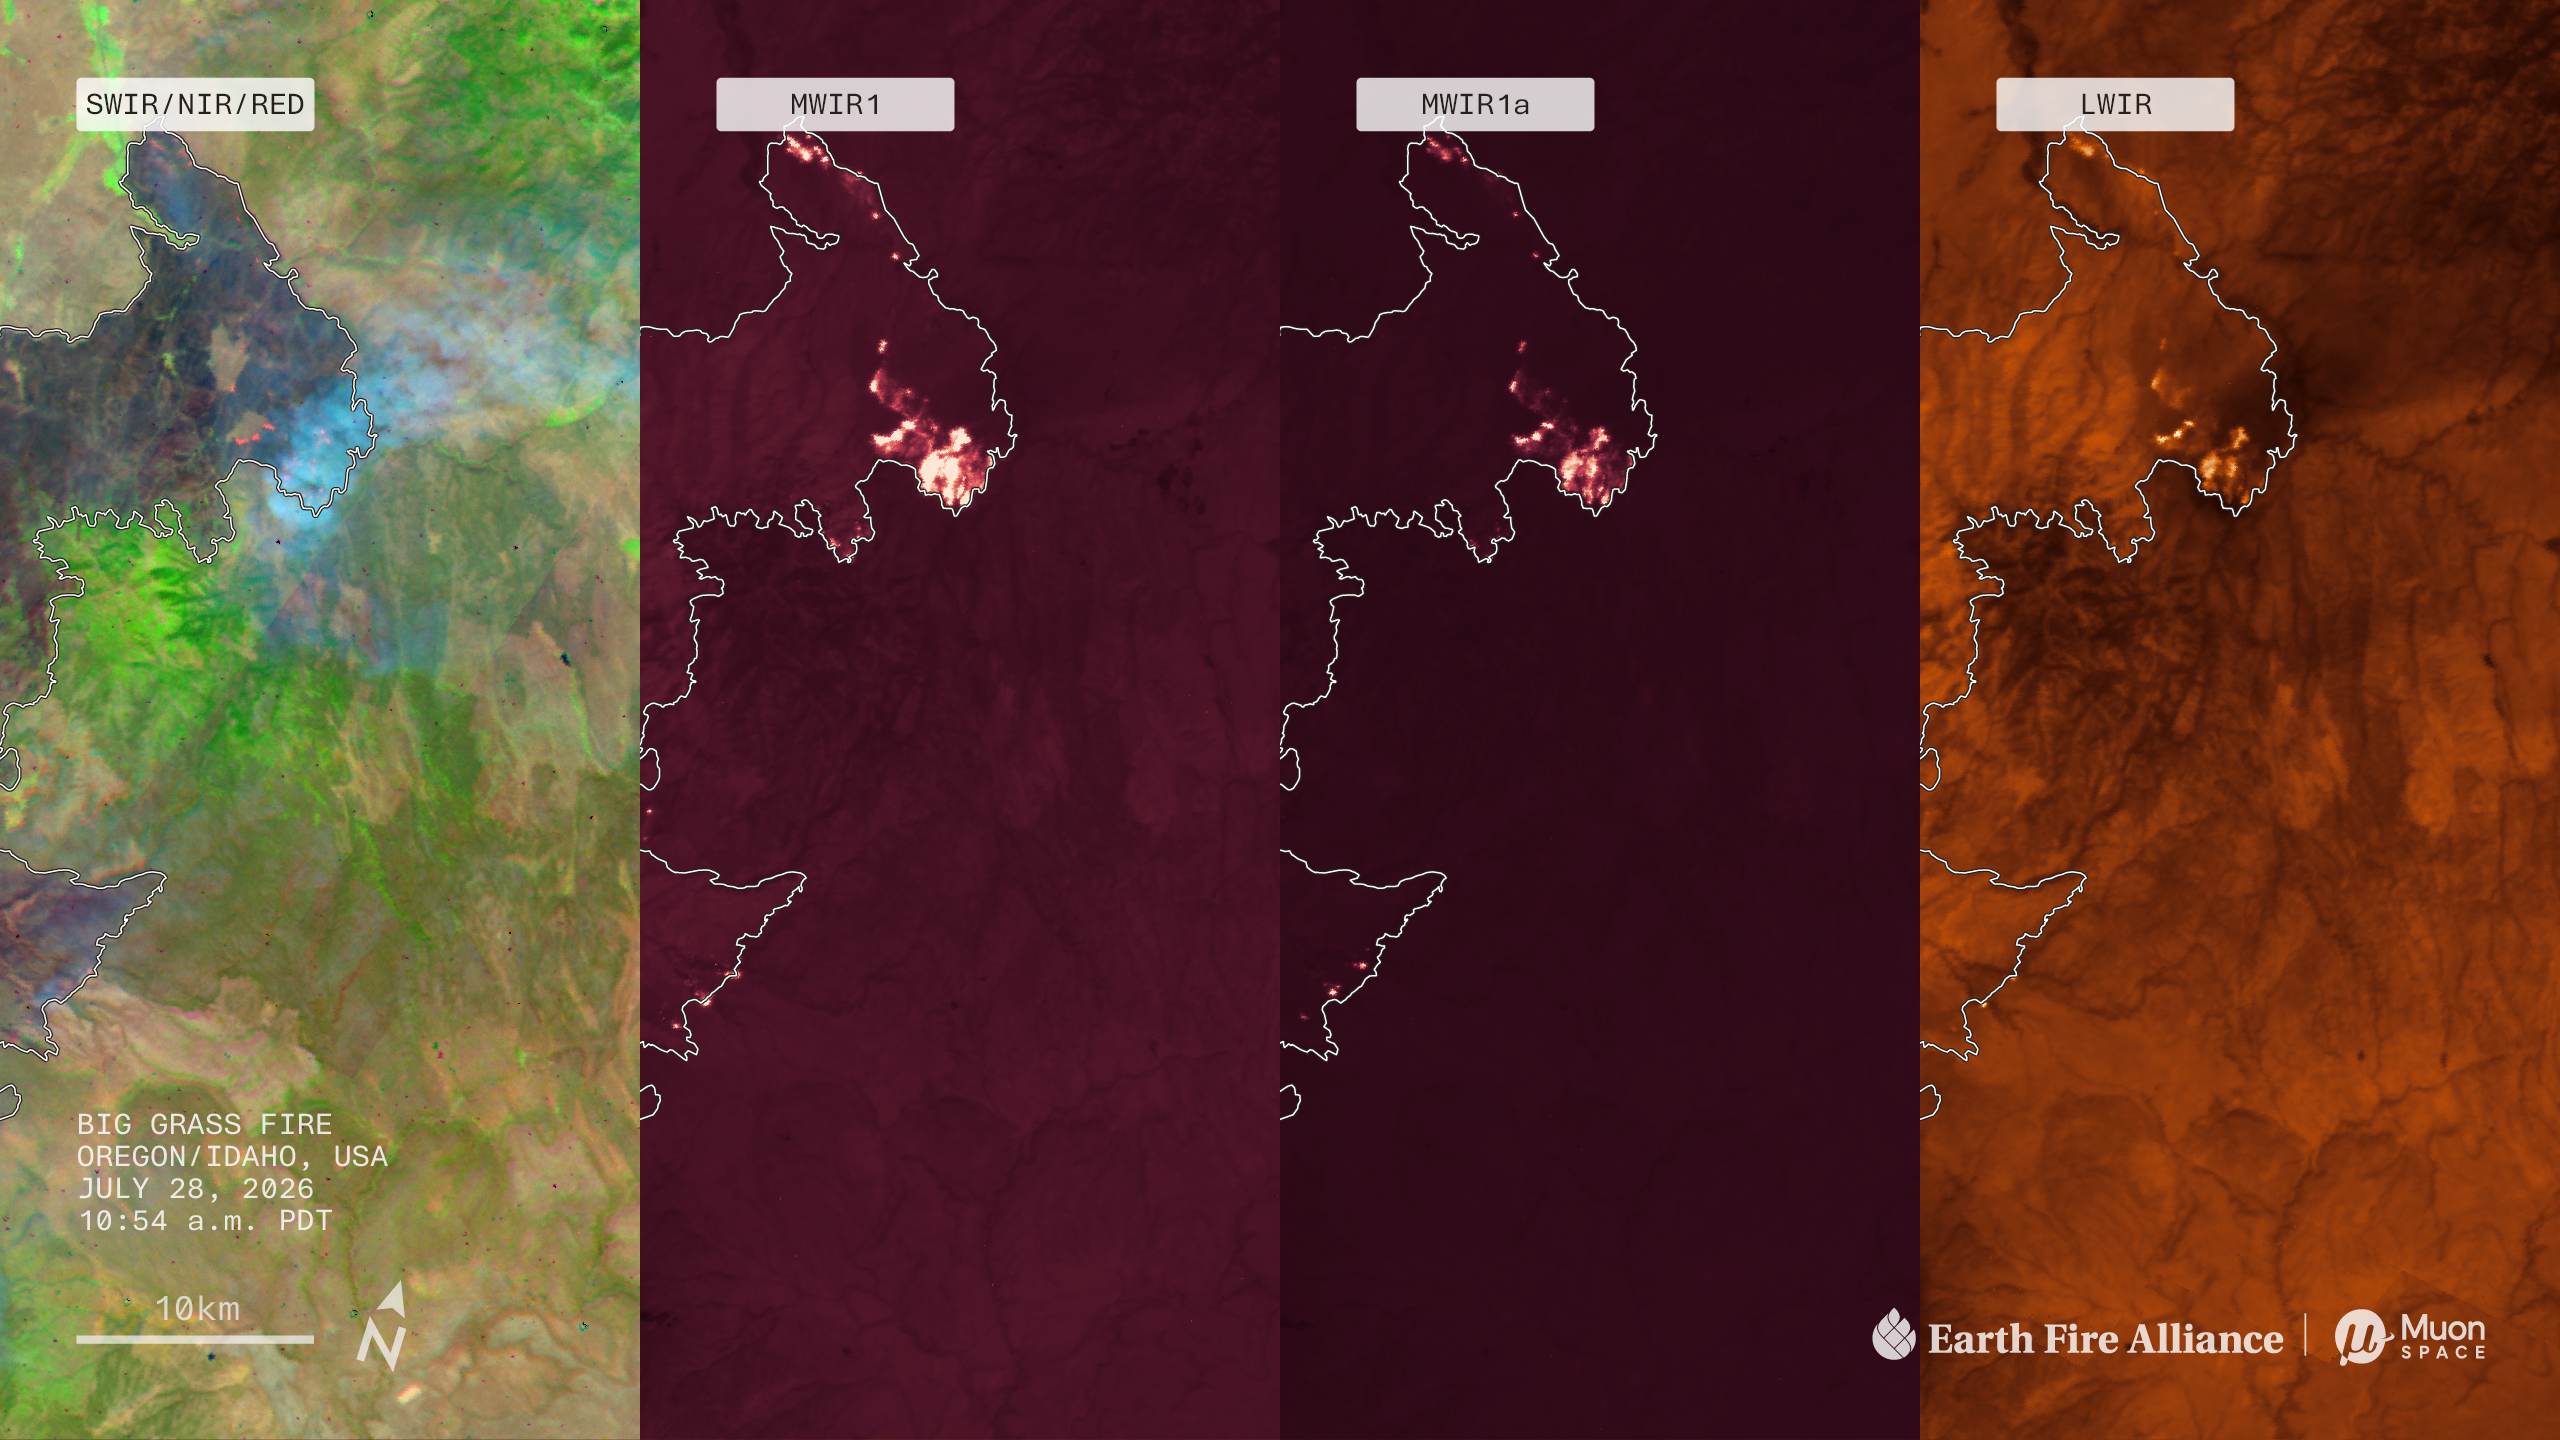
The band design is the interesting engineering. MWIR1 is tuned for sensitivity, which is what finds small and cool fires early, but it saturates on an intense front. MWIR1a is deliberately less sensitive, described by the team as eclipse glasses for looking at the sun, so the hottest parts stay measurable while new ignitions elsewhere remain detectable. LWIR catches smouldering ground and, usefully, helps reject false alarms from sunlight glinting off bright surfaces such as solar panels.
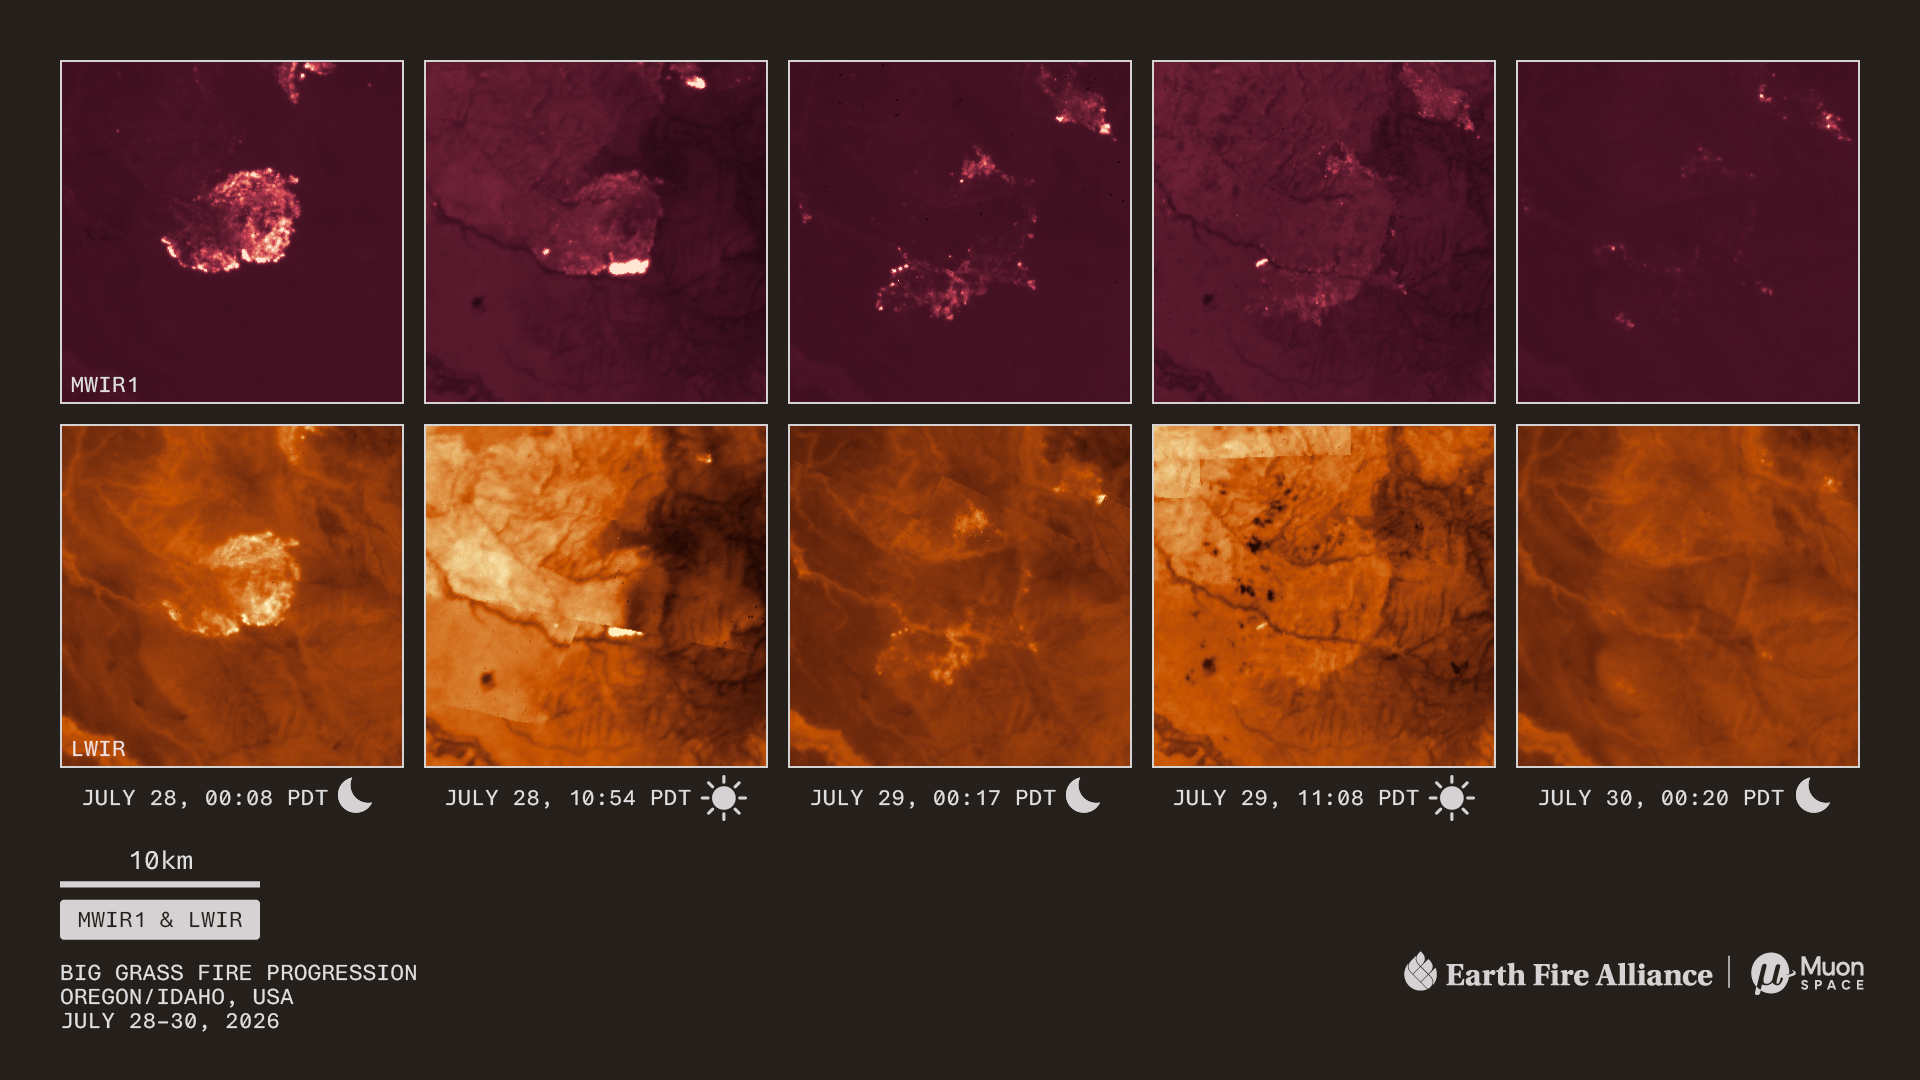
Worth being accurate about that timeline, because the revisit numbers get quoted loosely. The widely repeated 20-minute global revisit is an early-2030s target for the full constellation, not current capability.
Earth AI Grows Agents
Google Research published an update to Geospatial Reasoning on 14 October, extending the Earth AI work this roundup covered in September. The agent plans a multi-step workflow from a natural language question, selects the relevant Earth AI models, datasets and tools, then executes each stage in a workspace.
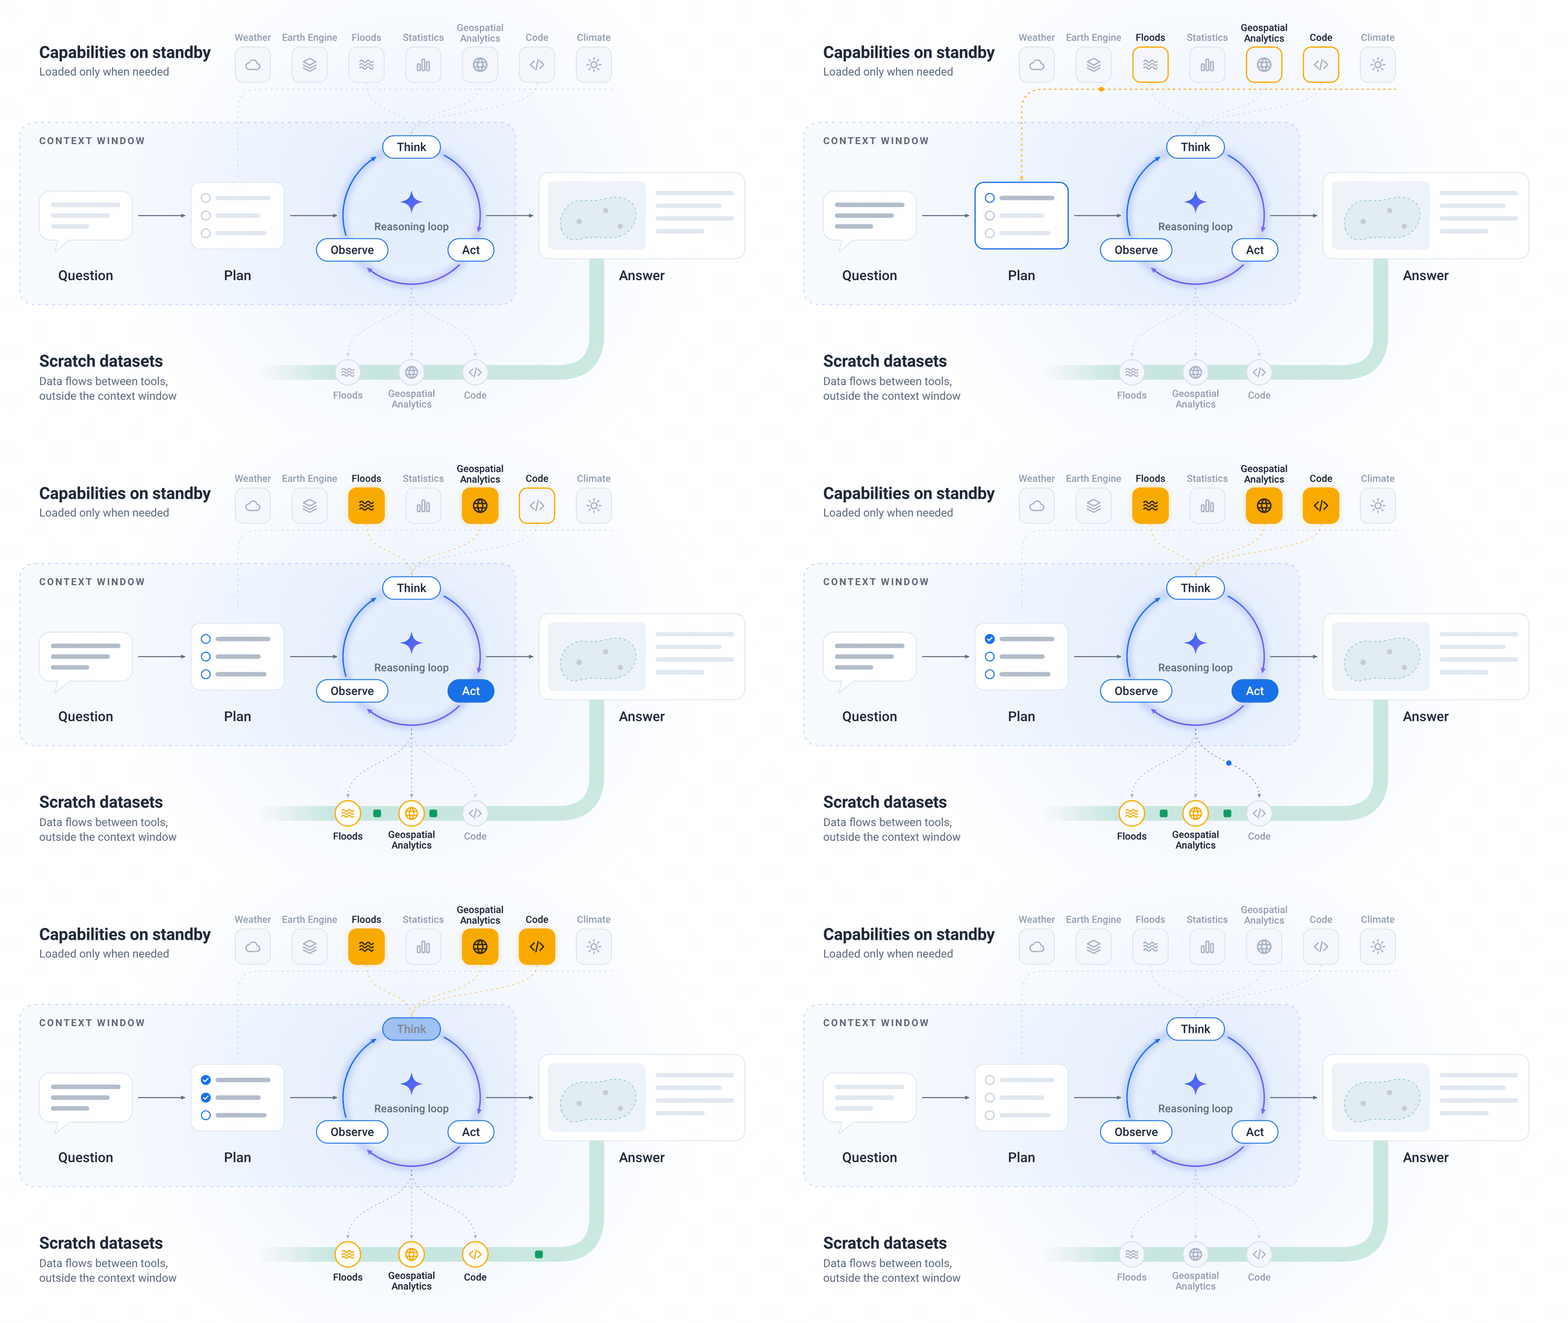
The benchmark design is the useful part for anyone assessing these claims. The team compared four configurations: a bare language model, the model with basic tools, the model with Earth AI skills, and the full planning agent. Scores climb across that sequence, which is a reasonable way to show the gain comes from specialised geospatial tooling and advance planning rather than from the underlying model being clever. The accompanying paper is on arXiv for anyone who wants the detail.
The Ocean Keeps Setting Records
September 2026 was the second-warmest September in the ERA5 record at 16.27°C, 1.63°C above the 1850 to 1900 pre-industrial baseline and just 0.11°C cooler than September 2023. It was the second consecutive month above 1.5°C, following August, and C3S expects the run to continue into 2027 as El Niño intensifies.
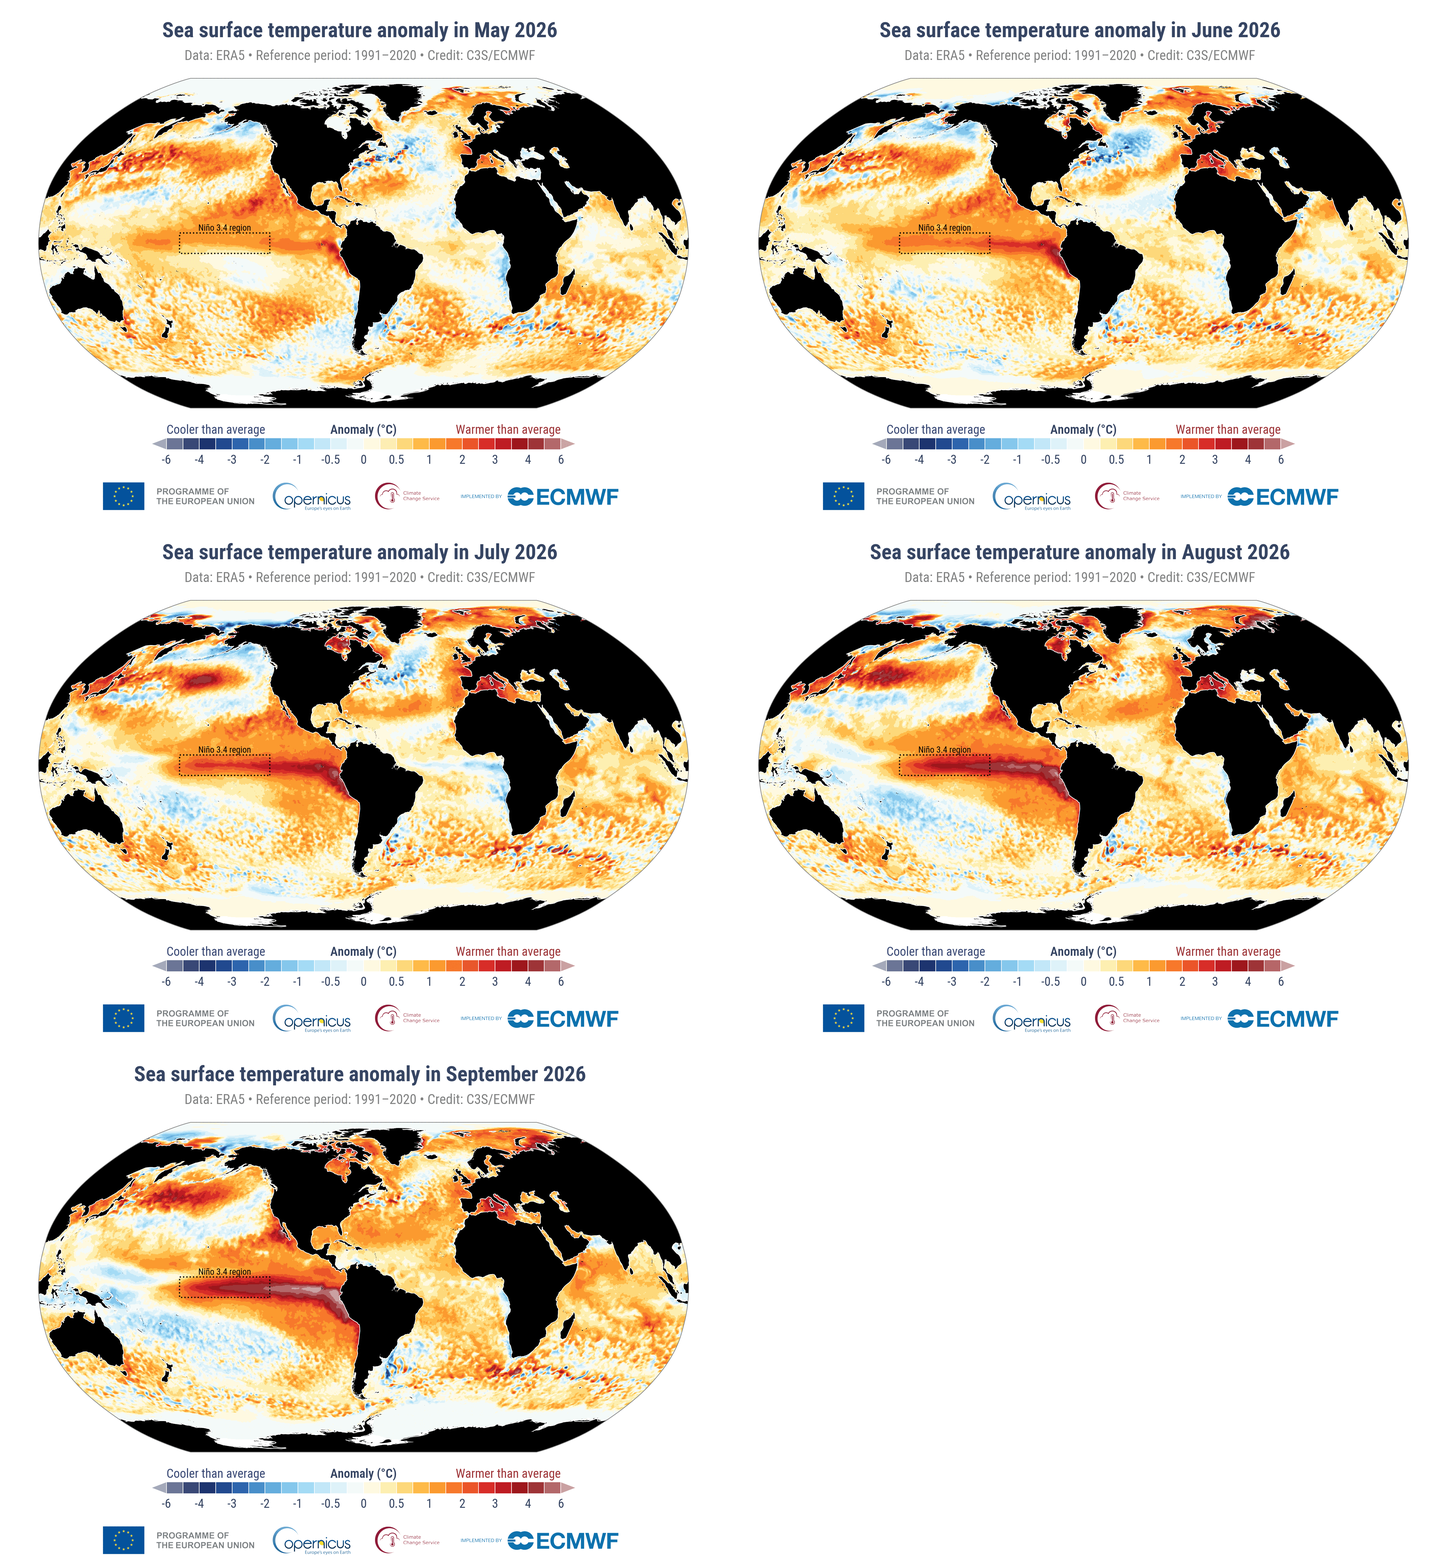
The ocean number stands alone. Across the extra-polar ocean between 60°S and 60°N, September averaged 21.05°C, beating the 2023 record of 20.92°C.
Europe had its third-warmest September overall at 1.54°C above average, but western Europe recorded its joint-warmest, tied with 2023 at 2.51°C above, following the region’s hottest summer on record. Anomalies of 4 to 6°C showed up locally across the Iberian Peninsula, southern France and parts of Italy.
We are in a new run of months above 1.5°C, and with a strong El Niño still intensifying it is likely to last into 2027. Crossing the Paris Agreement’s long-term limit is only a matter of time.
Carlo Buontempo, Director, Copernicus Climate Change Service
One framing point that gets muddled in coverage and is worth keeping straight: a single month above 1.5°C is not the same thing as breaching the Paris Agreement target, which concerns sustained warming over decades. Buontempo’s phrasing is the honest version.
Ice, Counted Two Ways
Arctic sea ice reached its 2026 minimum on about 12 September at 4.60 million square kilometres, tying for roughly the tenth lowest in the satellite record. NASA’s Scientific Visualization Studio published the animation of the melt season.
Separately, an international collaboration led by ESA published a reassessment of ice sheet mass balance in Scientific Data, and the headline figure is roughly 11.3 trillion tonnes of ice lost from Greenland and Antarctica since 1979.
The methodological advance is the record length. Earlier assessments by this group only went back to the 1990s, limited by European satellite data. Incorporating NASA satellites pushed the Antarctic record back to 1979 and Greenland to 1972. The team used 45 independent surveys across 27 different satellites, which is the reason to take the trend seriously: the methods are relatively independent of one another and they agree.
For every centimetre of sea level rise, another two to three million people are flooded at least once a year.
Ines Otosaka, Northumbria University, lead author
The sea level contribution from that ice loss alone is about 3.1 cm since 1979. Two details deserve care. The ice sheets were relatively stable through the 1970s, 1980s and into the 1990s, with loss really accelerating in the 2010s, and the apparent pause from 2020 to 2023 reflects short-term weather variation rather than a change in trend, partly because East Antarctica had record snowfall offsetting rapid West Antarctic loss. And most of the loss is dynamic, coming from warmer water attacking ice from below and from the sides rather than from warmer air melting it at the surface. That is the mechanism associated with instability and tipping behaviour, which is why glaciologists quoted in the coverage were more worried about the character of the loss than its total.
Nine Months of a Volcano, in Radar
NISAR imaged Krasheninnikov on Russia’s Kamchatka Peninsula on 25 December 2025. Days later the volcano began erupting for the first time in nearly five centuries, apparently woken by the magnitude 8.8 earthquake offshore the previous July. NASA assembled 17 radar frames through 17 August into a time-lapse.
Radar is what makes this possible: it works through cloud and darkness, and lava reads brighter than surrounding snow and rock because it scatters microwaves differently. The point is consistency rather than any single frame. Twice every 12 days, from two look directions, over a volcano nobody was monitoring closely because it had been quiet for 500 years.
One Map a Day, All Month
If you are reading this in November, the #30DayMapChallenge is running right now. One prompt a day for thirty days, started by Topi Tjukanov in 2019 and now drawing thousands of participants. No registration, no prizes, no tool requirement. This year is sponsored by Mapbox.
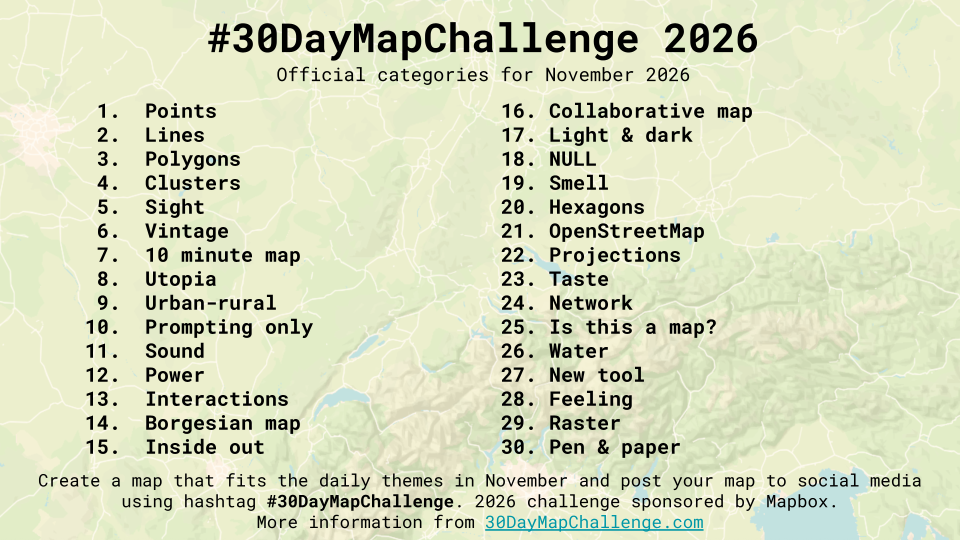
It remains the best thing in the geospatial calendar for a simple reason: the constraint is the point. A daily theme and a hard deadline produce work nobody would have planned, and the feed gives you several hundred different answers to the same question every day. This year’s list runs through Hexagons, Projections, NULL, Is this a map? and Borgesian map, and ends on Pen & paper, which tells you something about the spirit of it. QGIS, R, D3, Blender, embroidery and coloured pencil all qualify.
Join the challenge
November 2026 · one category a day · free, no registration
Started by Topi Tjukanov in 2019 · 2026 edition sponsored by Mapbox
Air, Water and Where They Came From
Two releases this month are about tracing things back to a source. CAMS published Atmosphere Watch, a global analysis of air quality that explicitly handles transboundary pollution. The distinction it draws, between the pollution measured over a country and the pollution actually produced there, is one that air quality reporting usually flattens and that matters a great deal for anyone arguing about policy responsibility.
On water, NOAA’s flood inundation mapping now covers close to the entire United States, and Esri has brought the forecast layers into ArcGIS Living Atlas. That is a meaningful change in accessibility: forecast inundation moves from a NOAA product you consult to a layer you drop into your own web map alongside whatever else you are working with.


#Fun

Next article


BlackSky’s third-quarter results provide some of the clearest evidence yet that demand for sovereign and defence-focused Earth observation can produce meaningful operating leverage.
The company generated $42.8 million in revenue, up 118% from $19.6 million a year earlier. Space-based intelligence and AI services contributed $32.7 million, or approximately 76% of the total.
Adjusted EBITDA reached a record $12.8 million, representing a 29.9% margin, compared with a $4.5 million loss a year earlier. BlackSky consequently raised its 2026 outlook for the second time, forecasting revenue of $140–150 million and adjusted EBITDA of $18–24 million. BlackSky’s results and reconciliations are available in its official release.
The Gen-3 constellation is becoming commercial infrastructure
BlackSky said its fifth Gen-3 satellite reached first light and began revenue-generating operations within 24 hours. That rapid transition suggests the company has standardised more of its commissioning, ground-system and customer-delivery workflow.
The quarter also included a seven-figure US government pilot, an international defence customer moving from a Gen-2 pilot to a Gen-3 subscription, and a renewed non-Earth-imaging agreement with HEO.
These examples support BlackSky’s central proposition: customers are buying an intelligence service rather than isolated satellite images. The value lies in assured tasking, rapid delivery and analytics applied repeatedly to strategically important locations.
A revealing Planet comparison
Planet reported $116.1 million of revenue and $13.9 million of adjusted EBITDA in its latest reported quarter. Planet was therefore approximately 2.7 times larger by quarterly revenue, but its adjusted EBITDA was only modestly above BlackSky’s $12.8 million. Planet’s fiscal second-quarter results provide the comparison.
The comparison is imperfect because the companies have different constellations, contract structures and non-GAAP definitions. Nevertheless, it illustrates BlackSky’s unusually high quarterly margin as defence and sovereign-service revenue scales.
It also reveals concentration risk. BlackSky’s third quarter supplied roughly 44% of its revenue for the first nine months of 2026. Large government programmes and satellite-service contracts can make quarterly performance uneven.
Net income needs context
BlackSky reported $18.5 million in net income, reversing a $15.3 million loss. However, the quarter included a $19.7 million gain from changes in the value of derivatives.
That accounting gain is not evidence of equivalent cash generation. Adjusted EBITDA is a more useful indicator of the improvement in core operations, while capital expenditure provides another necessary check. BlackSky spent $15.4 million on capital investment during the quarter—more than its adjusted EBITDA.
The company nevertheless ended September with $231.1 million in cash, restricted cash and short-term investments, providing capacity to expand Gen-3.
The sovereign-EO model is gaining definition
BlackSky, Planet and ICEYE are increasingly selling combinations of spacecraft capacity, operational control, analytics and national access. Governments want commercial speed without depending entirely on imagery allocated through another country’s priorities.
BlackSky’s quarter suggests that this model can support strong margins once satellites and software are serving multiple contracts. The remaining test is whether the company can sustain that performance outside quarters containing major programme milestones.
For now, the results represent a meaningful step from promising technology towards a scalable intelligence business.


