Rethinking Benchmarks in GeoAI: Why Bigger Earth Observation Models Are Not Automatically Better

For years, many Earth observation systems were trained to perform specific tasks: detect buildings, map roads, classify land cover, or segment floodwater. Now the field is moving toward larger geospatial foundation models trained on satellite imagery, aerial imagery, maps, and weather and environmental data. Models such as Prithvi-EO-2.0 and Clay v1.5 show how this space is growing, with applications ranging from land-use and crop mapping to disaster response, flood mapping, and ecosystem monitoring. These models are designed to support many downstream tasks instead of being trained from scratch for each one. The same base model can be adapted to new regions, sensors, and mapping problems with less labelled data than a task-specific model.
The question is no longer only: can we build larger geospatial models? It is also: can we honestly measure where these models work, where they fail, and whether they can be trusted outside benchmark datasets?
This is where GeoAI starts to face a benchmark crisis. A model can score well on a public dataset and still fail in a different geography, season, sensor type, or disaster context. Recent work argues that evaluation should consider generalization, transferability, energy use, and real-world impact, not only accuracy.
This article looks at why standard AI benchmarks do not translate cleanly to geography, why one-number scores can hide important failures, and what a better GeoAI evaluation should look like.
Why Conventional AI Benchmarks Do Not Translate Cleanly to Geography
Most computer vision benchmarks are built around objects that stay visually recognizable across many photos. A car, dog, or coffee cup may change in colour, angle, or lighting, but the object category often remains fairly stable.
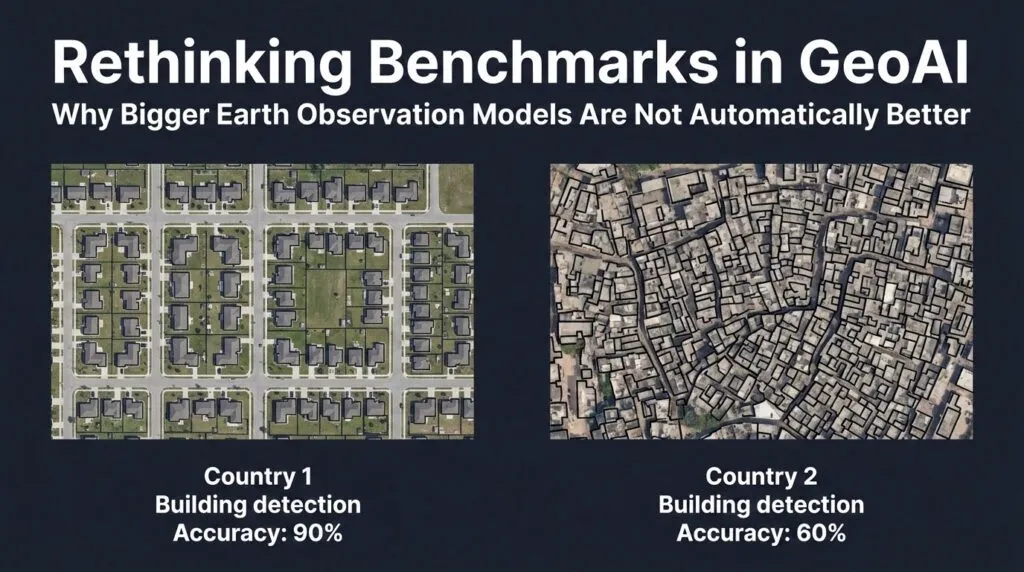
Earth observation does not behave like that. In satellite and aerial imagery, the same class can look very different depending on region, resolution, season, sensor, atmosphere, and local settlement patterns. A building in Germany, India, Kenya, and Brazil may differ in roof material, spacing, shape, density, and surrounding road structure. This is why cross-region building detection is hard.
Flood mapping has the same problem. In optical imagery, floodwater may be hidden by clouds during the exact storms when mapping is most urgent. In SAR imagery, water is often visible through clouds, but it appears differently and can be confused with other smooth surfaces. A crop field also changes with climate, irrigation, soil type, planting calendar, and growth stage. The same crop can look different across regions and seasons.
This is why GeoAI benchmarks cannot be treated as neutral scoreboards. The score is shaped by where the data was collected, which sensor was used, how labels were produced, and when the imagery was captured. Newer benchmarks are starting to test spatial reasoning more directly, including distance, direction, topology, and geometry-based questions. Earlier efforts also show the need for Earth-observation-specific evaluation rather than borrowing benchmark habits from ordinary computer vision.
The Problem With One-Number Performance Scores
GeoAI models are often compared using a single metric: accuracy, F1-score, IoU, mAP, or AUROC. These scores are useful, but they can also hide the failures that matter most in the real world.
The easiest example is class imbalance. In flood mapping, water may cover only a small part of the image. If a model predicts “no flood” almost everywhere, it can still produce a high overall accuracy because most pixels are background. The number looks promising, but the model has failed the actual task.
This problem appears across many geospatial applications. A building detector trained mainly on planned urban areas may perform well in cities with regular street grids, but miss buildings in dense informal settlements. A land-cover model trained mostly on temperate regions may degrade when applied to tropical forests, arid landscapes, or mixed agro-urban areas. A disaster-mapping model trained on clear-sky or moderate-event imagery may score well in benchmark tests, but fail during cloudy monsoon flooding, mountainous landslides, or extreme wildfire events.
In GeoAI, an average score can hide exactly the places where the model matters most.
Metrics also measure different aspects. IoU measures overlap between prediction and ground truth, but boundary errors can be treated poorly in some cases. Research on Boundary IoU shows that standard mask IoU can miss important boundary-quality differences. For object detection, mAP summarizes precision and recall across thresholds, but it does not explain whether errors happen in wealthy city centers, rural roads, or disaster-hit settlements. A general object detection metrics guide can explain the formulas, but geospatial deployment needs more context than the formula itself.
Remote sensing also faces out-of-distribution problems. A 2024 study on OOD detection in remote sensing underscores that identifying unfamiliar scene types stops models from blindly forcing new, unseen land categories into existing labels with dangerously high confidence.
For GeoAI, the problem is not that metrics are useless. The problem is treating one score as the whole story.
Geography Creates Evaluation Problems That Most Benchmarks Miss
To build GeoAI models that people can trust, evaluation has to reflect how the Earth actually varies. A random train-test split is often not enough. The test set may look statistically separate, but still come from the same geography, sensor, season, and event type as the training data.
The first issue is region. A model trained mostly on North America or Western Europe may not work the same way in South Asia, Africa, or Latin America. Buildings, roads, farms, and vegetation follow different local patterns. This is why testing models across diverse, unseen geographies is critical to overcoming spatial domain shift.
The second issue is sensor. Sentinel-2, Landsat, PlanetScope, Maxar, aerial imagery, drone imagery, and SAR do not capture the world in the same way. They differ in resolution, spectral bands, revisit time, viewing geometry, and noise. For example, a study on cross-sensor adaptation uses high-resolution Gaofen-2 imagery and Sentinel-2-derived data to show that even when the land-use classes are the same, differences in spatial detail and sensor characteristics can reduce model transferability.
The third issue is scale. A model trained at 10 m resolution may not behave the same way on 30 cm aerial imagery. At coarse resolution, a building may be only a few pixels. At high resolution, the model sees roof material, shadows, cars, trees, and yard boundaries. The object is the same, but the visual problem changes.
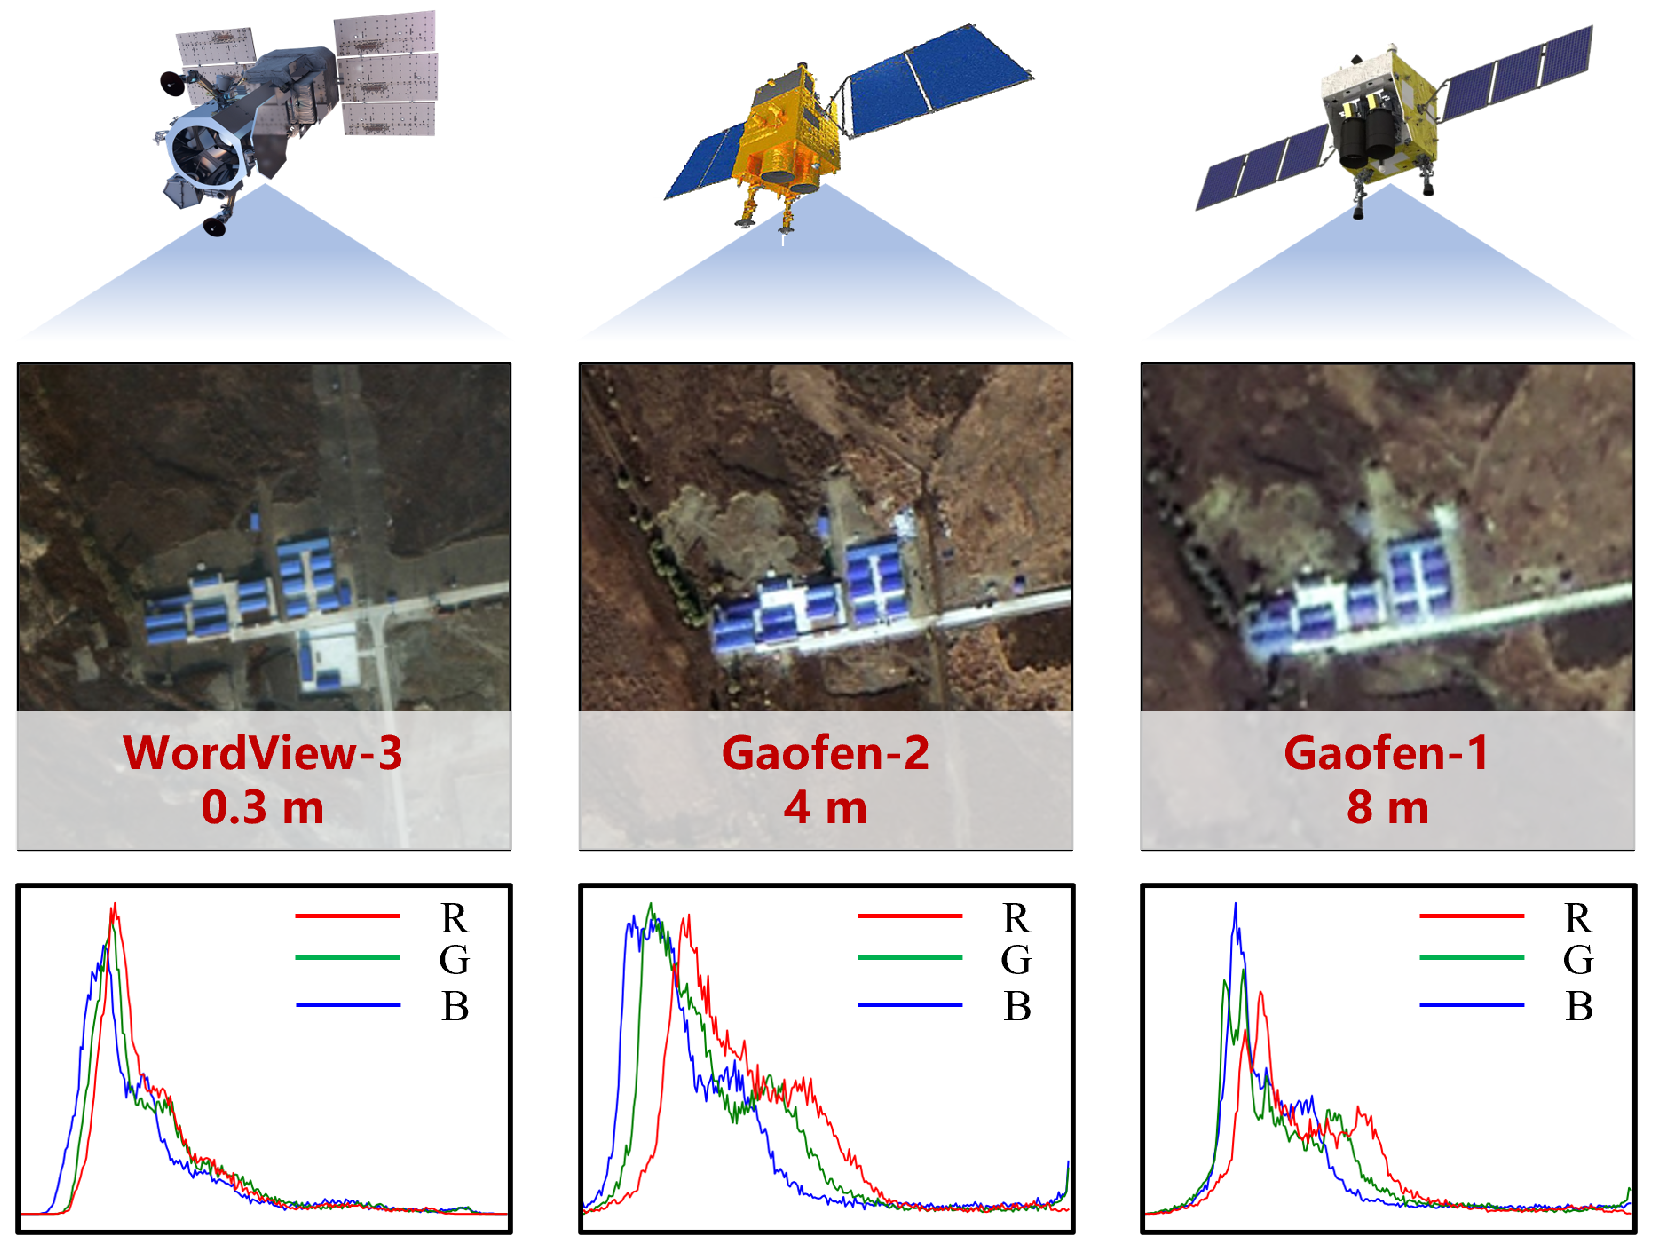
High-resolution visible imagery from different sources varies in terms of spatial resolution and spectral characteristics. Source: Li et al., 2025
The fourth issue is time. Vegetation, snow, water bodies, crop cycles, soil moisture, and shadows change across seasons. A model tested only on summer imagery may give a false sense of reliability.
The fifth issue is rare events. Floods, landslides, wildfires, oil spills, volcanic activity, and infrastructure failures are often underrepresented, but these are the cases where GeoAI is most needed. Newer work such as GeoDisaster and real-world distribution-shift benchmarks for satellite object detection show why evaluation must include hazards, geography, and operational context.
What Better GeoAI Benchmarks Should Look Like
Better GeoAI benchmarks should not only ask which model gets the highest score. They should ask where the model works, where it fails, and what kind of evidence is needed before it can be trusted.
That means moving away from static leaderboards built around one average number. A useful benchmark should report regional breakdowns instead of only global averages. It should show whether a model performs differently across continents, climate zones, urban forms, and income contexts. It should also separate results by sensor and resolution, because performance on Sentinel-2 does not automatically mean performance on aerial imagery, SAR, or commercial high-resolution data.
Time matters too. Benchmarks should include seasonal and temporal splits, not only random train-test splits. A model tested on data from a different year, season, or event is more likely to reveal whether it has learned a robust pattern or only memorized familiar conditions.
Uncertainty should also become standard. If a model sees a landscape, sensor type, or disaster pattern it does not understand, it should say so. Work on predictive uncertainty in remote sensing shows why this matters: a model trained on one environment, such as forest or European urban imagery, can fail on very different urban scenes while still giving a confident prediction.
Newer benchmarks are starting to move in this direction. GEOBench-VLM evaluates vision-language models on scene understanding, counting, localization, fine-grained categories, and temporal analysis. GS-QA tests geospatial question answering using OpenStreetMap and Wikipedia data, including distance and angular error. GeoAnalystBench evaluates whether language models can generate valid spatial-analysis workflows and code. TurnBack tests route cognition across 36,000 routes in 12 cities.
The best benchmark is not the one that makes models look good. It is the one that reveals where they break.GeoAI does not need only larger models. It also needs better ways to test them.
Did you like this post?
Read more and subscribe to our monthly newsletter!

#Contributing Writers

Next article
For years, GIS professionals have been promised that artificial intelligence would transform how they work. In reality, most AI innovation in geospatial has focused on computer vision, object detection, land-use classification, or extracting insights from satellite imagery.
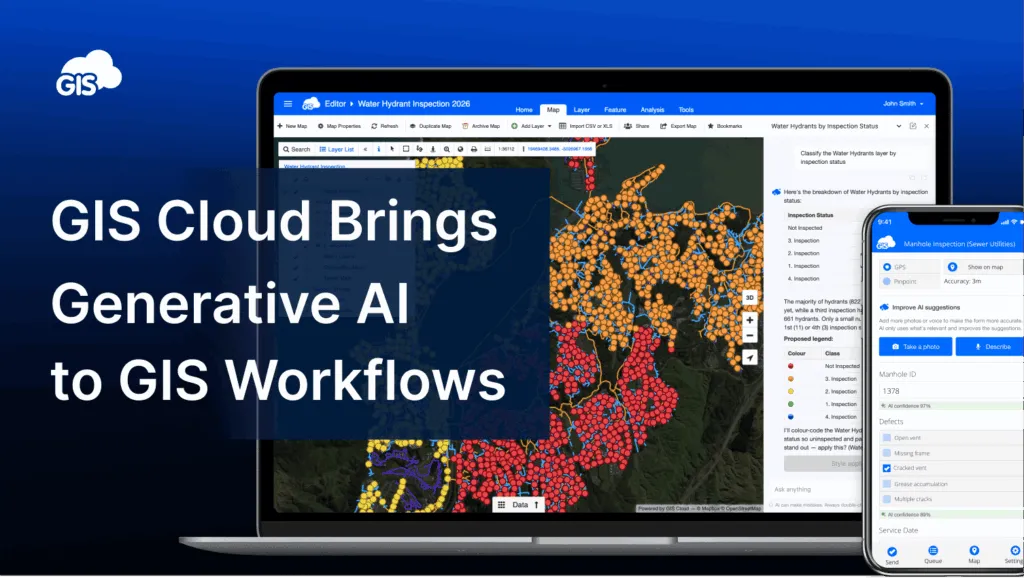
Generative AI introduces a different possibility: what if users could simply describe what they want to do and let the system figure out the GIS operations behind the scenes?
That is the direction GIS Cloud is taking with its newly launched AI capabilities.
After an invite-only preview with selected users, GIS Cloud is now making its AI tools available to all users through a public release. The company is also covering the initial AI costs during the launch period, allowing users to experiment with the technology and provide feedback without worrying about token usage.
From GIS Commands to Conversations
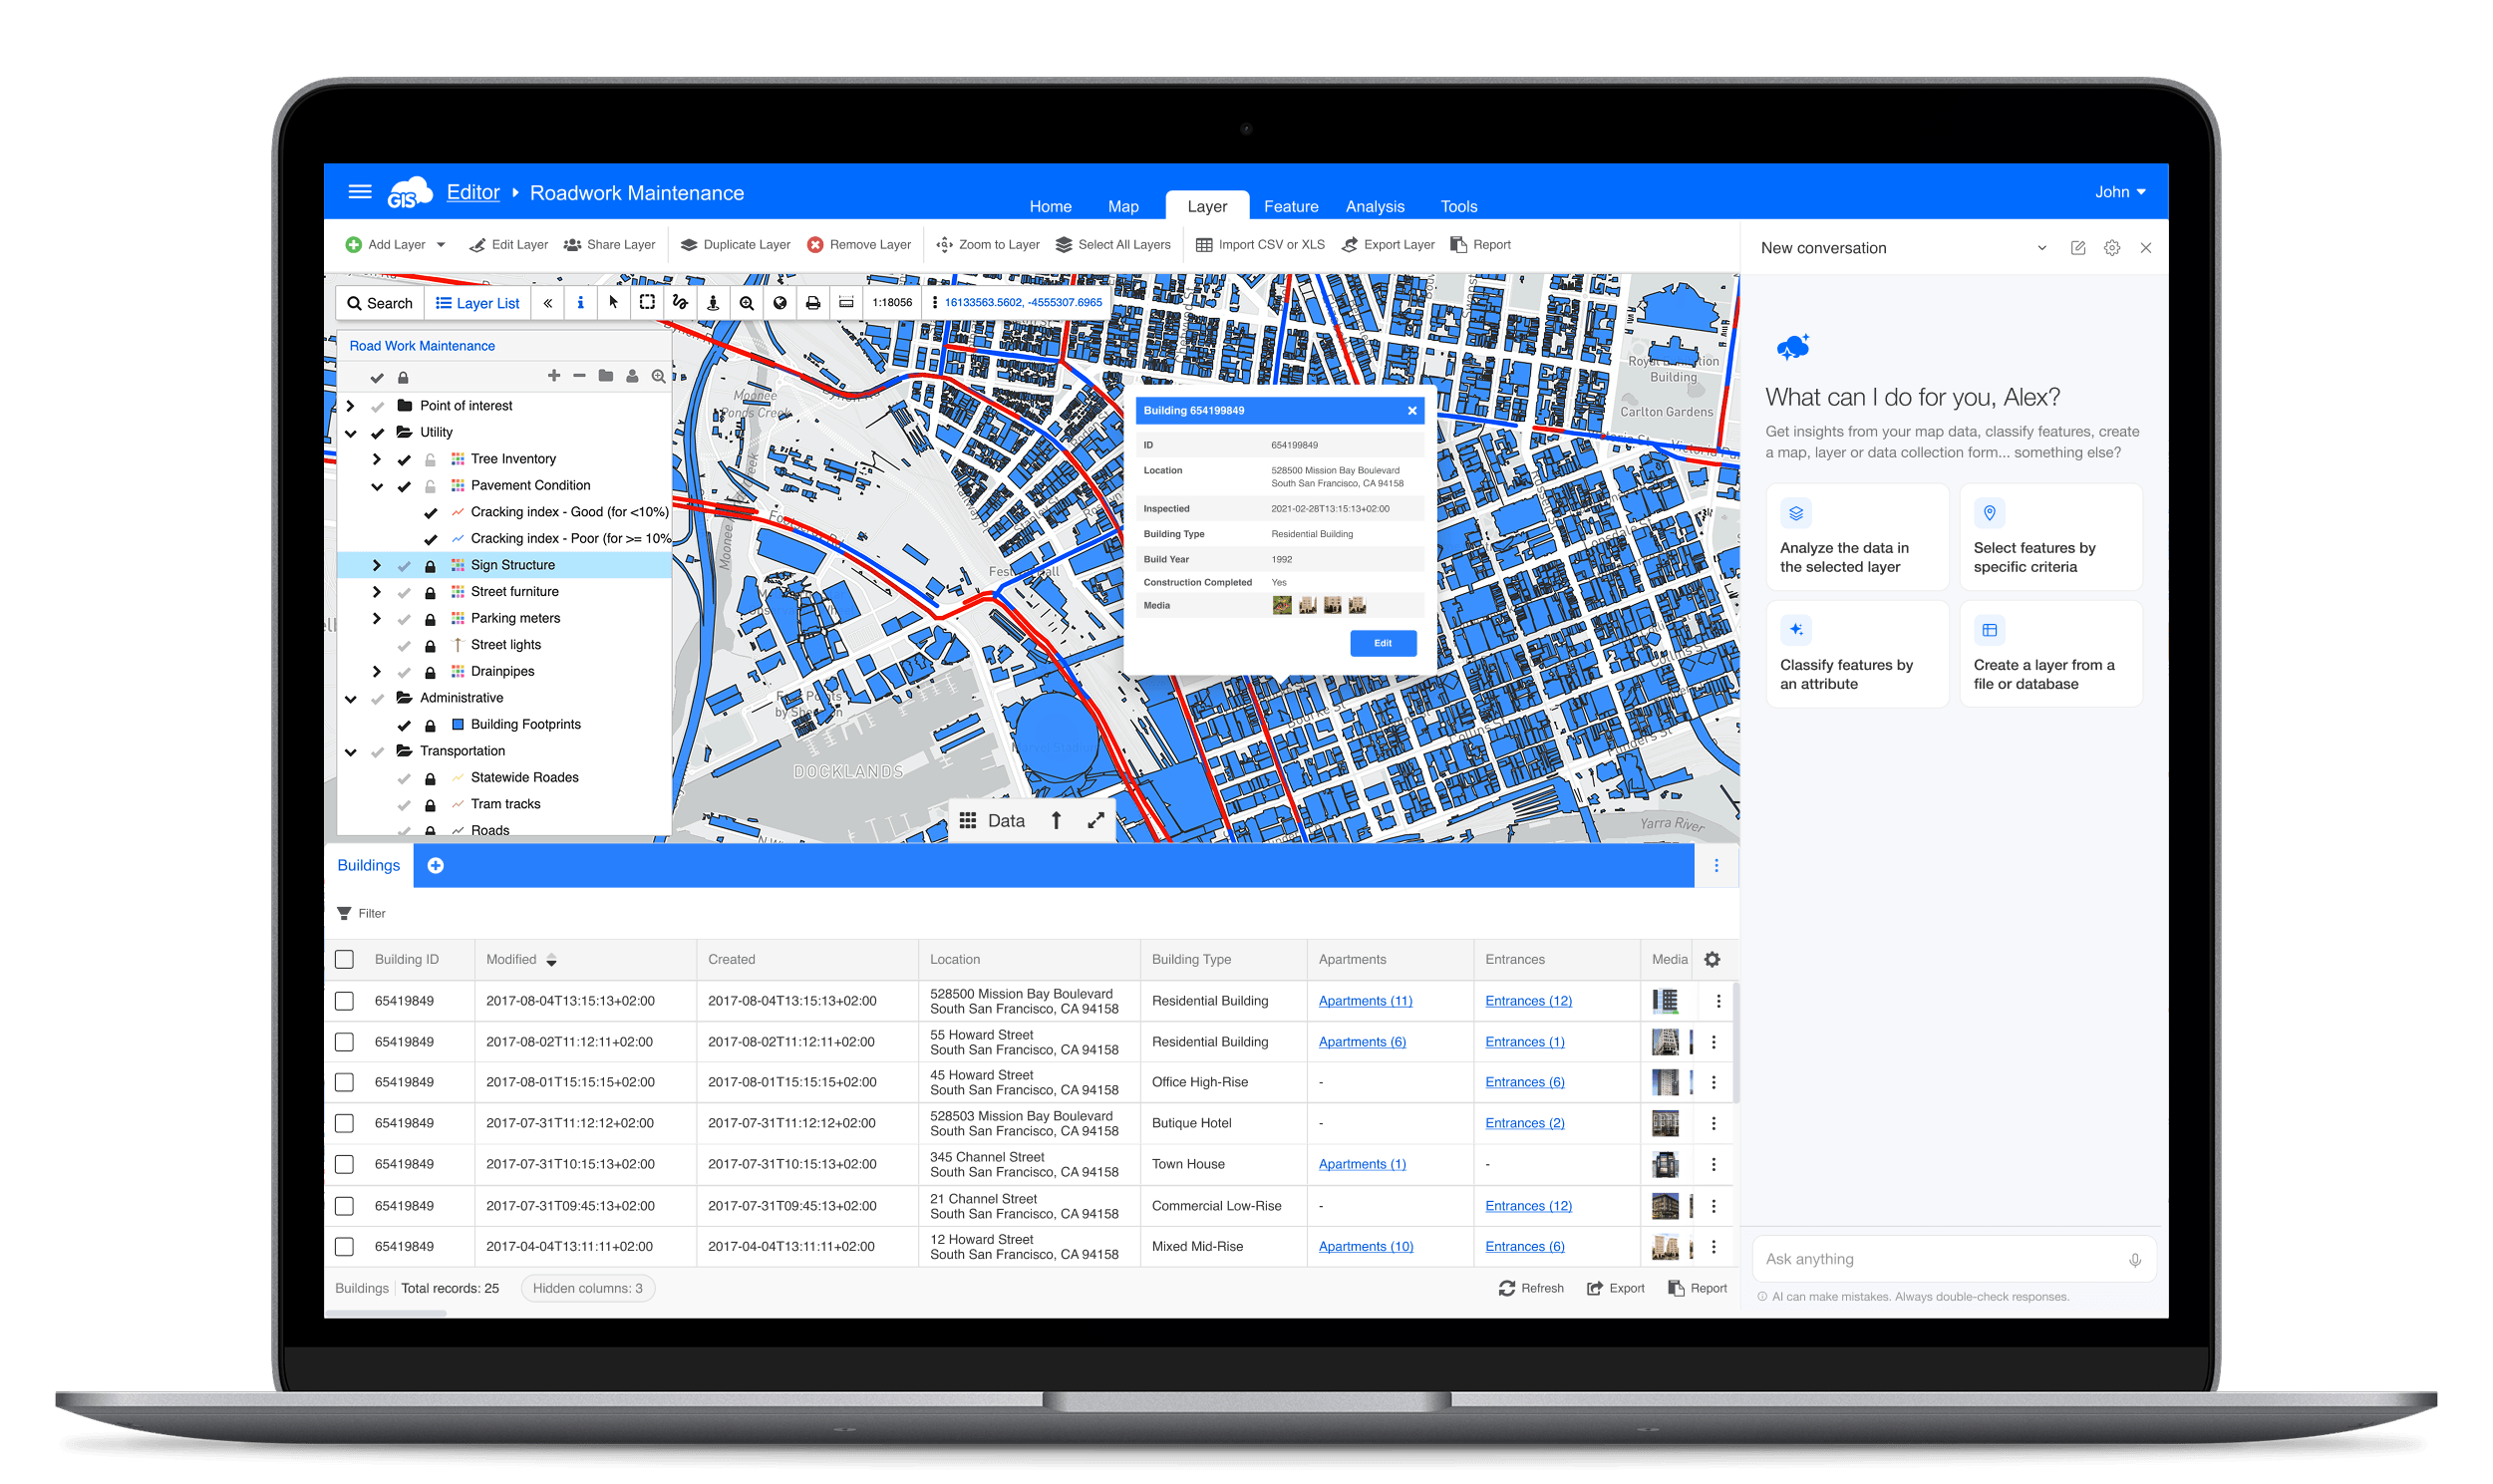
Traditional GIS software requires users to understand menus, tools, SQL queries, spatial joins, and data structures. GIS Cloud’s new AI assistant attempts to remove much of that complexity.
Instead of manually building a query, users can simply ask questions such as:
- Which district contains the highest number of assets?
- Show me areas with the highest density of infrastructure.
- Color-code assets by type.
- Create a map showing the largest cities in a country.
Behind the scenes, the assistant translates natural language into GIS operations, spatial intersections, and SQL queries. The user receives the result without having to understand the technical implementation.
For experienced GIS users, this can accelerate complex analysis. For non-GIS users, it potentially lowers the barrier to accessing location intelligence altogether.
As Dino Ravnic, CEO of GIS Cloud, explained during a recent demonstration, the company’s long-term vision has always been to democratize GIS. Generative AI simply becomes the next step in that journey.
Human-in-the-Loop by Design
One challenge facing every enterprise AI deployment is trust.
Anyone who has spent time with modern LLMs knows they occasionally produce incorrect results, confidently.
GIS Cloud addresses this with a human-in-the-loop approach. The AI can suggest changes, create classifications, build queries, and recommend edits, but users must confirm actions before they are applied.
This approach is particularly important in GIS environments where inaccurate edits can affect operational systems, utility networks, infrastructure records, or business decisions.
The company also provides transparency into how queries are generated, allowing users to inspect and validate results rather than blindly accepting them.
Building Data Collection Forms with AI
One of the more practical applications demonstrated during the session focused on field data collection.
Creating inspection forms is rarely difficult, but it can be time-consuming. Users often spend hours configuring fields, dropdowns, dependencies, and validation rules.
With GIS Cloud’s AI assistant, users can describe the type of inspection they want to perform, for example, a hydrant inspection, and the system automatically generates an appropriate form structure. The generated form can include text fields, dropdowns, dependencies, condition assessments, and other data collection elements.
The result is less time spent configuring software and more time spent collecting useful information.
Turning Photos and Voice Notes into Structured GIS Data
One of the more compelling extensions of the AI-generated Forms workflow is the ability to transform unstructured field observations into structured GIS records.
- From photos: Once an inspection Form has been created, a user can upload a photograph of an asset, such as a fire hydrant, and the AI attempts to identify relevant information and automatically populate the appropriate inspection fields within that Form. The system can even assign confidence scores to each extracted observation, helping users understand where manual verification may be required before the data is saved.
- From voice: Field workers can dictate observations naturally, and the system converts those observations into structured GIS attributes. Instead of manually entering IDs, dates, asset conditions, and notes, users can simply speak while the AI handles the translation into database-ready information.
For organizations conducting large-scale inspections, the productivity impact could be substantial.
GIS Inside Claude
Another interesting capability is GIS Cloud’s support for the Model Context Protocol (MCP).
The company has built an integration that allows users to connect GIS Cloud directly to Claude. Once connected, GIS functionality becomes available inside the chat interface itself. Users can query maps, access GIS Cloud tools, perform analysis, and retrieve information without opening the GIS Cloud application.
This matters because many professionals are increasingly spending their day inside AI assistants. Instead of moving between applications, GIS becomes another capability available within the broader AI workflow.
GIS Cloud uses its own datasets as trusted sources. Rather than relying entirely on an LLM’s internal knowledge, users can query verified organizational data while still benefiting from natural language interaction.
![]()
Beyond Maps: AI-Generated GIS Applications
GIS Cloud is also experimenting with AI-generated applications.
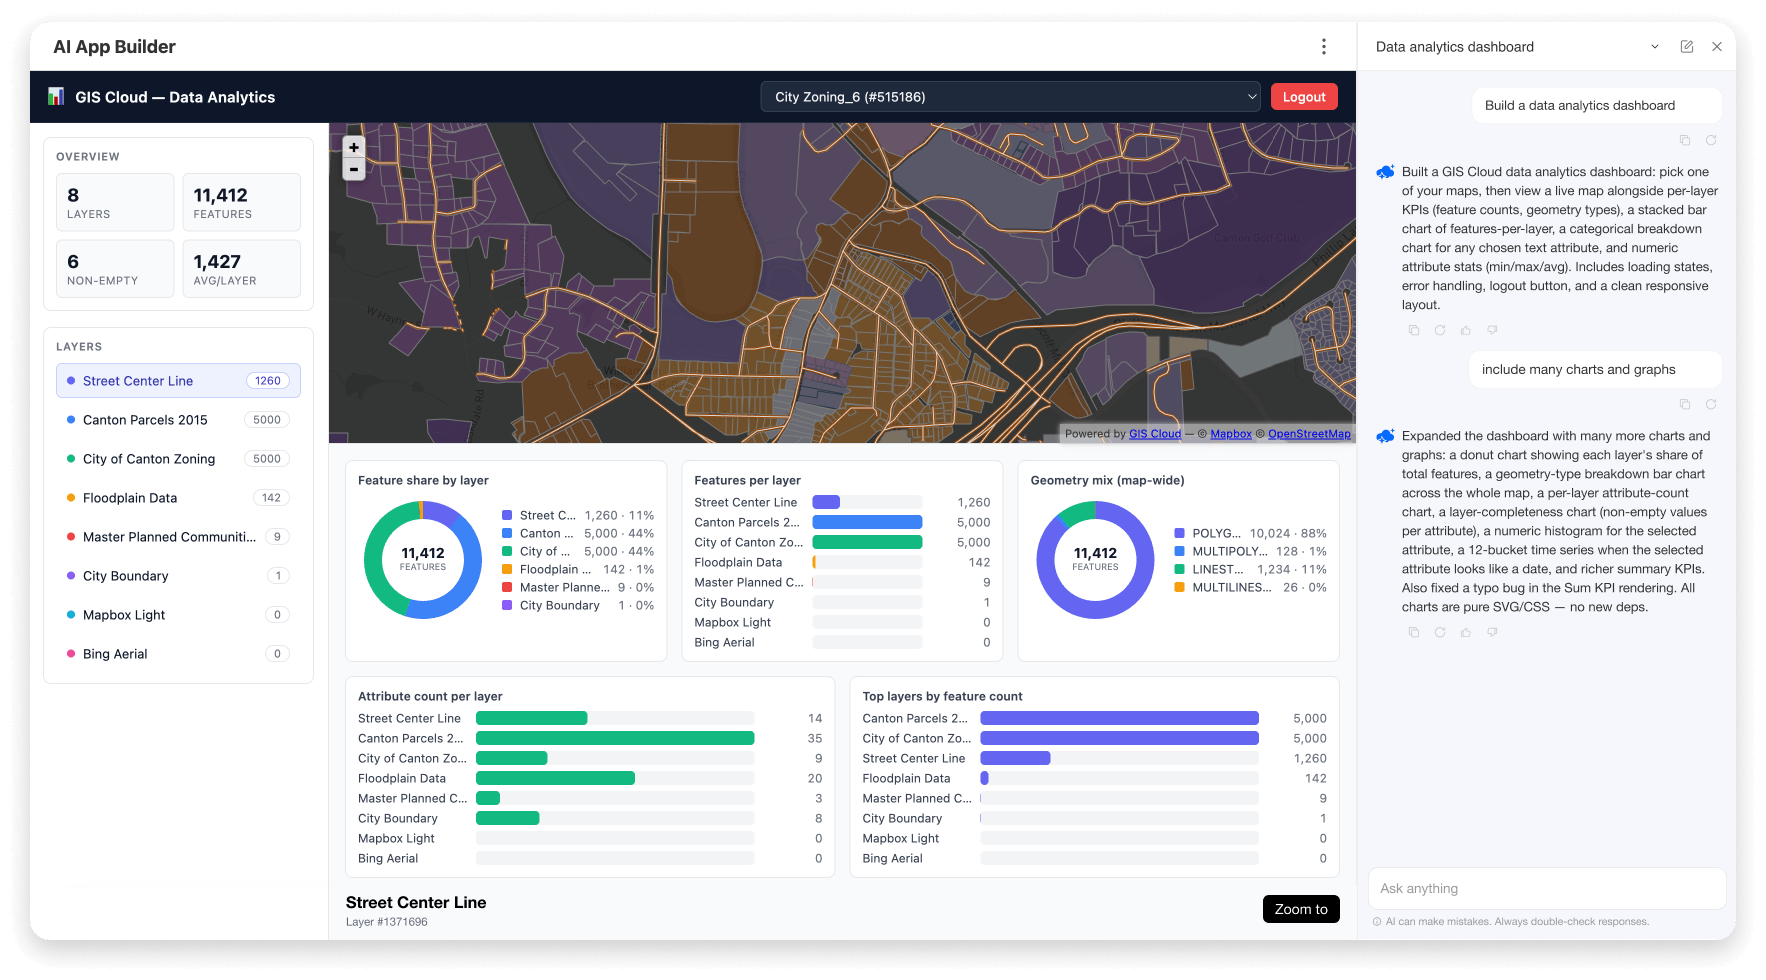
Using natural language prompts, users can create dashboards, custom applications, and visualizations without traditional development work. The concept resembles “vibe coding” for GIS, where users describe what they want and the platform generates the application structure automatically.
The implications are potentially significant. Organizations frequently need lightweight GIS dashboards tailored to specific workflows, departments, or projects. Traditionally, building these applications required development resources. AI may dramatically reduce that effort.
Why This Matters
The geospatial industry has spent years discussing democratization.
Yet GIS remains difficult for many organizations. While maps have become mainstream, advanced spatial analysis often remains the domain of specialists.
What GIS Cloud is proposing is not the replacement of GIS professionals. Rather, it is the introduction of a new interface layer between people and geospatial systems.
- Experienced users gain productivity.
- New users gain accessibility.
- Organizations gain the ability to extract more value from their spatial data without requiring everyone to become a GIS expert.
Many vendors are currently adding AI assistants to their products. What makes GIS Cloud’s approach interesting is the breadth of workflows being addressed simultaneously – from spatial querying and analysis to field data collection, image interpretation, voice input, application building, and integration with external LLMs.
Whether this ultimately becomes the dominant way people interact with GIS remains to be seen.
But one thing is increasingly clear: the future of GIS may involve fewer menus, fewer SQL statements, and a lot more conversation.
Did you like this post? Read more and subscribe to our monthly newsletter!

