For years, GIS professionals have been promised that artificial intelligence would transform how they work. In reality, most AI innovation in geospatial has focused on computer vision, object detection, land-use classification, or extracting insights from satellite imagery.
Generative AI introduces a different possibility: what if users could simply describe what they want to do and let the system figure out the GIS operations behind the scenes?
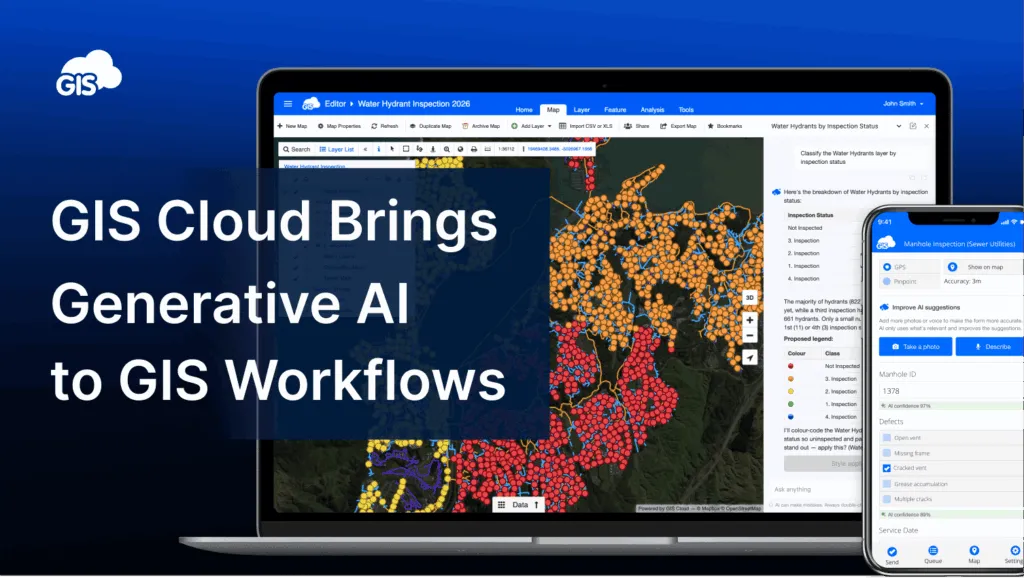
That is the direction GIS Cloud is taking with its newly launched AI capabilities.
After an invite-only preview with selected users, GIS Cloud is now making its AI tools available to all users through a public release. The company is also covering the initial AI costs during the launch period, allowing users to experiment with the technology and provide feedback without worrying about token usage.
From GIS Commands to Conversations
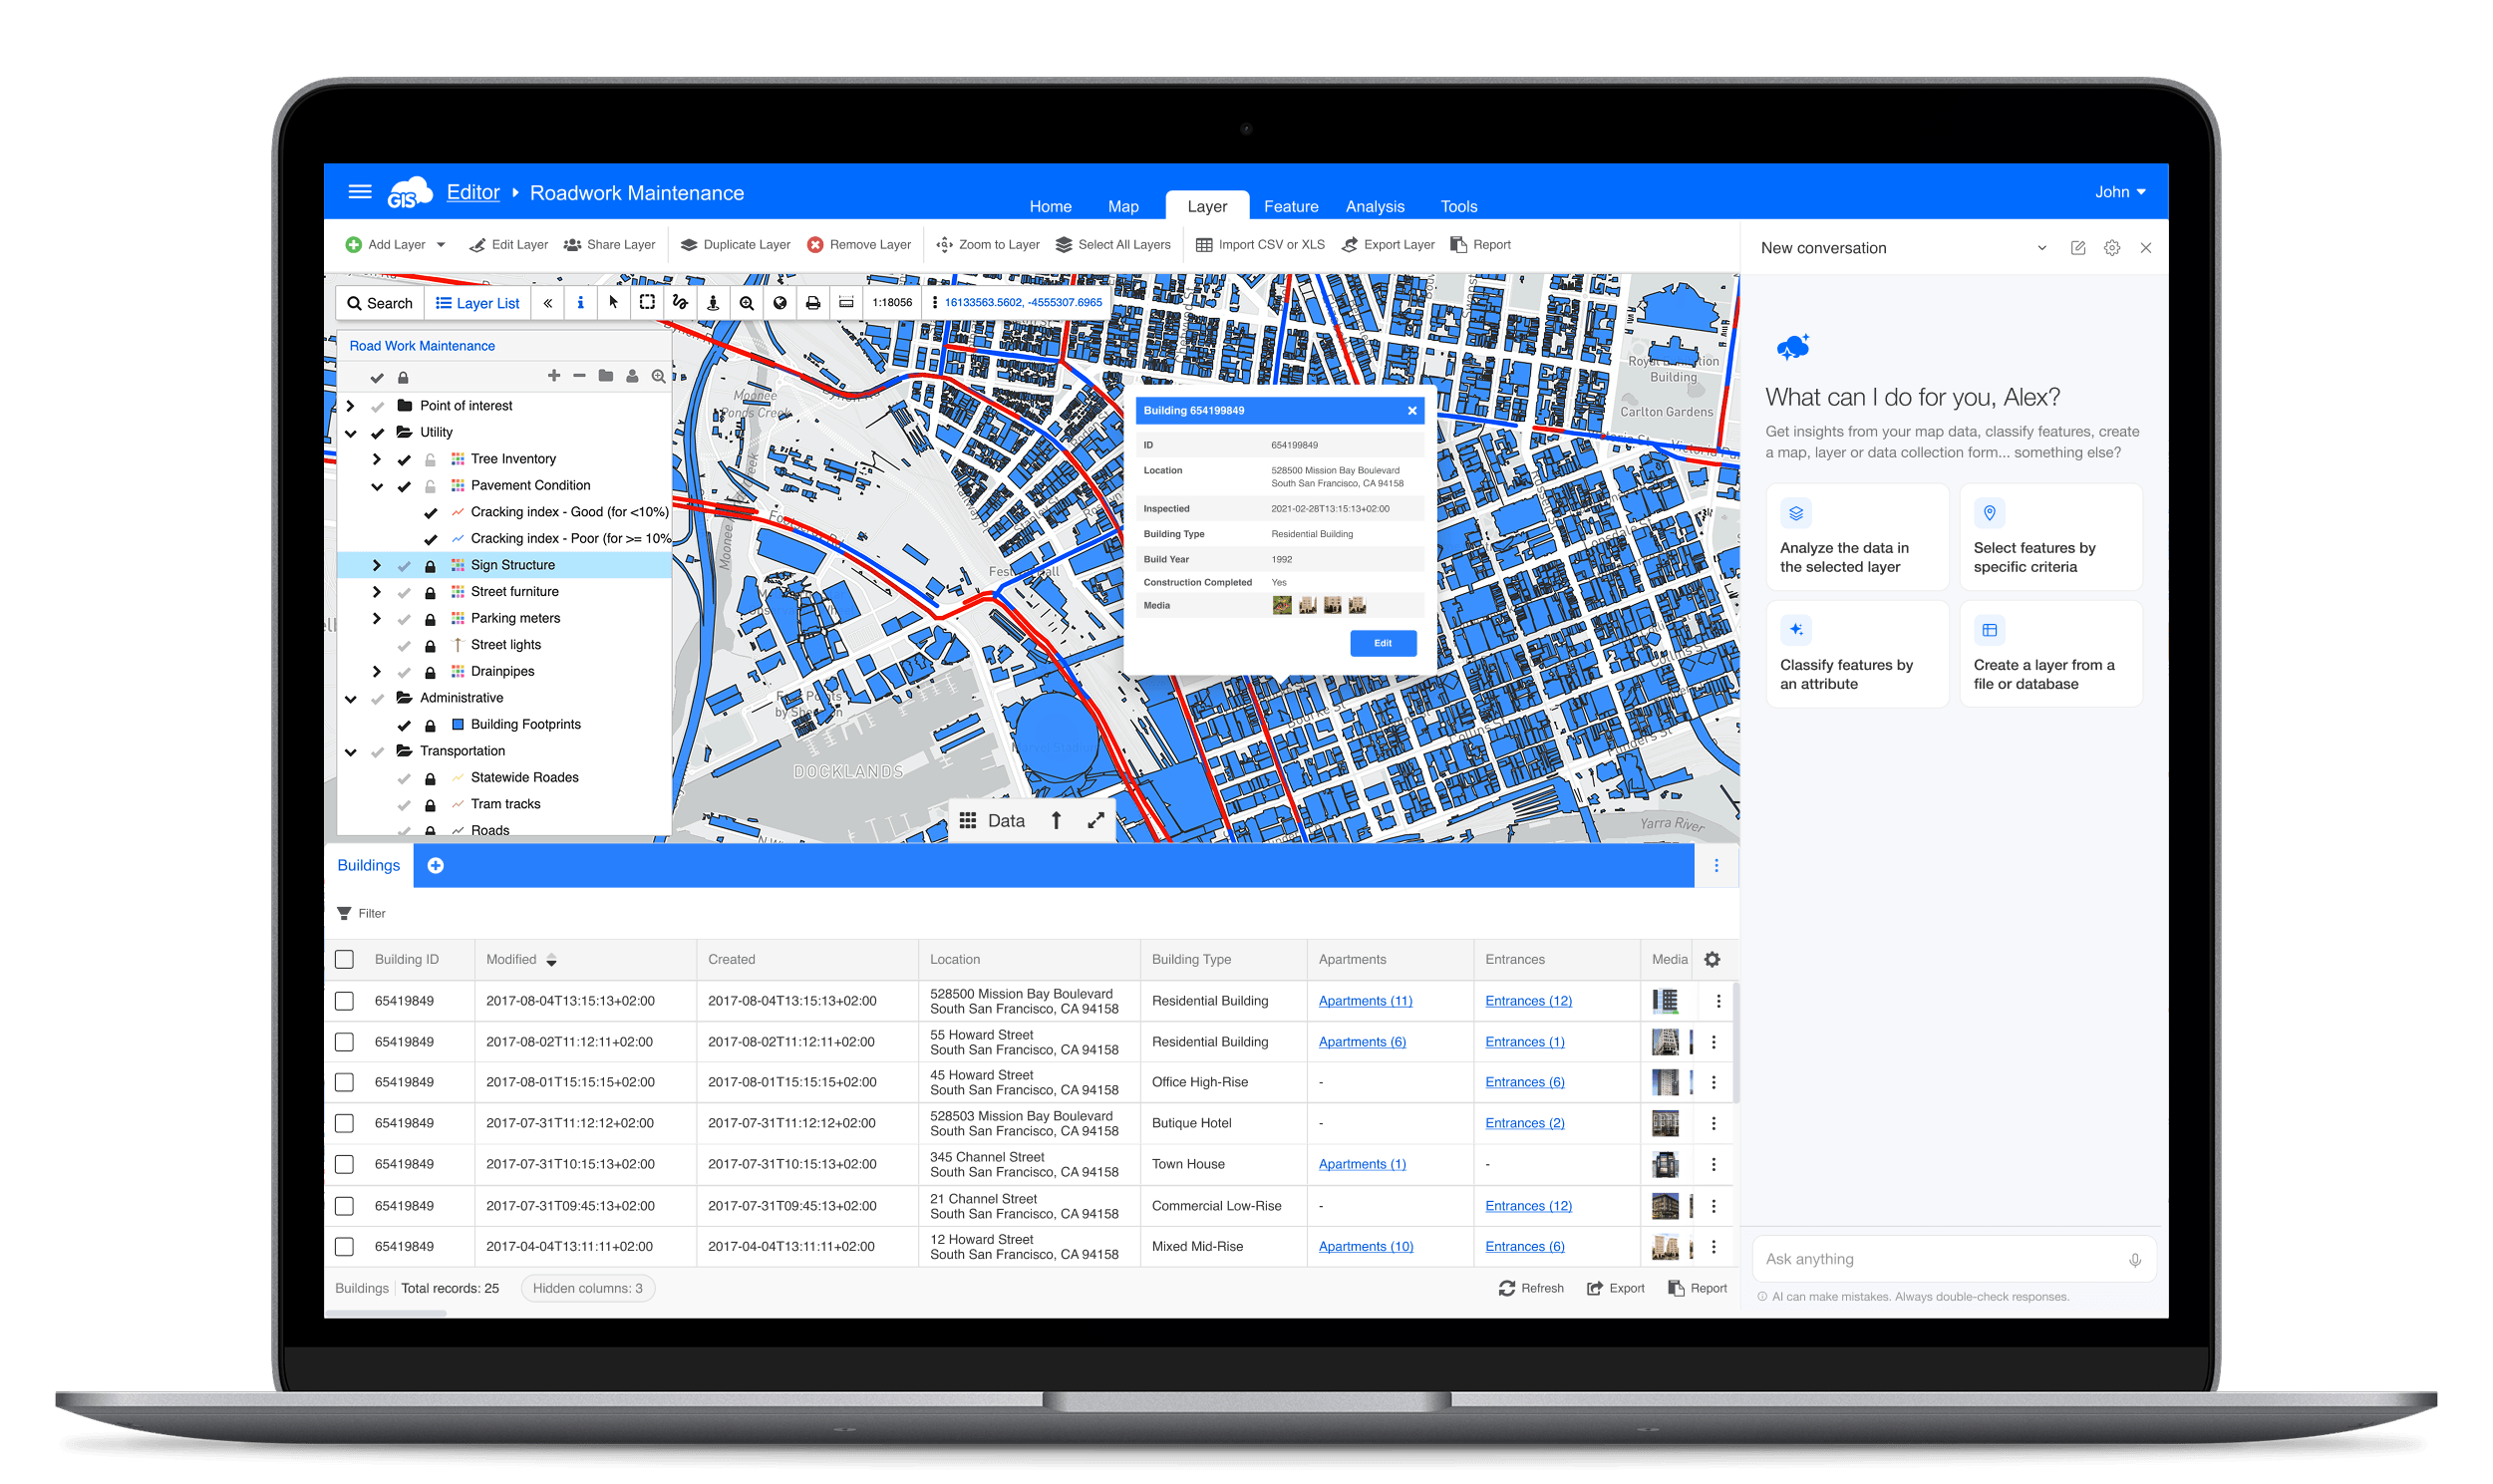
Traditional GIS software requires users to understand menus, tools, SQL queries, spatial joins, and data structures. GIS Cloud’s new AI assistant attempts to remove much of that complexity.
Instead of manually building a query, users can simply ask questions such as:
- Which district contains the highest number of assets?
- Show me areas with the highest density of infrastructure.
- Color-code assets by type.
- Create a map showing the largest cities in a country.
Behind the scenes, the assistant translates natural language into GIS operations, spatial intersections, and SQL queries. The user receives the result without having to understand the technical implementation.
For experienced GIS users, this can accelerate complex analysis. For non-GIS users, it potentially lowers the barrier to accessing location intelligence altogether.
As Dino Ravnic, CEO of GIS Cloud, explained during a recent demonstration, the company’s long-term vision has always been to democratize GIS. Generative AI simply becomes the next step in that journey.
Human-in-the-Loop by Design
One challenge facing every enterprise AI deployment is trust.
Anyone who has spent time with modern LLMs knows they occasionally produce incorrect results, confidently.
GIS Cloud addresses this with a human-in-the-loop approach. The AI can suggest changes, create classifications, build queries, and recommend edits, but users must confirm actions before they are applied.
This approach is particularly important in GIS environments where inaccurate edits can affect operational systems, utility networks, infrastructure records, or business decisions.
The company also provides transparency into how queries are generated, allowing users to inspect and validate results rather than blindly accepting them.
Building Data Collection Forms with AI
One of the more practical applications demonstrated during the session focused on field data collection.
Creating inspection forms is rarely difficult, but it can be time-consuming. Users often spend hours configuring fields, dropdowns, dependencies, and validation rules.
With GIS Cloud’s AI assistant, users can describe the type of inspection they want to perform, for example, a hydrant inspection, and the system automatically generates an appropriate form structure. The generated form can include text fields, dropdowns, dependencies, condition assessments, and other data collection elements.
The result is less time spent configuring software and more time spent collecting useful information.
Turning Photos and Voice Notes into Structured GIS Data
One of the more compelling extensions of the AI-generated Forms workflow is the ability to transform unstructured field observations into structured GIS records.
- From photos: Once an inspection Form has been created, a user can upload a photograph of an asset, such as a fire hydrant, and the AI attempts to identify relevant information and automatically populate the appropriate inspection fields within that Form. The system can even assign confidence scores to each extracted observation, helping users understand where manual verification may be required before the data is saved.
- From voice: Field workers can dictate observations naturally, and the system converts those observations into structured GIS attributes. Instead of manually entering IDs, dates, asset conditions, and notes, users can simply speak while the AI handles the translation into database-ready information.
For organizations conducting large-scale inspections, the productivity impact could be substantial.
GIS Inside Claude
Another interesting capability is GIS Cloud’s support for the Model Context Protocol (MCP).
The company has built an integration that allows users to connect GIS Cloud directly to Claude. Once connected, GIS functionality becomes available inside the chat interface itself. Users can query maps, access GIS Cloud tools, perform analysis, and retrieve information without opening the GIS Cloud application.
This matters because many professionals are increasingly spending their day inside AI assistants. Instead of moving between applications, GIS becomes another capability available within the broader AI workflow.
GIS Cloud uses its own datasets as trusted sources. Rather than relying entirely on an LLM’s internal knowledge, users can query verified organizational data while still benefiting from natural language interaction.
![]()
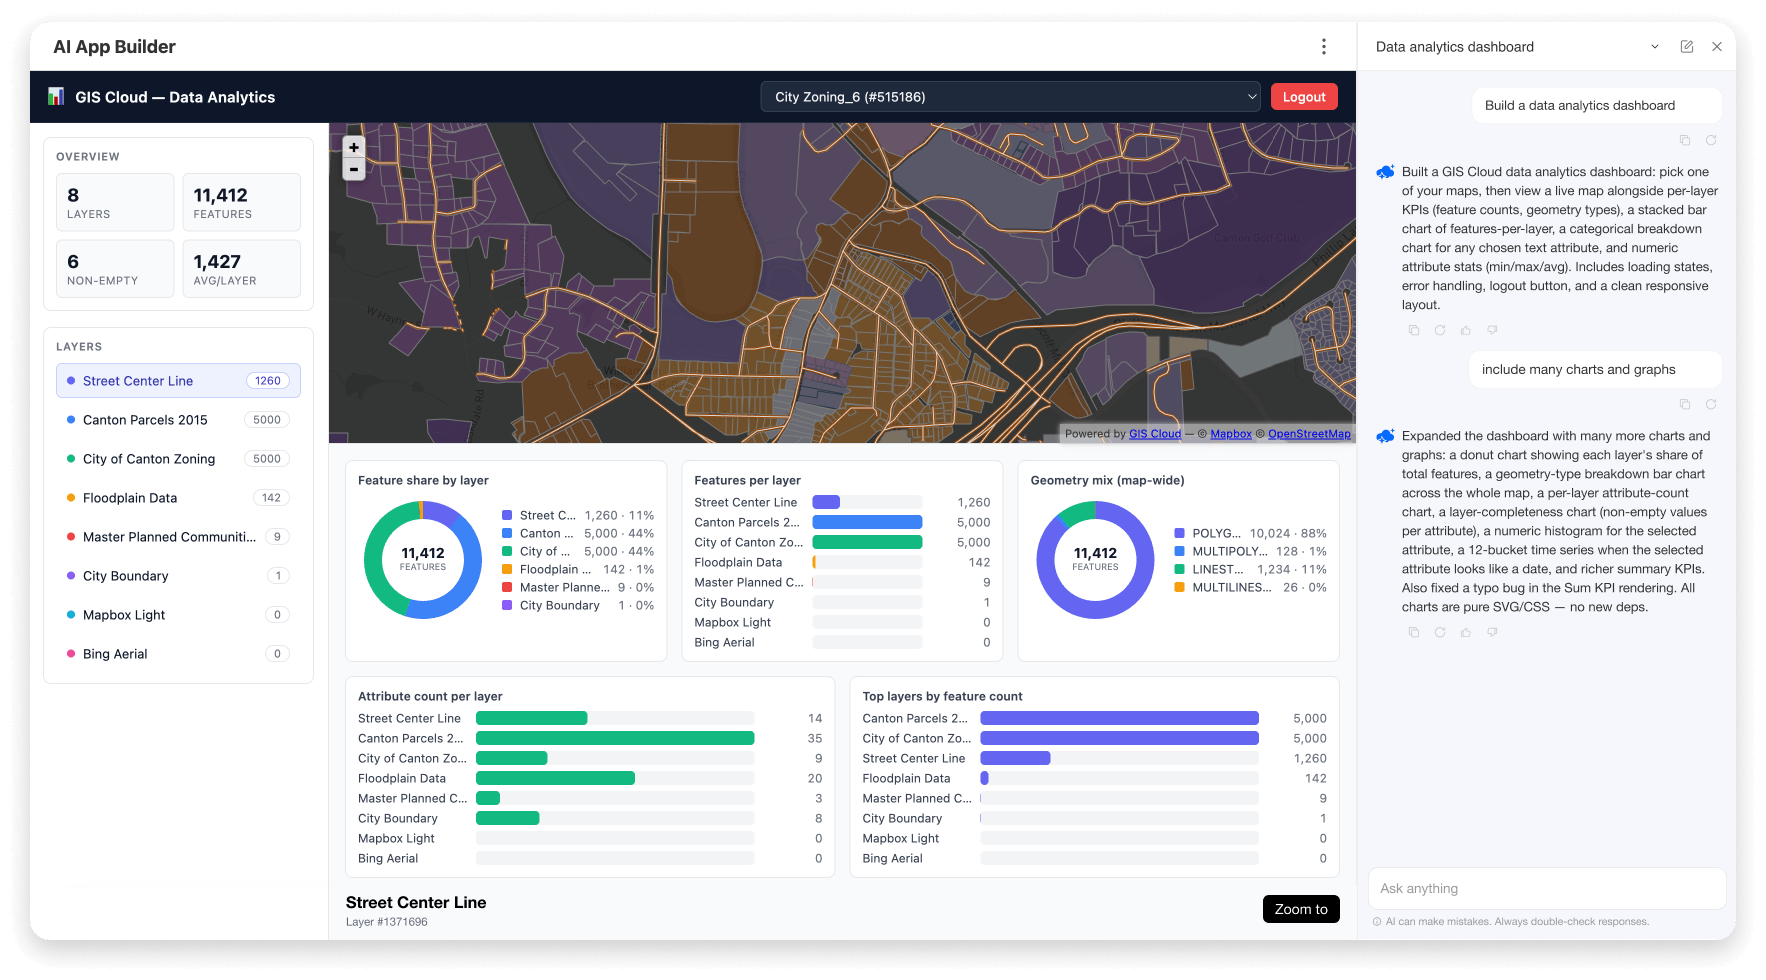
Beyond Maps: AI-Generated GIS Applications
GIS Cloud is also experimenting with AI-generated applications.
Using natural language prompts, users can create dashboards, custom applications, and visualizations without traditional development work. The concept resembles “vibe coding” for GIS, where users describe what they want and the platform generates the application structure automatically.
The implications are potentially significant. Organizations frequently need lightweight GIS dashboards tailored to specific workflows, departments, or projects. Traditionally, building these applications required development resources. AI may dramatically reduce that effort.
Why This Matters
The geospatial industry has spent years discussing democratization.
Yet GIS remains difficult for many organizations. While maps have become mainstream, advanced spatial analysis often remains the domain of specialists.
What GIS Cloud is proposing is not the replacement of GIS professionals. Rather, it is the introduction of a new interface layer between people and geospatial systems.
- Experienced users gain productivity.
- New users gain accessibility.
- Organizations gain the ability to extract more value from their spatial data without requiring everyone to become a GIS expert.
Many vendors are currently adding AI assistants to their products. What makes GIS Cloud’s approach interesting is the breadth of workflows being addressed simultaneously – from spatial querying and analysis to field data collection, image interpretation, voice input, application building, and integration with external LLMs.
Whether this ultimately becomes the dominant way people interact with GIS remains to be seen.
But one thing is increasingly clear: the future of GIS may involve fewer menus, fewer SQL statements, and a lot more conversation.
Did you like this post? Read more and subscribe to our monthly newsletter!

#Featured

Next article
Tech for Earth: Explaining the Planet, On the Ground and in Orbit
This spring the foundation models that interpret satellite imagery stopped being a research curiosity. Earth Index opened to anyone with a browser, a Google model let analysts map palm oil mills at country level from a laptop in an afternoon, and NASA’s Prithvi became the first geospatial foundation model to run in orbit. On the ground, NISAR returned its first map of Mexico City sinking into its old lakebed, and Europe closed the books on its hottest, most fire-scarred year on record.
A Search Engine for the Planet Opens to Everyone
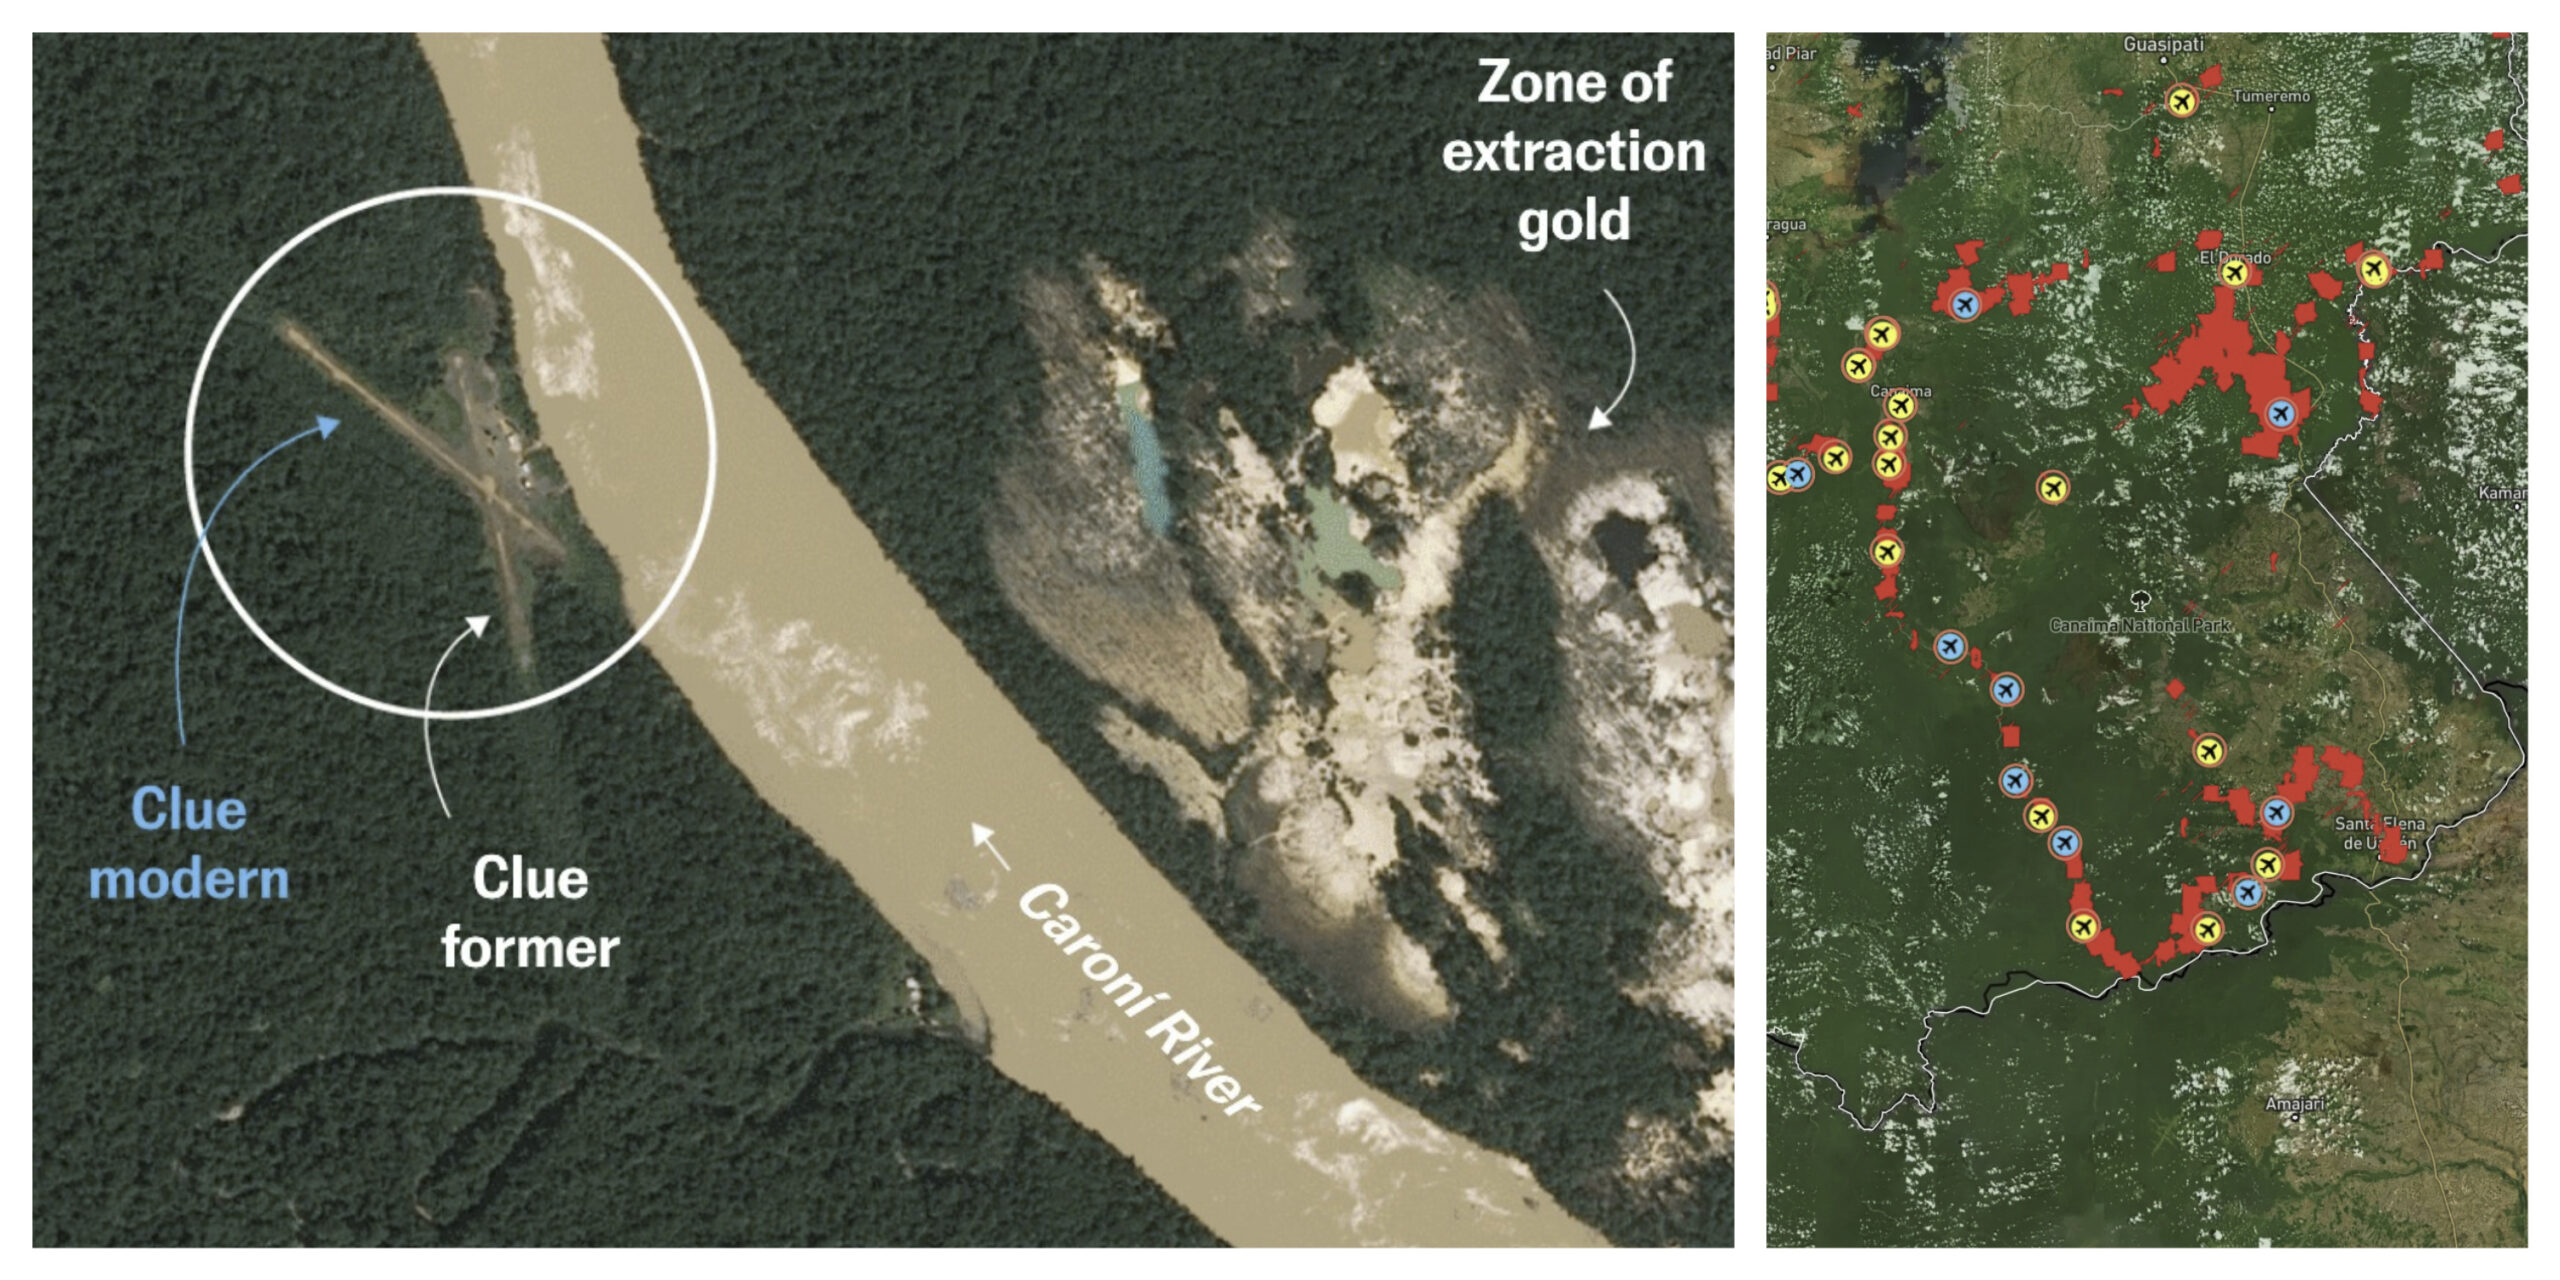
The idea of searching the Earth like a database has been around for years. Earth Index, built by the nonprofit Earth Genome, makes it practical. You highlight an example on the map, a clear-cut, a mine, a trawler, an airstrip, and the system finds places that look like it across the archive. The matching runs on foundation models trained on large volumes of Earth observation data, so the tool recognises patterns across regions and years. Until recently this kind of analysis needed a specialist team, a custom model, and weeks of compute. Mongabay’s reporters used an earlier version to find unreported narcotrafficking airstrips in the Peruvian Amazon. As of late April, Earth Index is open without a waitlist: a free tier gives global access and the core features, while heavier usage, API access, and a more demanding Deep Search sit behind a paid tier. The imagery is mostly public and moderate resolution, so it suits mapping and investigation rather than live monitoring, and results still need a human to check them.
Related reading: how environmental reporters are using the same tools
Embeddings Reach the Field, and Orbit
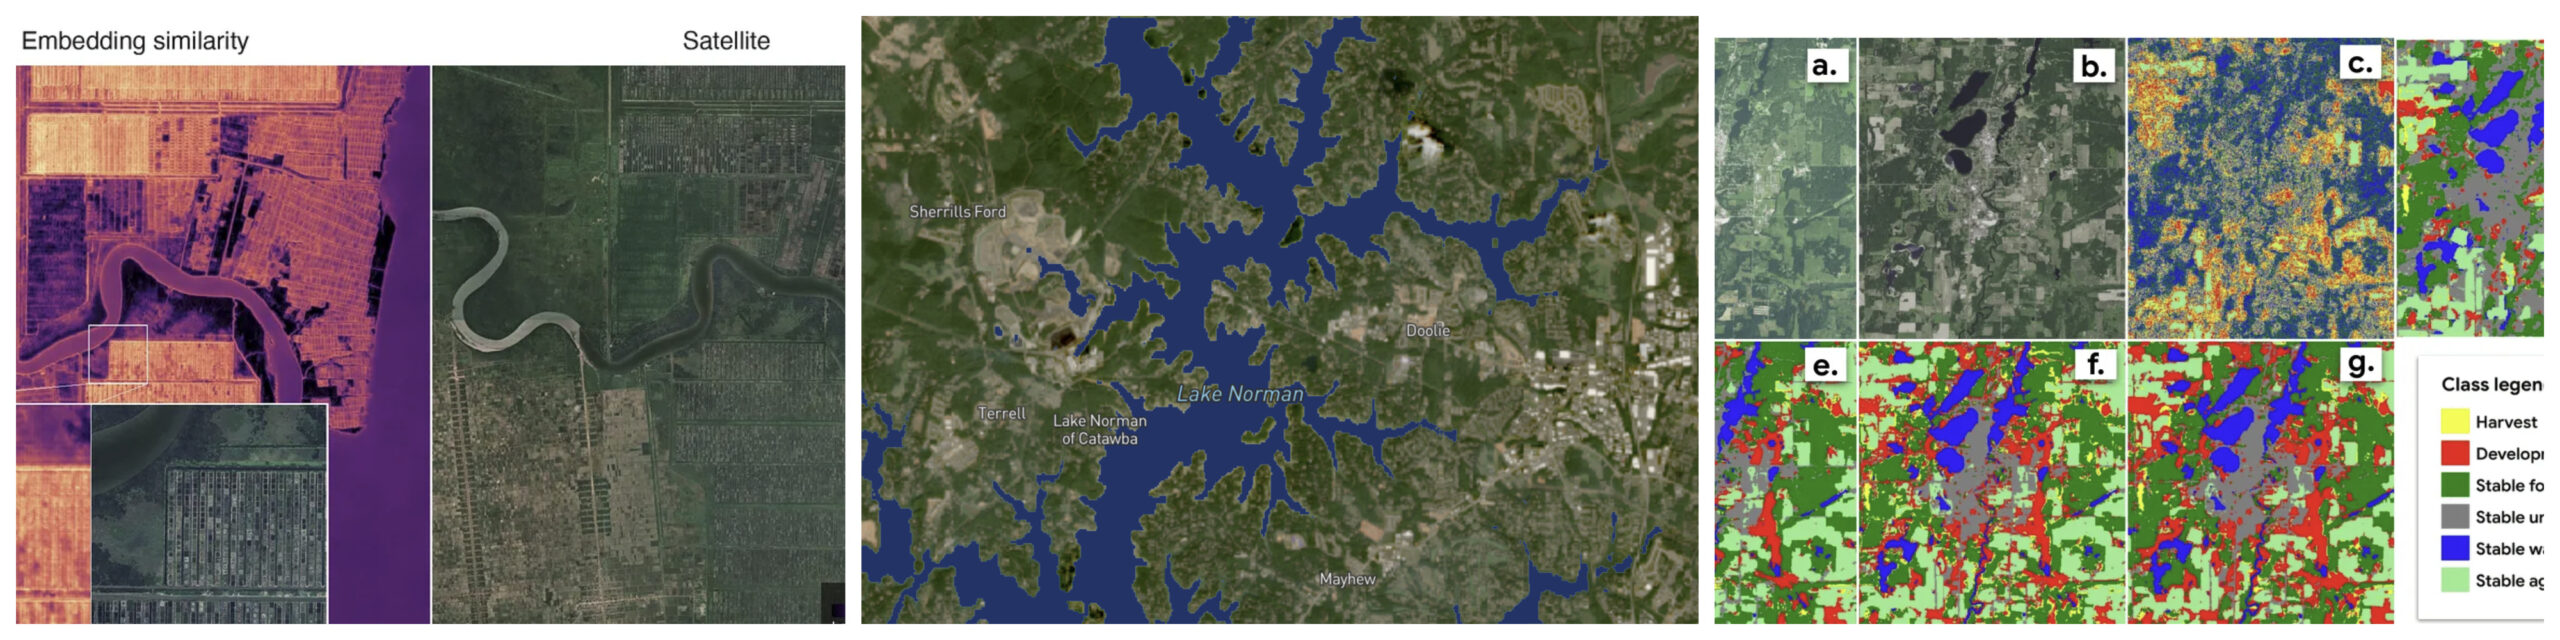
The same approach is showing up in day-to-day analysis. In a case study for Google Earth AI, the team at Epoch Blue used AlphaEarth Foundations satellite embeddings to find palm oil mills on Sumatra. Starting from 50 labelled examples, they detected close to 70 percent of the island’s known mills in a single afternoon. The reason it works is that the embeddings already encode what the land looks like as vectors, so a simple linear classifier can pick out a target. Scoring roughly 75 million vectors across Sumatra took 174 seconds on a consumer laptop. Their wider analysis tied just 5 percent of facilities to 73 percent of post-2020 deforestation in the region. The models are also leaving the data centre. In early May, a research team showed NASA and IBM’s open-source Prithvi geospatial model running on two in-orbit platforms, the first time a geospatial foundation model has done inference in space rather than on the ground. The point is to cut the gap between a satellite collecting data and someone acting on it. Planet made a similar case at NVIDIA’s GTC conference, describing a GPU-native pipeline that moves processing next to the sensor so wildfire insights arrive in seconds instead of hours.
Further reading: how you compare satellite embeddings changes what you detect
NISAR Reads the Ground Sinking Under Mexico City
NISAR, the joint NASA and Indian Space Research Organisation radar satellite launched in July 2025, returned one of its first subsidence maps, and it picked a hard target. The map of Mexico City covers October 2025 to January 2026, the dry season, and shows parts of the metropolitan area dropping by more than 2 centimetres a month, marked in dark blue. The cause is familiar to anyone who works on basin or deltaic cities. Mexico City sits on an old lakebed, and more than a century of groundwater pumping, combined with the weight of the city itself, has compacted the ground beneath it. An engineer first flagged the problem in 1925. By the 1990s and 2000s some districts were sinking around 35 centimetres a year, cracking roads, buildings, and water lines, and damaging the Metro. The Angel of Independence monument has had 14 steps added to its base as the land around it drops. What makes NISAR useful here is its L-band radar, which sees through cloud and vegetation and works day or night. It carries two radar instruments at different wavelengths and a 12-metre antenna reflector, and it revisits the same ground twice every 12 days. The longer L-band wavelength should help in places that are hard to measure from space, including vegetated coastal areas where sinking land and rising seas stack on top of each other.
Learn more about the NISAR mission.
Europe’s Hottest, Driest, Most Fire-Scarred Year
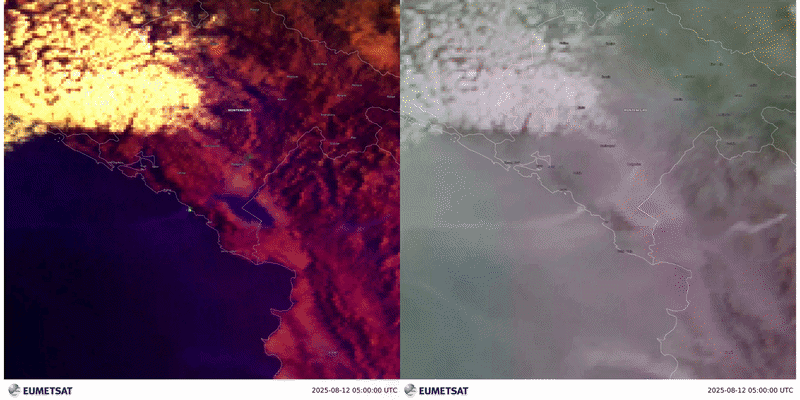
The European State of the Climate 2025, published in late April by ECMWF’s Copernicus Climate Change Service and the WMO, reads as a list of records. At least 95 percent of Europe saw above-average temperatures. Sub-Arctic Norway, Sweden, and Finland went through a three-week heatwave in July, with temperatures topping 30°C inside the Arctic Circle and peaking at 34.9°C in Frosta, Norway. The cold side of the ledger shrank. March snow cover was about 31 percent below average, Iceland recorded its second-largest glacier mass loss, and the Greenland Ice Sheet shed 139 billion tonnes of ice. At sea, the regional surface temperature was the highest on record, with strong marine heatwaves across most of the area. Wildfires burnt around 1,034,550 hectares, the largest area the report has logged, and 70 percent of rivers ran below their average annual flow. One number points the other way: renewables supplied 46.4 percent of Europe’s electricity, with solar reaching a record 12.5 percent. EUMETSAT’s imagery of the 2025 fire season is a good companion to the report if you want to see what those hectares looked like from orbit.
IRIDE Keeps Growing
Italy’s IRIDE programme added seven more satellites to its Hawk for Earth Observation constellation on 3 May, launched on a Falcon-9 from Vandenberg. That brings IRIDE to 31 satellites in orbit. The HEO satellites, built by Argotec, carry high-resolution multispectral optical sensors, and the first eight are already returning data. IRIDE is funded through Italy’s post-pandemic recovery plan and run with ESA and the Italian Space Agency. It is built to track ground motion, land cover, hydrogeological resources, fires, coastal change, and air quality, and to feed both public services and commercial applications. A separate group of 16 Eaglet II satellites adds multispectral imaging and vessel tracking, with more launches planned this year.
Landsat Works the Night Shift
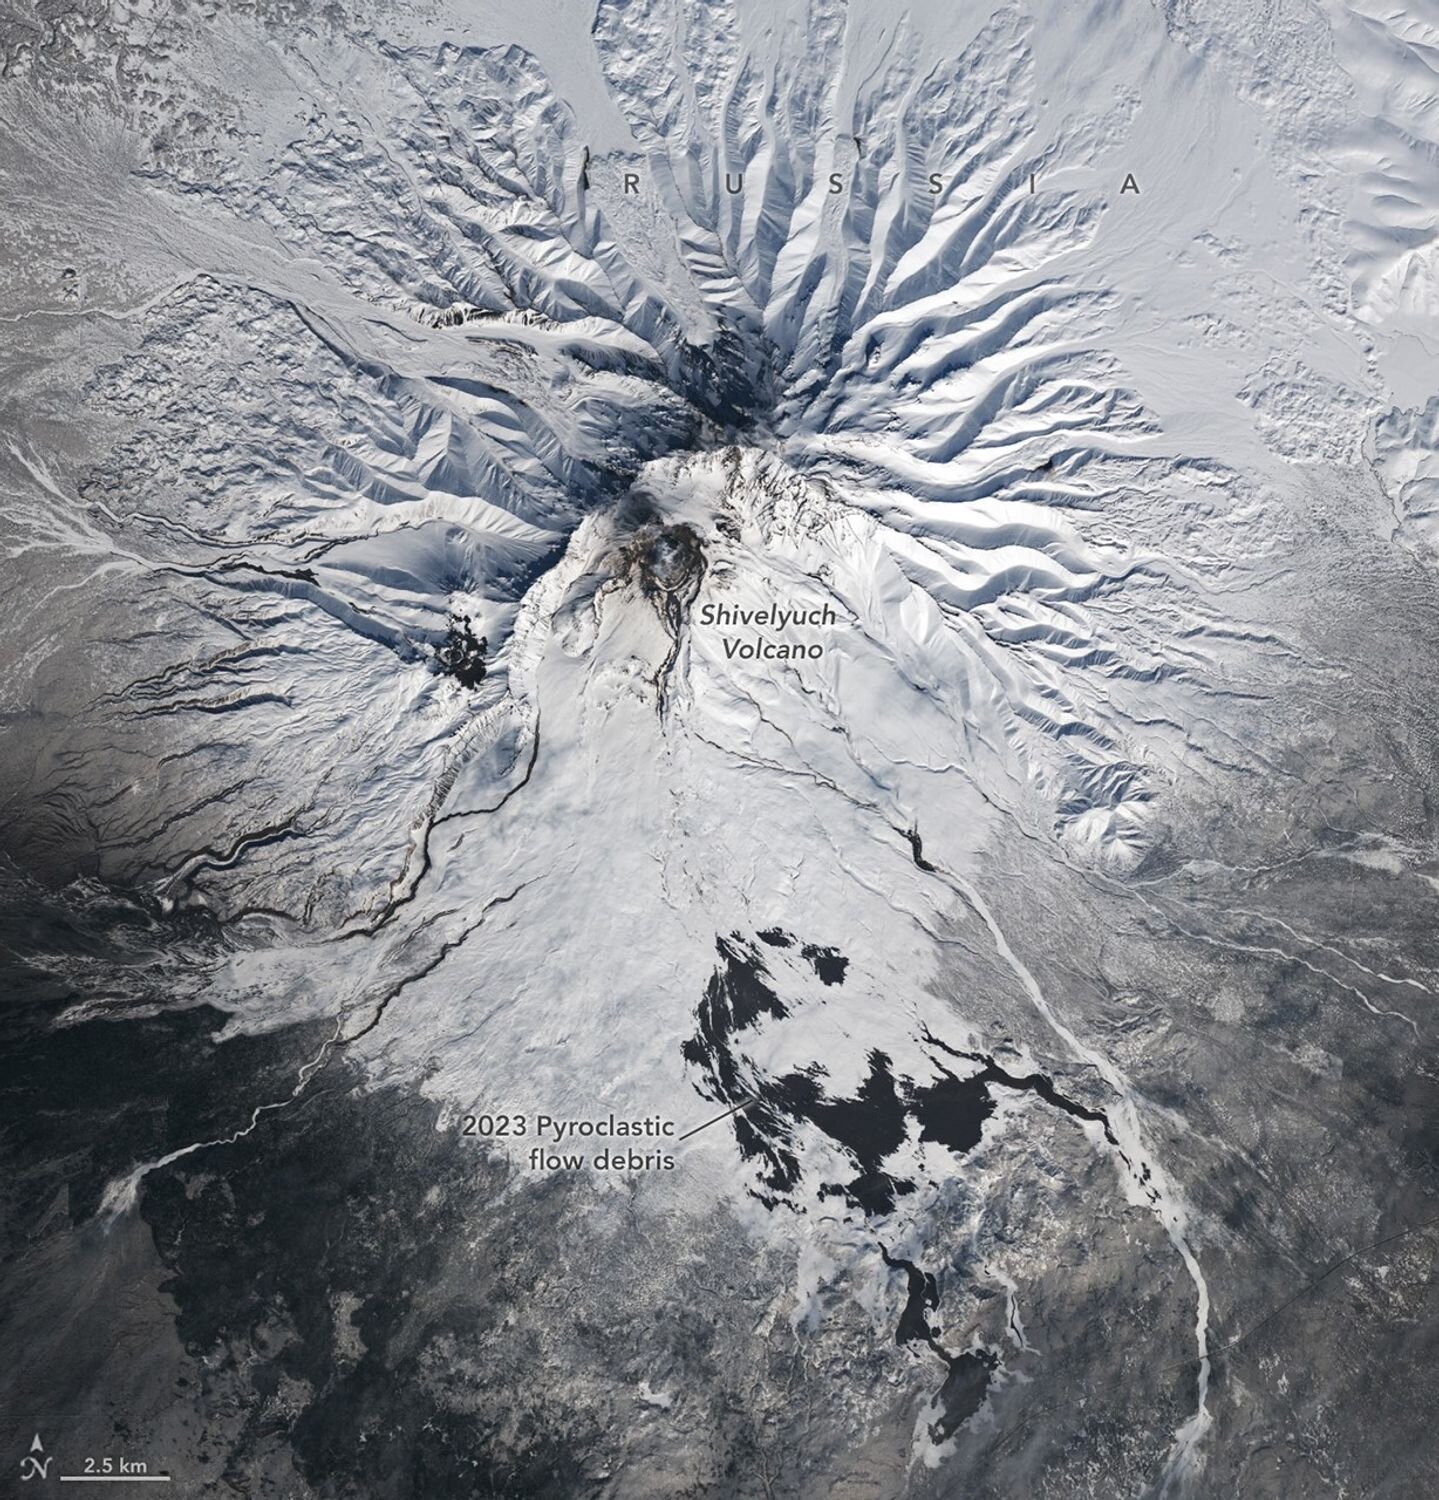
Landsat has imaged the sunlit side of Earth for more than 50 years. Lately Landsat 8 and 9 have been working their ascending, night-side orbit for special requests. The visible bands are not much use in the dark, but the thermal infrared sensor is, so the night passes pick up heat: active volcanoes, wildfires, city and power-plant hotspots, and ice shelves. The USGS EROS team laid out the science case for these collections in mid-April. For a recent daytime example, Landsat caught Russia’s Shiveluch, one of Kamchatka’s most active volcanoes, mid-eruption.
NVIDIA’s Earth Day, the Harder Problems
NVIDIA’s Earth Day roundup had the usual model announcements, but two projects stood out. The first is tsunami warning. A team from UT Austin, UC San Diego, and Lawrence Livermore won the 2025 ACM Gordon Bell Prize for a method aimed at the Cascadia fault off the Pacific Northwest, where a rupture would give the coast as little as 15 minutes. They precompute the expensive physics once per seafloor sensor, so when a real rupture hits, only a fast calculation remains. It finishes in under two-tenths of a second on GPUs and returns both a forecast and its uncertainty, which can be the difference between minutes of warning and none. The second is closer to conservation. Researchers in Borneo and Sumatra trained models to spot orangutan nests in drone imagery, processing 1,800 images in under five minutes on a single GPU where a person would need about a minute per image. All three orangutan species are critically endangered, and faster surveys mean more time spent acting on the results rather than reviewing photos. NVIDIA also highlighted AMP, which uses AI and robotics to pull recyclables out of waste streams and says it has diverted more than 2 billion pounds of material from landfills.
Maps Worth Your Time
A few cartography items from the past month. CORRECTIV.Europe published an interactive scrollytelling map of population change across roughly 100,000 European municipalities from 1961 to 2024, built on new Joint Research Centre data. The headline finding: half of all towns and communes have fewer residents than 60 years ago, even as the continent’s total population grew. The map shows two patterns clearly, rural emptying (one village in La Rioja lost about 98 percent of its people) and post-1990 decline across the former Eastern Bloc and East Germany, where 88 percent of municipalities shrank. EU population is expected to peak around 2029. On the lighter side, John Nelson and Peter Atwood reviewed the maps that show up in movies, from Indiana Jones to Harry Potter to the Goonies, judging them on accuracy and craft. It is exactly as nerdy as it sounds, and worth a watch.
NASA also released a small interactive that spells your name using Landsat imagery of landscapes shaped like letters, a reminder that the archive is large enough to find an alphabet in it. And for something more contemplative, designboom looked at Ursula K. Le Guin’s hand-drawn maps of her invented worlds.
Worth a Look
A few more links for the toolbox: Esri on the skills GIS students need before they graduate, ESA Academy’s Earth observation satellite systems design training, Apache Sedona on AWS Glue for processing billions of geospatial points a day, interpolating borehole data into aquifer top and base surfaces in ArcGIS Pro, water-body extraction with SAM3, and Esri’s look at GIS for deep-sea mining.
Compiled by the Geoawesome team. Got something we missed? Reach out, we read everything. Did you like this post? Read more and subscribe to our monthly newsletter!

