
A popular desktop application bows out after two decades, satellites count the world’s cultural treasures, and the maps in our pockets start talking back. March 2026 was a quieter month on the surface; but beneath it, the infrastructure of how we read and understand our planet keeps getting rebuilt.
The Whole Earth in a Single Frame
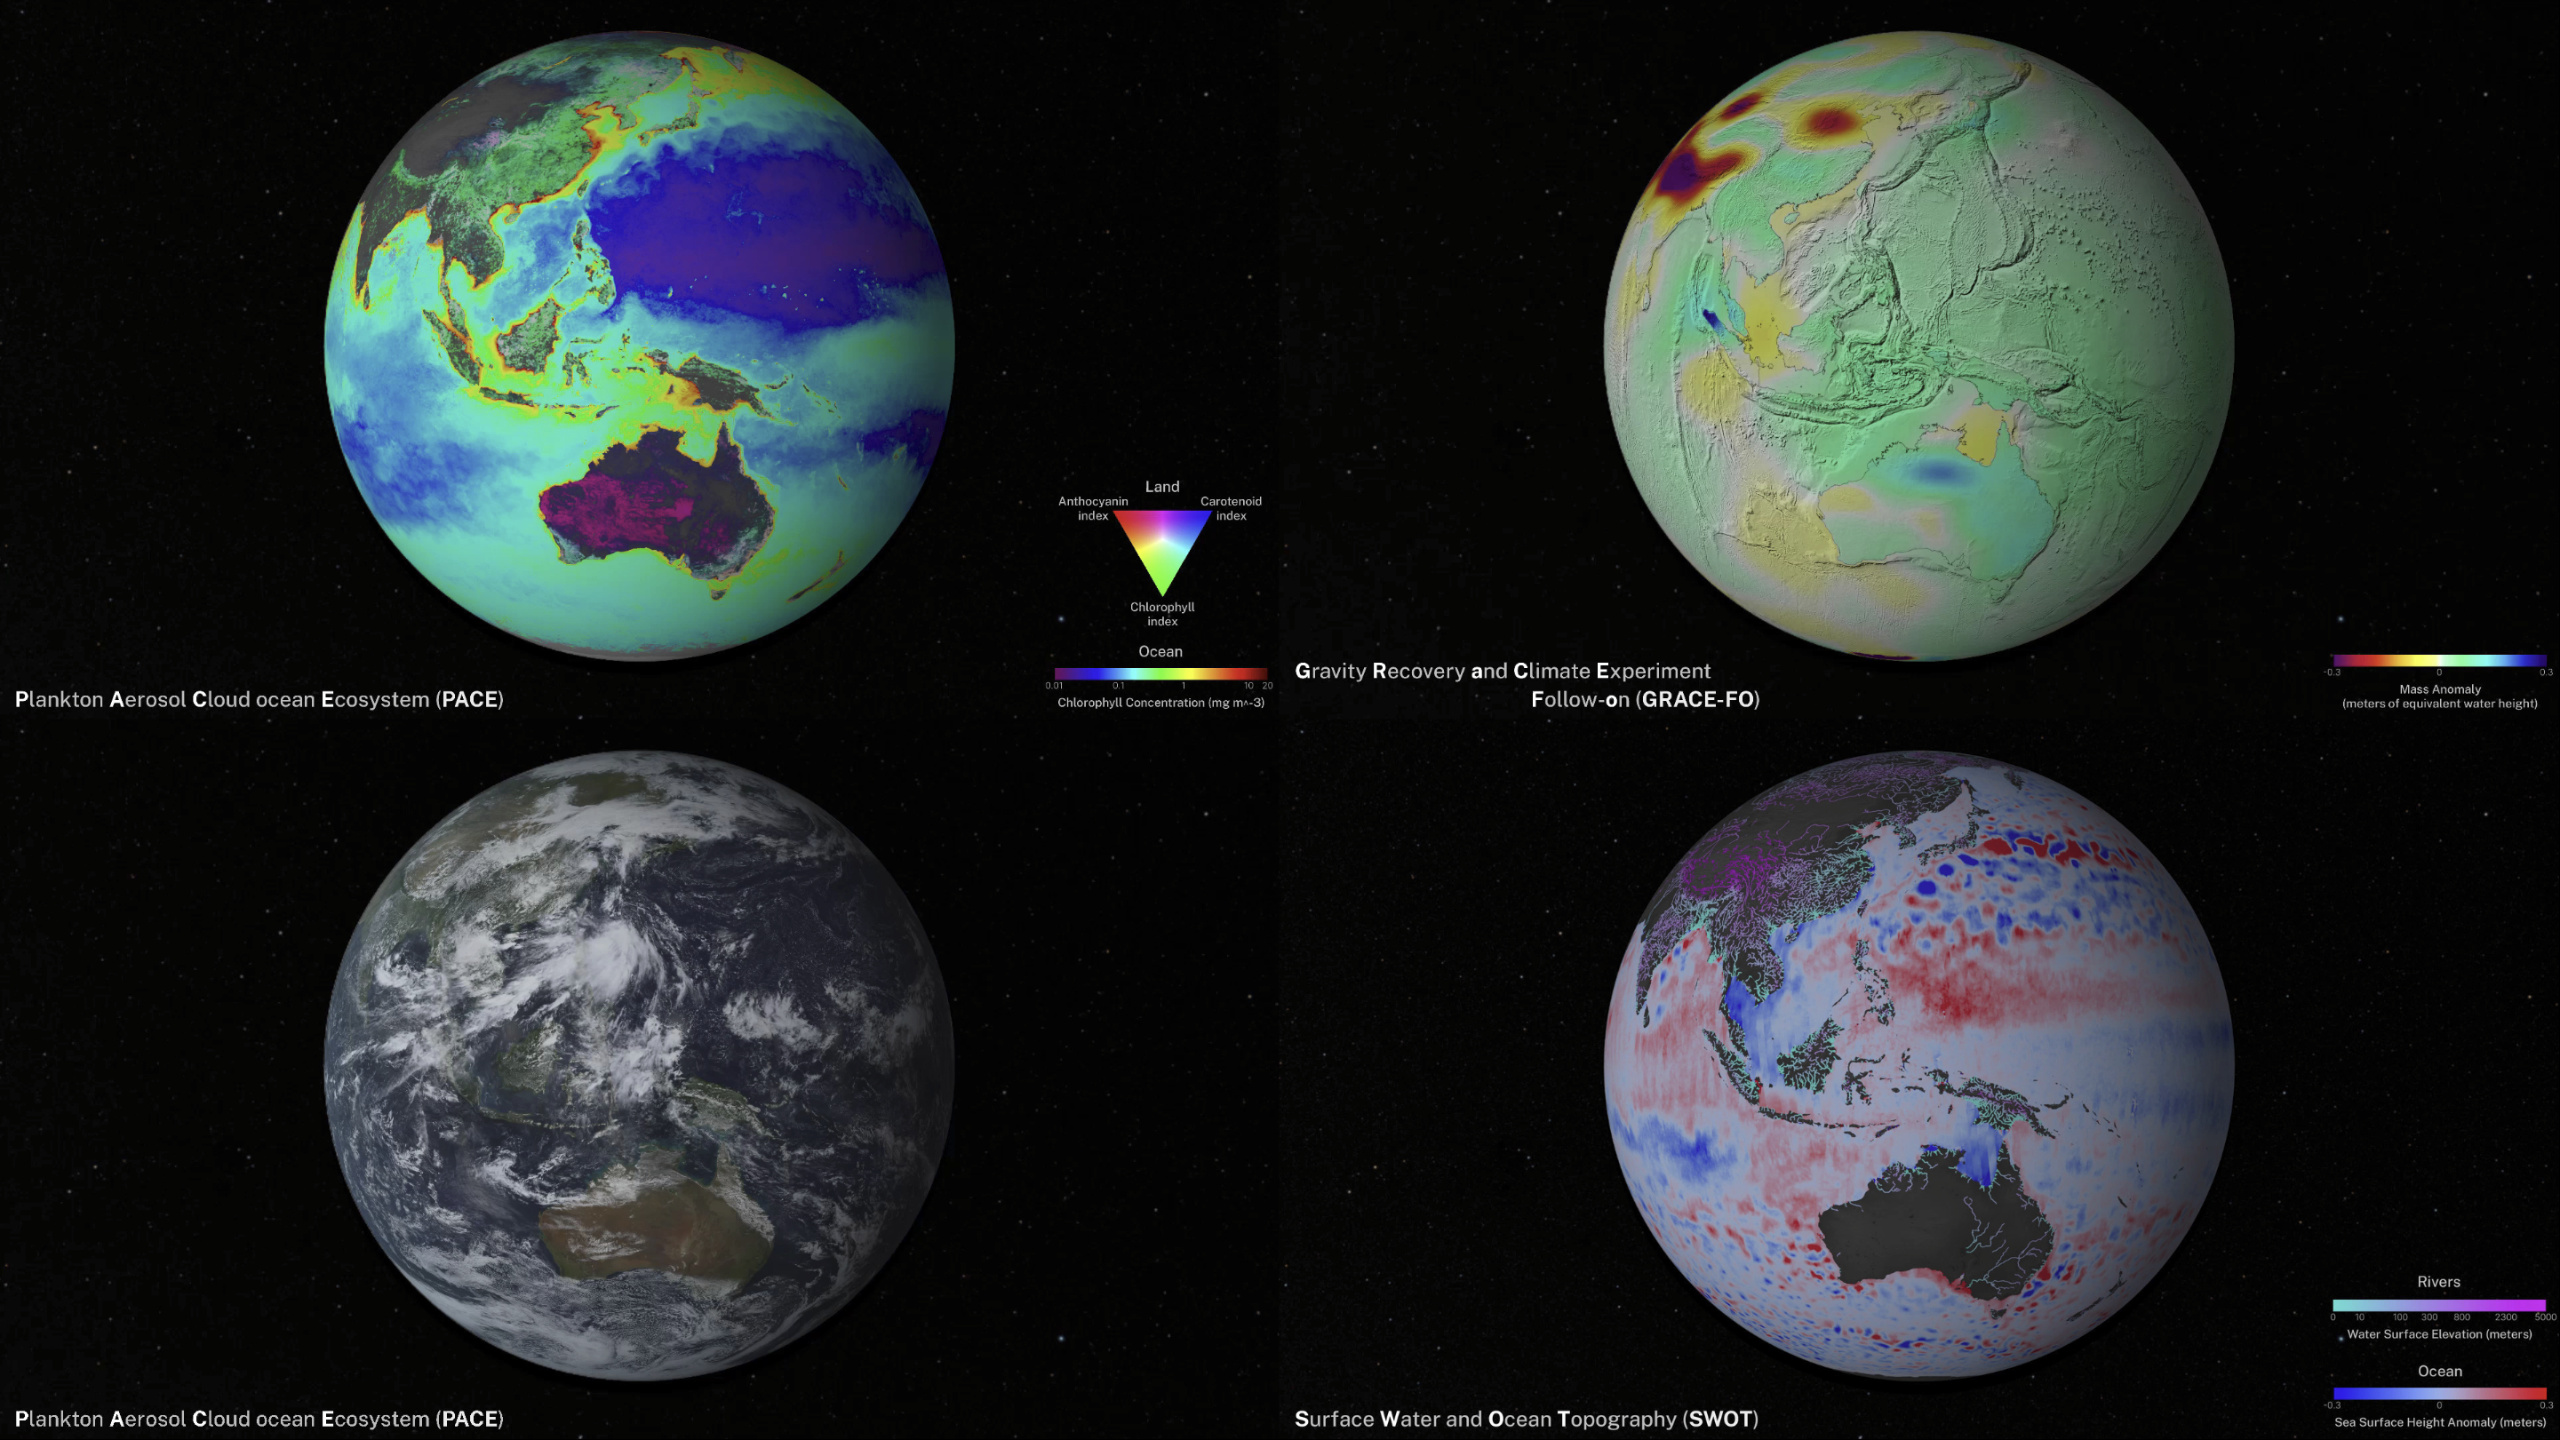
NASA’s Scientific Visualization Studio has released two compelling pieces of content that remind us just how extraordinary our planetary monitoring capabilities have become. The first is a stunning rotating globe animation, The Earth System Science Spheres, which cycles through datasets from four of Earth’s five major spheres: PACE true-colour for the atmosphere, PACE ocean colour and land vegetation pigment for the biosphere, SWOT river water height and sea surface height anomaly for the hydrosphere, and GRACE-FO mass anomaly for the geosphere. It is the kind of visualization that puts the entire integrated Earth system into a single, beautiful sequence, a reminder of how much data humanity now collects about its own planet.
The second release, the 2026 CEOS Fleet visualization, offers a complementary view from the outside looking in: a global map of every Earth Observation satellite now circling the planet, produced by the Committee on Earth Observation Satellites (CEOS). Seeing hundreds of individual orbital paths laid out together is genuinely striking. The coordinated fleet that now watches our planet continuously, through cloud, night, and season, is one of the great engineering achievements of our era, and most people have never heard of CEOS.
Related reading: Earth observation satellites, Meteosat weather satellites
Landsat at 50-Plus: Still Delivering Science, Not Just Scenery
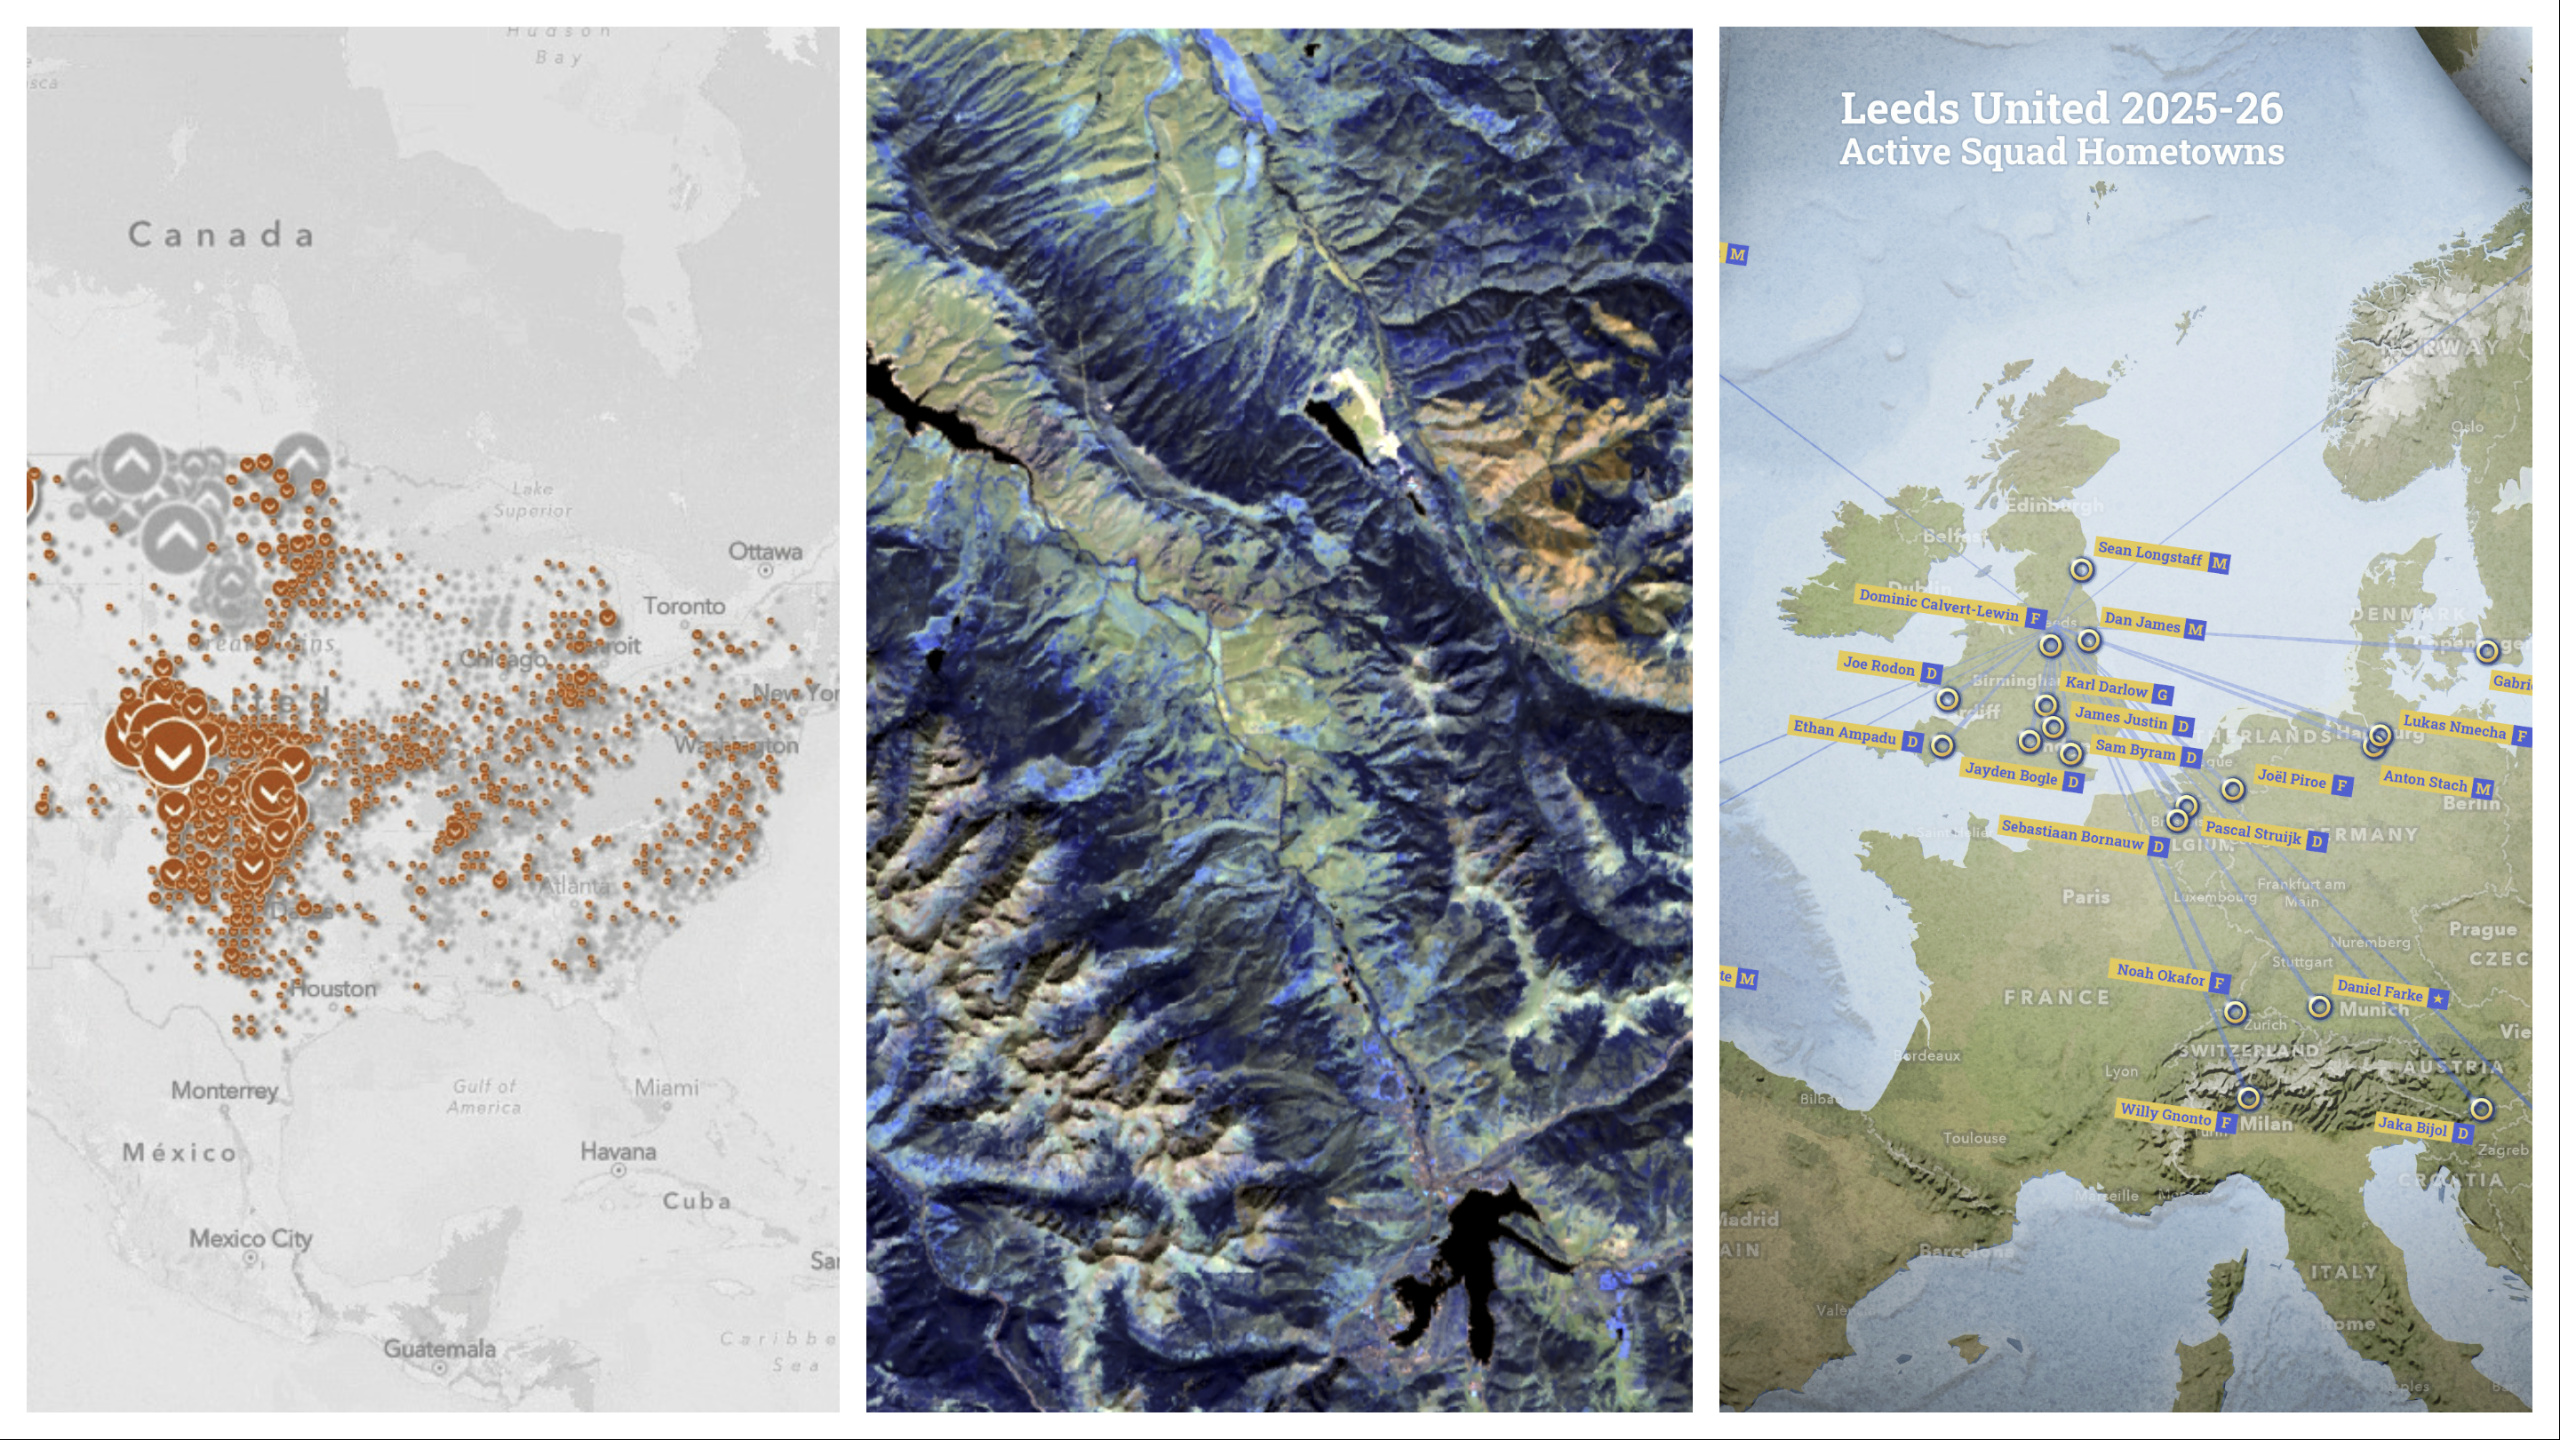
Landsat 9 continues to demonstrate that Earth observation satellites are scientific instruments first and image factories second. NASA’s in-depth feature on Landsat 9 highlights how the mission’s two instruments, the Operational Land Imager 2 (OLI-2) and the Thermal Infrared Sensor 2 (TIRS-2), contribute calibrated, multi-decade data for tracking glacial retreat, forest cover change, agricultural water use, and urban heat islands. It is a good read for anyone who still thinks of Landsat primarily as a source of pretty pictures: the programme’s scientific legacy and long-term data continuity are what make it irreplaceable.
Further reading: How glaciers flow with the seasons
Copernicus Climate Bulletin: February Was Warm and Wet
The Copernicus Climate Change Service reported that February 2026 was the fifth warmest February on record globally, while western Europe experienced exceptionally wet conditions. The bulletin continues a now-familiar pattern of monthly records that keep nudging the baseline upward. For the geospatial community, reports like this are not just climate news, they are the operational context that makes real-time Earth observation infrastructure relevant and urgent.
Related: Temperature contrasts in the Northern Hemisphere, AI and weather tech reshaping climate risk
Google Maps Goes Conversational
One of the highest-profile geospatial product announcements of the month came from Google. Ask Maps, powered by Gemini, allows users to ask natural language questions, “find a quiet coffee shop near the park where I can bring my dog”, and receive contextually aware responses that draw on the rich local data layer Google has built over two decades. Paired with an upgraded Immersive Navigation mode that renders realistic 3D environments during turn-by-turn guidance, these updates signal a meaningful shift in how mass-market mapping interfaces work. The integration of conversational AI into navigation is not a gimmick; it is a direct consequence of the explosion in structured geospatial data and the maturation of large language models capable of reasoning over it. TechCrunch covered the announcement in detail.
Comparison reading: Google Maps vs. Waze, Maps alternatives review
IBM Releases TerraStackAI for Earth and Space Geospatial Workflows
IBM Research published a major open-source release: TerraStackAI, an integrated technology stack designed to cover the full geospatial AI workflow from data preparation to production deployment. The ecosystem builds on IBM-NASA’s Prithvi-EO and IBM-ESA’s TerraMind foundation models, and packages them into four interoperable components: TerraKit for AI-ready data preparation (query, align, label); TerraTorch for fine-tuning and evaluating foundation models; Iterate for Bayesian hyperparameter optimisation; and a new Geospatial Studio for operationalising production services. A companion release on Red Hat OpenShift AI means enterprise teams can now deploy Earth and space AI models at scale in their existing infrastructure. For practitioners who have found working with geospatial foundation models fragmented and inaccessible, TerraStackAI addresses exactly that gap. This is open-source tooling that deserves wide attention from the EO and GeoAI communities.
Background: NVIDIA Earth 2 open models
GeoAI Enters the Hydrographic Office
Hydrographic offices and maritime authorities are not typically the first adopters of new technology, but a detailed case study from Hydro International documents how geospatial AI is beginning to reshape hydrospatial workflows. From AI-assisted quality control and automated chart updating to natural-language-interface help systems, the article describes a sector beginning to move from labour-intensive manual processes towards smart, AI-augmented pipelines. The underlying logic, that maritime navigation, port management, and the blue economy broadly depend on accurate, up-to-date spatial data, means this transformation is genuinely consequential.
Rubin Observatory: A New Kind of Sky Survey
Geospatial data does not have to be terrestrial, and the Vera C. Rubin Observatory’s first real-time sky alerts are a reminder of that. On 24 February, the observatory’s Legacy Survey of Space and Time (LSST) system successfully generated 800,000 public alerts of changes in the night sky in a single night, every one of them flagging a transient event like a moving asteroid, a variable star, or a possible supernova. The alerting system is ultimately expected to generate up to seven million alerts per night. For the GIS community, this is a fascinating parallel: the same challenges of real-time change detection, spatial querying at scale, and alert-driven workflows that Earth observation teams grapple with are now playing out across the entire Southern Hemisphere sky. Stellar cartography has become, functionally, a geospatial discipline.
Explore: Astrocartography travel trend
ArcMap Retires: A Milestone for the GIS World
On 1 March 2026, Esri officially retired ArcGIS Desktop, including ArcMap, ending support for software that helped define what GIS meant for an entire generation of practitioners. For many professionals, ArcMap was not just a tool but the environment in which they first understood spatial thinking, built their first maps, and developed the workflows that shaped their careers. The retirement is not an ending but a marker of how far the platform has evolved: from single-desktop application to a modern, web-first, mobile-inclusive ecosystem. ArcGIS Pro, ArcGIS Online, and Field Maps are the successors, and Esri has published migration guides for teams still transitioning. For those who want alternatives, a roundup of ArcGIS alternatives also circulated this month, covering QGIS, Mapbox, and other open and commercial options.
Professional development: Ultimate GIS guide for mining professionals
ArcGIS Platform Updates: SDK 5.0, Imagery Enhancements, and Cartographic Play
Several platform-level updates from Esri are worth noting for developers and analysts:
The ArcGIS Maps SDK for JavaScript version 5.0 introduces a genuinely significant addition: an AI assistant component (beta) for agentic web mapping applications. Developers can now embed a conversational interface, with navigation, data exploration, and help agents, directly into map applications using a small amount of markup. The SDK also adopts semantic versioning for the first time, making upgrade planning much more predictable.
The February 2026 imagery update for ArcGIS Online brings enhanced hyperspectral support (new AVIRIS and EMIT raster types), two new raster analysis tools (Geomorphon Landforms and Summarize Categorical Raster), and a new Accelerated Analysis beta that speeds up deep learning workflows at no additional cost.
And for those who care about the craft side of cartography, John Nelson’s blog post on how to “enthingify” maps with cartoon imagery and chunky overview globes, his word, and a good one, is pure map-making joy. The technique involves applying raster functions to produce illustration-style imagery, blending terrain layers, and adding cast-shadow overview globes that give a map physical weight and presence. Maps that feel touchable, Nelson argues, are maps that communicate. This kind of craft thinking belongs in the professional GIS conversation.
For cartographic craft, explore: Cartoon imagery and chunky overview globes, 3D printable STL creation
ESA’s Celeste and the Future of LEO-Based Navigation
ESA launched Celeste, its LEO-PNT experimental satellite, on 24 March, a demonstration mission exploring Low Earth Orbit positioning, navigation, and timing as a complement or backup to traditional GNSS constellations. LEO-PNT is one of the more important concepts in navigation right now: signals from low-orbit satellites are significantly stronger and faster than those from medium-orbit GNSS, with potential to improve indoor positioning, provide resilience against jamming and spoofing, and open up use cases that GPS alone cannot reliably support. Celeste is an early but meaningful step.
On the commercial side, Digital Mapping Group released FastXY, a high-precision GNSS mapping app aimed at survey and field mapping professionals who need centimetre-level accuracy on mobile devices.
Space infrastructure: Arctic weather satellite paves constellation
Copernicus and Cultural Heritage: Satellites as Guardians of the Past
One of the meaningful threads in this month’s news is the growing role of Copernicus data in cultural heritage monitoring. The Copernicus World Heritage Hub aggregates Copernicus products for monitoring and managing UNESCO World Heritage Sites. The use cases are concrete: detecting ground subsidence threatening ancient monuments, tracking coastal erosion around historic settlements, mapping urban expansion into heritage buffer zones, and assessing conflict damage to archaeological sites. For anyone interested in this intersection, Copernicus supporting disaster resilience in Europe offers complementary perspective.
Learn more: Satellite imagery and AI reveal hidden development needs, Mapping cemeteries with drones and phones
StoryMaps: Geospatial Storytelling in Practice
Several notable ArcGIS StoryMaps collections were shared this March. They represent the continuing maturation of StoryMaps as a medium for communicating spatial insight to non-specialist audiences. Explore these examples: StoryMap Example 1, StoryMap Example 2
For anyone building a public-facing geospatial product or report, the current generation of StoryMaps templates offers a high baseline for quality.
Compiled by the Geoawesome team. Got something we missed? Reach out, we read everything.
Did you like this post? Read more and subscribe to our monthly newsletter!

#GeoDev

Next article
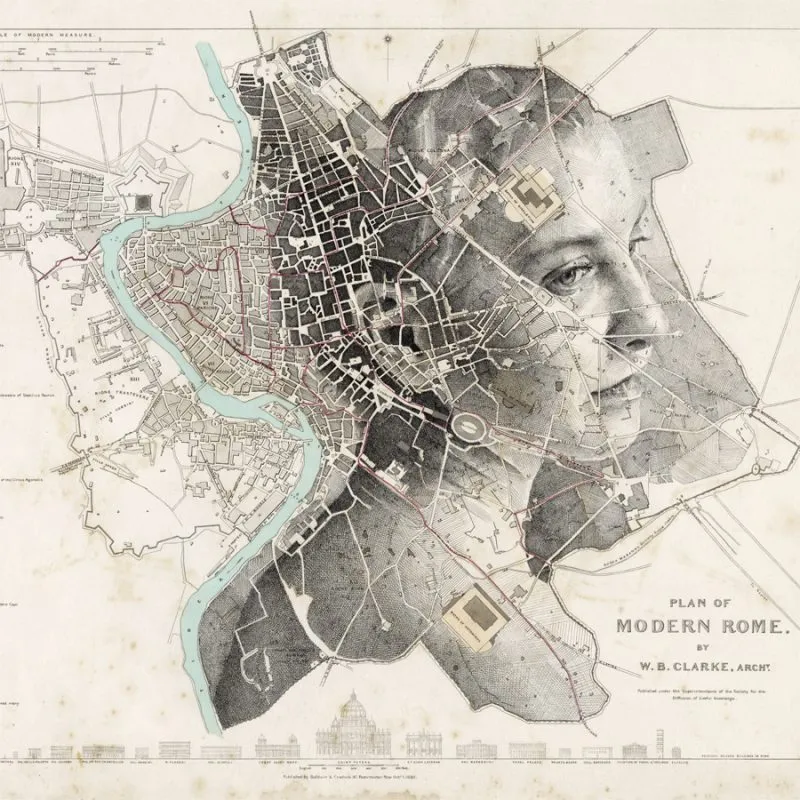

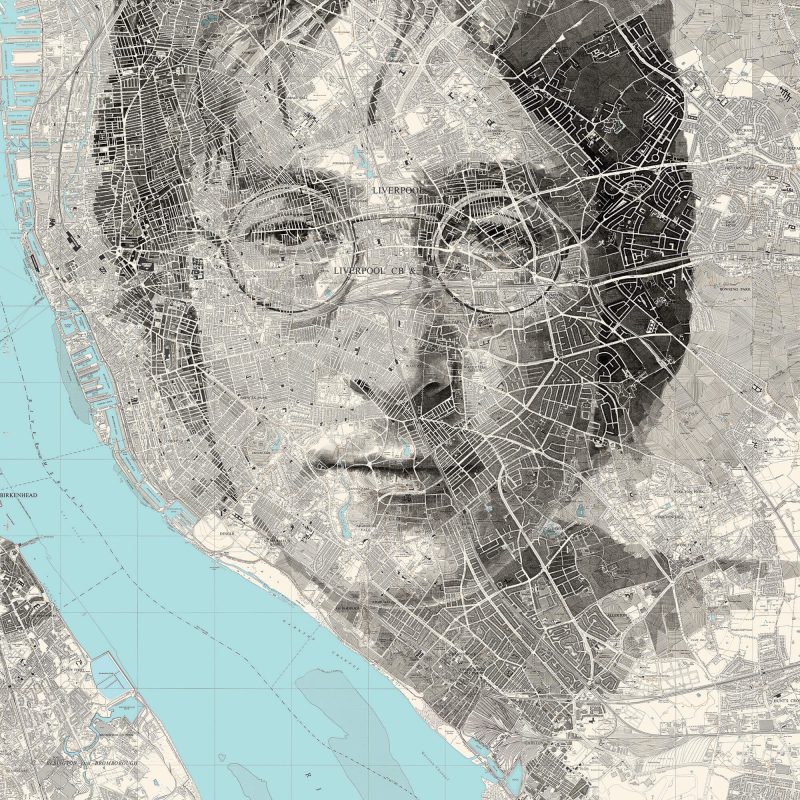
Maps are usually tools. They help us navigate cities, plan journeys, and understand geography. But sometimes maps can become something else entirely: an art, a canvas for storytelling. British artist Ed Fairburn has built a unique artistic career by transforming maps into portraits. At first glance, his works appear to be ordinary vintage maps. Roads, rivers, and topographic lines form familiar patterns of geography.
But step back—and suddenly a human face emerges from the landscape. Fairburn’s work sits at the intersection of cartography and portraiture. It reminds us that maps are not just representations of space. They can also tell stories about people, identity, and place.
A Fascination with Maps
Fairburn’s artistic journey began with two simple interests: collecting old paper maps and drawing portraits. Eventually he realized that the two could merge into something entirely new. Instead of drawing on blank paper, he began experimenting with maps as a base layer. At first this meant using everyday materials—road atlases or topographic sheets. Over time, it became a defining part of his style.
Vintage maps are especially appealing to him. Their aged colors, intricate symbols, and complex networks of roads and rivers provide a rich visual structure. Rather than fighting these elements, Fairburn embraces them. He studies each map carefully before starting a drawing, sometimes spending hours analyzing the terrain and patterns. The goal is not to impose a portrait on the map, but to allow the map to guide the composition. In his words, the artwork should “feed the composition instead of fighting it.”
The Technique: “Topopointillism”
Fairburn describes his artistic method as “topopointillism.” The term combines two ideas:
- Topography — the representation of landforms and landscapes
- Pointillism — the artistic technique of building images from small dots or strokes
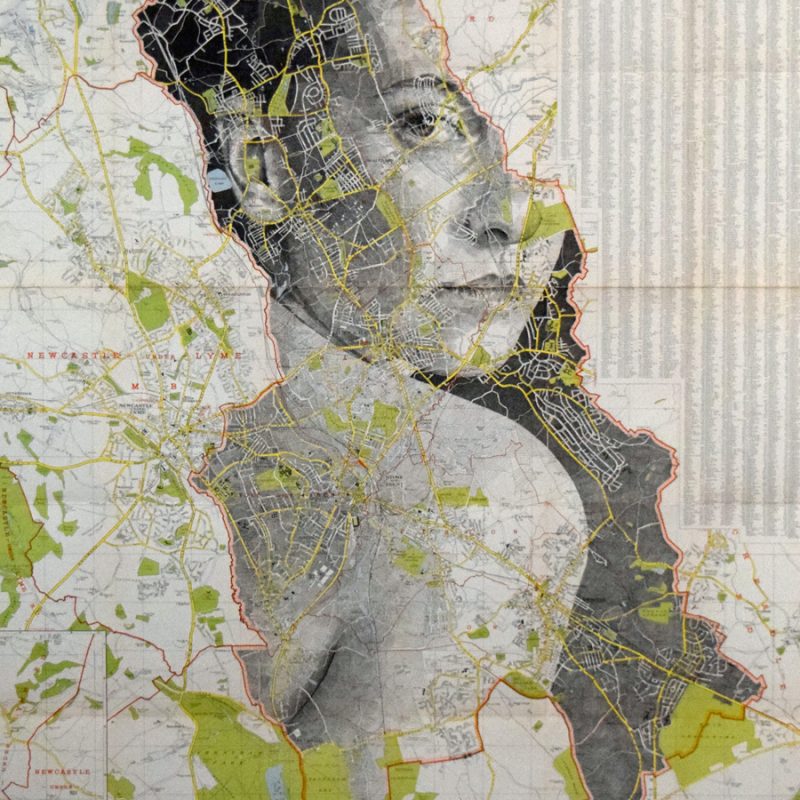
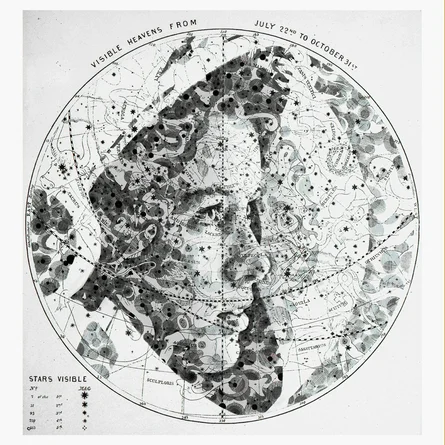
Using ink, pencil, and cross-hatching, Fairburn gradually transforms the patterns already present in the map. Roads become the lines of a jaw or brow. Rivers may form the curve of a cheek or shoulder. Contour lines become shadows and textures. The process is slow and meticulous. Dense layers of cross-hatching create the illusion of depth, light, and skin texture. From up close, the viewer sees an abstract network of lines. But from a distance, the portrait suddenly becomes clear. The result is a fascinating visual paradox: the closer you look, the more the portrait dissolves into geography. Step back, and the landscape becomes a human face.
People and Places
A key idea behind Fairburn’s work is the relationship between people and the landscapes they inhabit. In many of his portraits, the geography of a place subtly shapes the subject. A city’s road network might guide the orientation of a face. A coastline might form the edge of a shoulder. Rivers and highways act almost like the veins of the human body.
Fairburn often explains that these similarities between landscapes and anatomy inspire his work. Roads resemble arteries, waterways resemble veins, and the structure of cities mirrors the structure of living organisms. Through this approach, the artwork suggests that people and places are deeply interconnected. The environments we live in shape who we are—and in turn, we reshape those landscapes. It’s a poetic idea that resonates strongly with anyone interested in geography or cartography.
From Studio Experiments to Global Recognition
Fairburn began experimenting with map portraits around 2012, while studying illustration at Cardiff School of Art and Design.
What started as a creative experiment quickly gained attention online. The unusual combination of cartography and portraiture caught the imagination of audiences around the world. Since then, his work has appeared in galleries and exhibitions internationally. Collectors now acquire both original drawings and limited edition prints.
Fairburn’s artistic style has also attracted commercial commissions. His portfolio includes work for book publishers, film studios, and music projects. Among the most notable collaborations are artworks connected to the John Wick film franchise and a Grammy-winning John Lennon project, demonstrating how map-based art can extend far beyond traditional galleries. Despite these high-profile projects, Fairburn’s core practice remains deeply rooted in traditional techniques: pen, ink, graphite, and paper maps.
The Power of Analog in a Digital World
One of the intriguing aspects of Fairburn’s work is its analog nature. In an era dominated by digital mapping platforms—Google Maps, satellite imagery, real-time navigation—his art returns to the tactile qualities of cartography. Paper maps carry a sense of permanence. They show a snapshot of geography at a specific moment in time. Roads may have changed since then, cities may have expanded, but the map remains frozen in history. Fairburn uses this permanence to create artworks that feel timeless.
The portrait emerges from a document that once served a practical purpose: guiding someone through the world. The transformation is subtle but powerful. A utilitarian object becomes something emotional and expressive.
A New Way of Seeing Maps
For people working in geospatial industries, Fairburn’s work offers an interesting reminder. Maps are usually treated as tools for analysis, navigation, or decision-making. But they are also visual artifacts—carefully designed systems of symbols, colors, and lines.
Cartographers have always known this. The history of mapmaking is full of examples where functionality meets artistic expression.
Fairburn simply pushes that idea further.
He reinterprets the language of cartography—contour lines, roads, boundaries—and turns it into portraiture. His work invites viewers to look at maps differently. Not just as instruments for finding our way, but as images that contain hidden stories about human identity and the places we call home.
Did you like this post? How do you like connection of art and maps?
Read more and subscribe to our monthly newsletter!

