

Traditional land-cover models are fussy creatures. Train one to recognize buildings, roads and trees, then ask it to find swimming pools or solar panels, and it may stare back blankly.
GeoSeg-OV wants to make that problem disappear.
The new research framework explores “open-vocabulary” remote-sensing segmentation: identifying every pixel belonging to a category described in ordinary language, including categories the model did not encounter during training.
In theory, this moves GeoAI closer to a much more flexible workflow. Instead of building and labeling a new training dataset whenever the mapping question changes, an analyst could supply a new vocabulary and let the model search for it.
The difficulty is that Earth rarely looks consistent from above. A building photographed by a drone at 5-centimeter resolution looks very different from one captured by a satellite at 60 centimeters. Geography, climate, sensors, viewing angles and image resolution all create what the researchers call a “geospatial gap.”
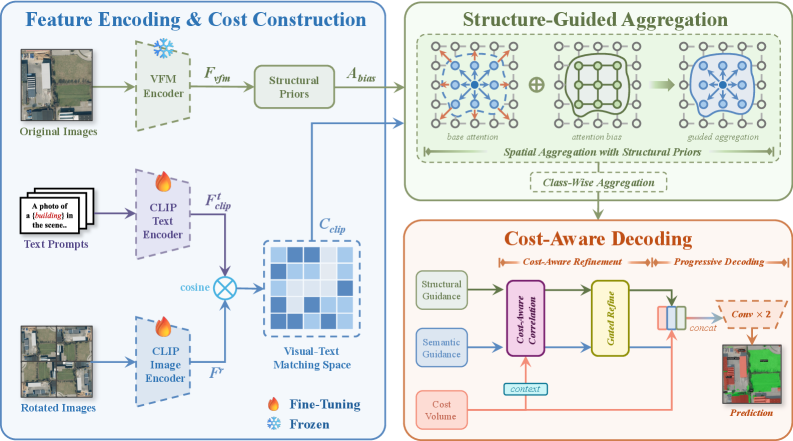
GeoSeg-OV’s trick is to separate meaning from shape.
CLIP, a vision-language model, handles the semantic question: does this part of the image resemble the requested category? A second, frozen vision foundation model supplies structural guidance—boundaries, spatial relationships and object shapes—without interfering with that visual-language matching process. The system also examines rotated versions of the imagery because, unlike photographs of cats, satellite images do not come with a universally correct “up.”
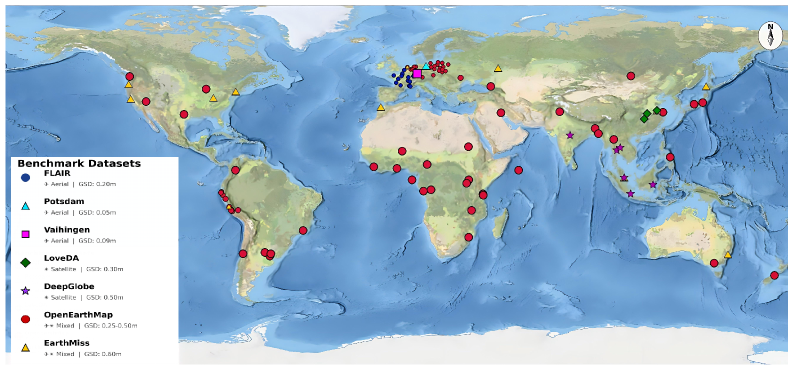
The researchers tested the approach using a new High-Resolution Land Cover benchmark covering seven datasets, more than 90 cities, six continents and imagery with ground resolutions from 5 to 60 centimeters.
According to the GeoSeg-OV preprint, the method improved average mean intersection-over-union by 2.5 and 2.7 percentage points over the strongest previous trainable approaches under two training configurations. It ranked first on five of six external datasets when trained on FLAIR and all six when trained on OpenEarthMap.
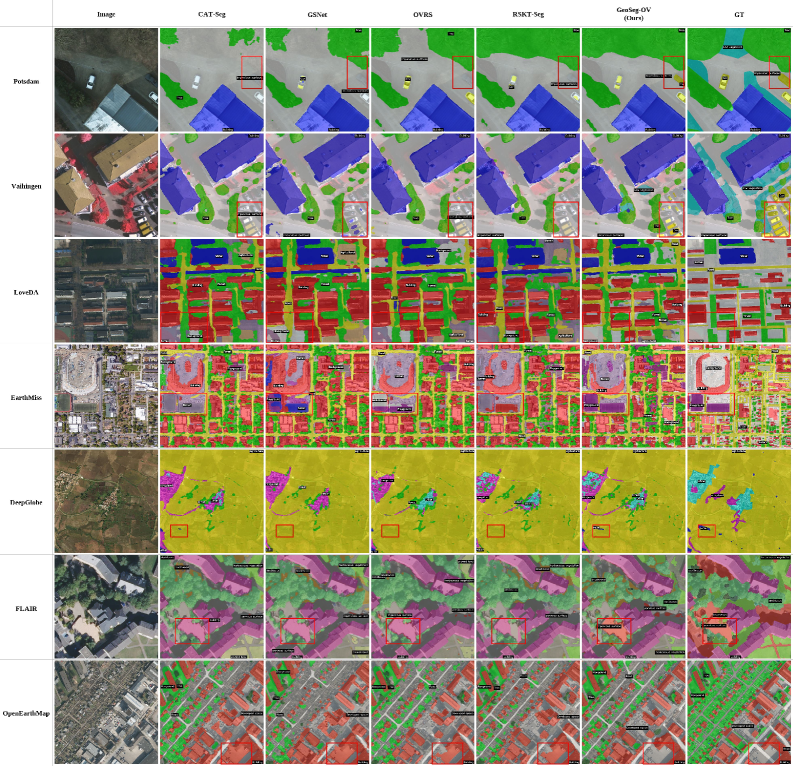
The largest improvements appeared where the geographic or resolution shift was most severe. That matters: a model that performs brilliantly only on imagery resembling its training set is an impressive laboratory experiment, but not yet a global mapping tool.
There are caveats. GeoSeg-OV is a preprint and has not yet passed peer review or independent replication. It is also not computationally weightless. The full configuration used 13.4 GB of GPU memory and took 0.31 seconds per inference iteration on an NVIDIA RTX 4090—slower than several comparison models.
Still, the direction is compelling. Fixed-category classifiers answer questions chosen when the model was trained. Open-vocabulary systems promise to answer questions chosen when the map is needed.
That is a subtle shift, but potentially a huge one. The future GeoAI interface might not begin with “select a classification model.” It may simply ask: What do you want to map today?
The authors have released the code and benchmark on GitHub.
How do you like this piece focused on GeoAI? Read more and subscribe to our monthly newsletter!



#GeoAI



Next article
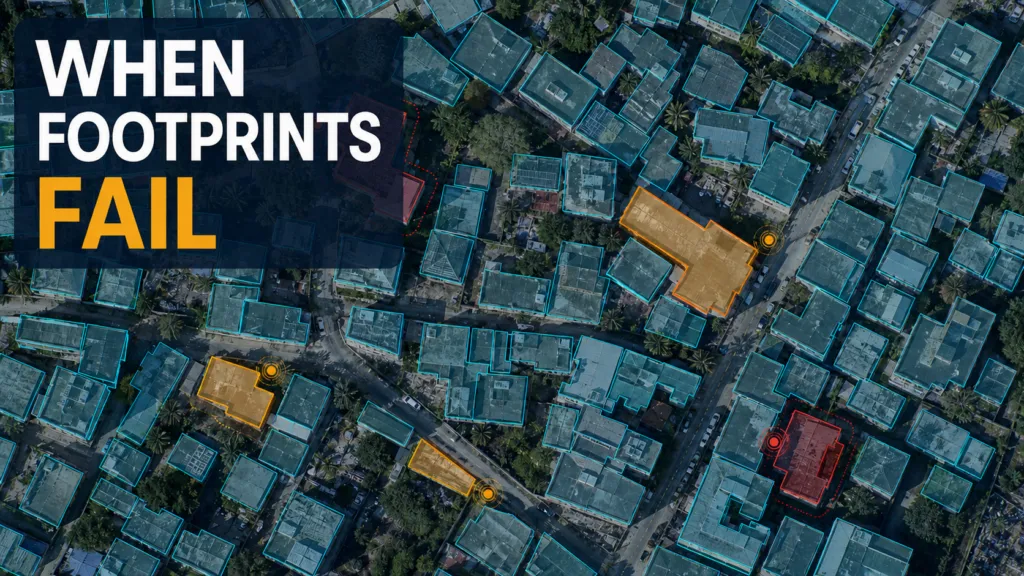
Building extraction is one of GeoAI’s most established use cases, but high segmentation accuracy does not guarantee usable vector data. Once raster masks are converted to polygons, production teams still encounter merged buildings, fragments, distorted boundaries and false positives that cannot be accepted into authoritative databases without review.
A new study addresses this post-segmentation stage. Rather than proposing another extraction network, the researchers developed a quality-control layer that evaluates individual footprint polygons and identifies those likely to require removal or manual inspection.
Testing the full raster-to-vector workflow
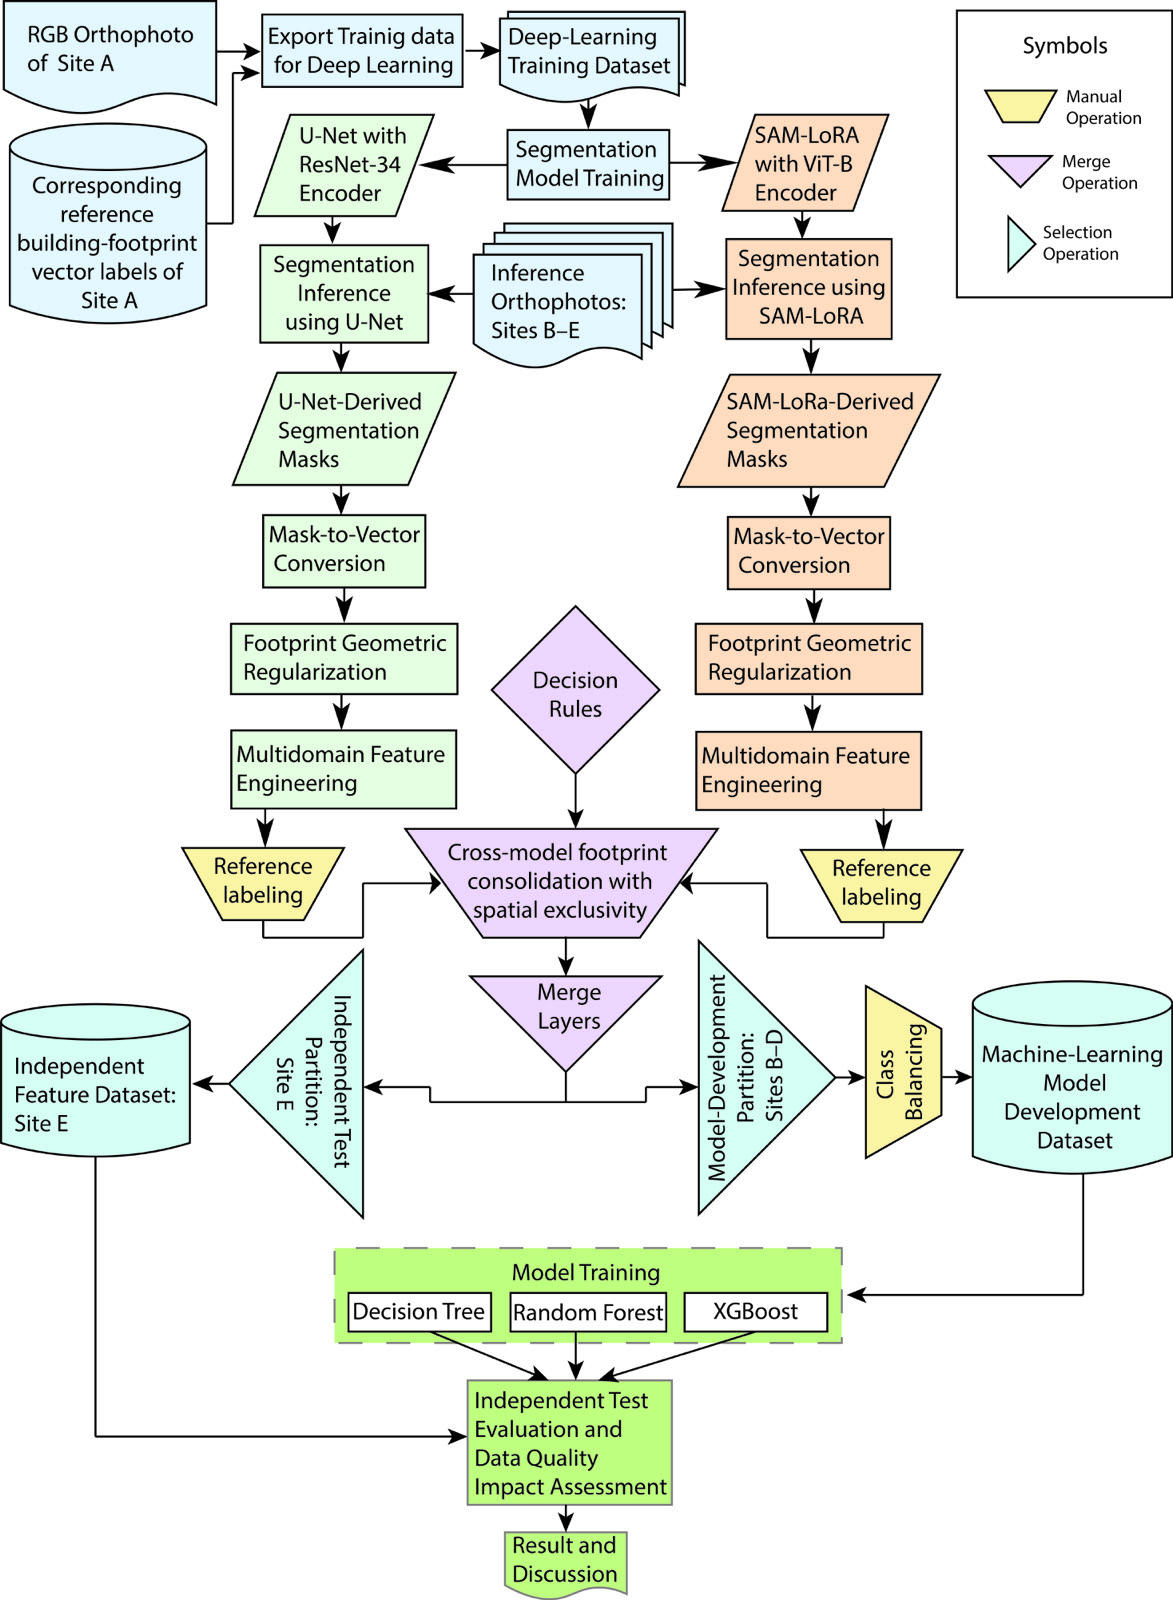
The research used 15 cm RGB orthophotos from five UAV survey sites in Bangladesh’s Dhaka Division. Candidate footprints were generated with two different architectures: U-Net with a ResNet-34 backbone and a LoRA-adapted Segment Anything model.
The masks were vectorized, geometrically regularized and consolidated to remove competing representations of the same building. This resembles a practical GIS workflow more closely than evaluating pixel-level segmentation alone. Esri’s own building-extraction example notes that detected polygons require post-processing to eliminate geometric artifacts.
Regularization improves cartographic form, but it does not determine whether a polygon represents the correct building. The researchers therefore described every candidate using 24 variables drawn from three domains.
Geometric variables captured properties such as compactness, elongation and boundary complexity. Spatial-context variables measured local density, nearest-neighbor relationships, orientation consistency and whether a building’s area appeared unusual relative to its surroundings. Raster variables described color, brightness and texture within the footprint.
Human reviewers labeled the resulting objects as acceptable or erroneous. Data from three sites supported model development, while a fourth site containing 4,162 objects was held out as a spatially independent test set.
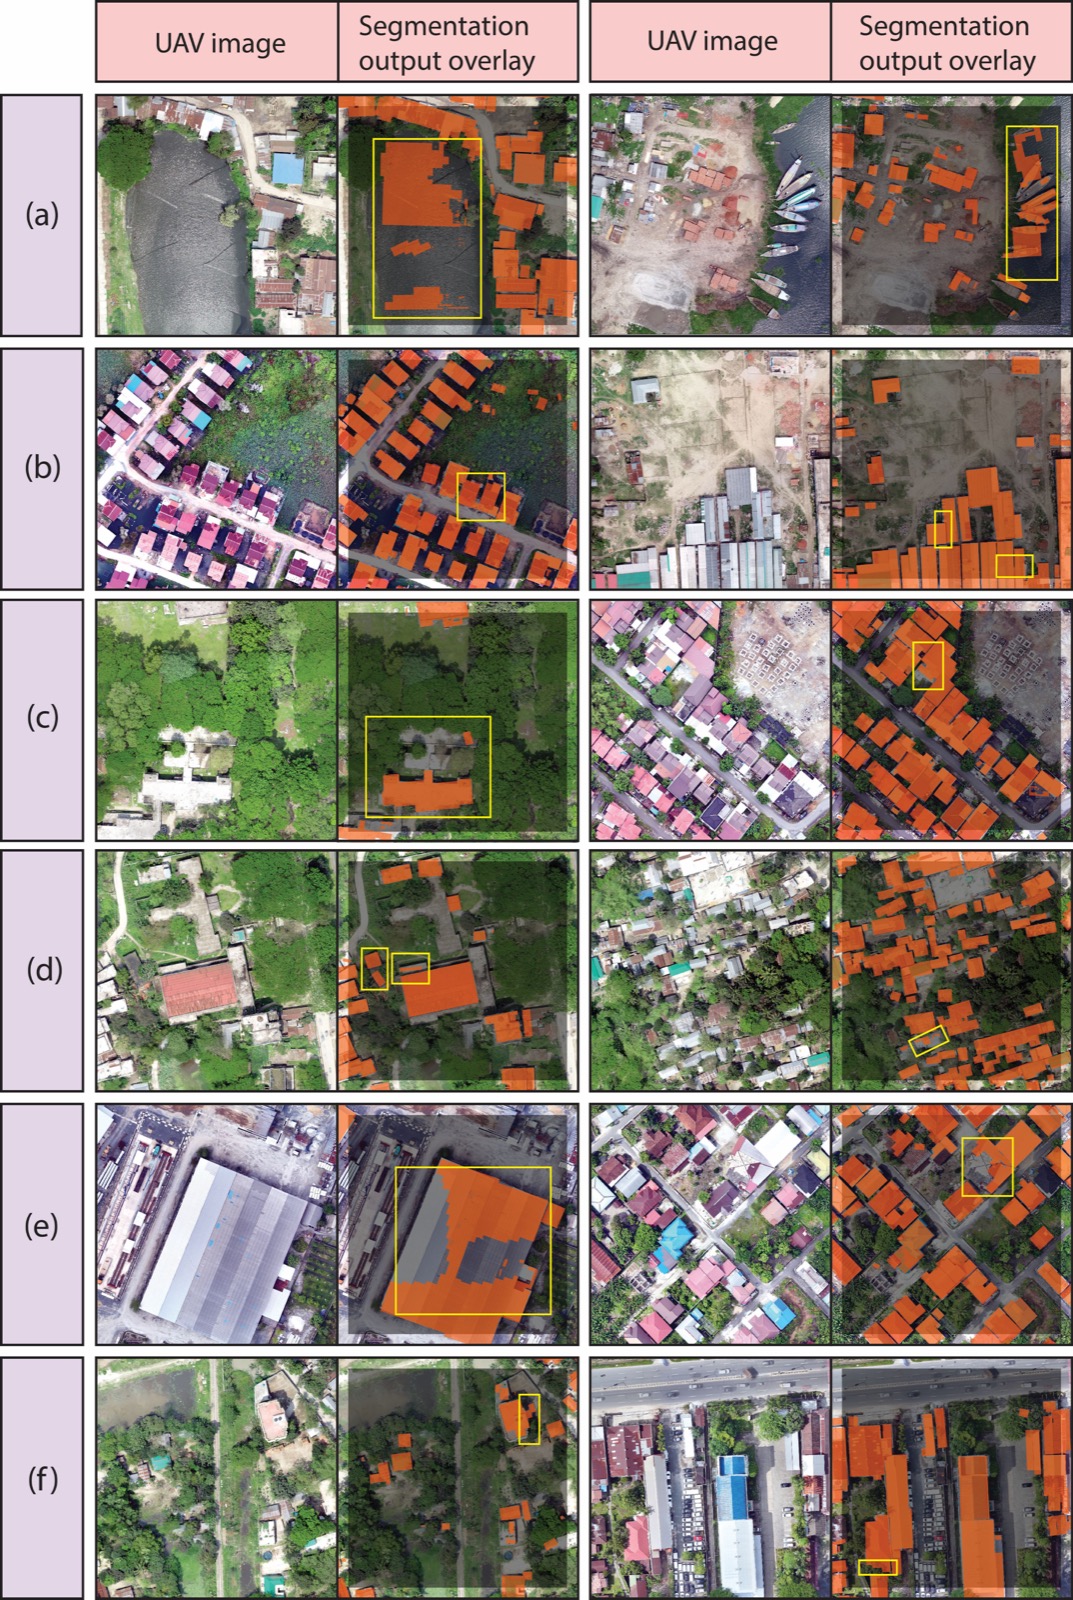
Geometry and context carried the strongest signal
The best-performing configuration was a decision tree using geometric and spatial-context variables. On the held-out site, it achieved 95.31% accuracy, an F1 score of 91.06% and a Matthews correlation coefficient of 0.880.
At database level, the model identified 87.34% of erroneous footprints while retaining 98.31% of acceptable ones. The reported proportion of errors in the retained dataset fell from 27.32% to 4.62%.
Adding all raster-derived variables did not improve the best result. Direct evidence from polygon form and neighborhood structure was more useful for detecting boundary problems than the most feature-rich combination.
This is an important result for production GeoAI. A footprint’s quality is not only an image-classification problem. It is also a spatial-data problem involving topology, geometry and consistency with surrounding settlement patterns.
What the results do not establish
The independent test site strengthens the evaluation, but all five sites are located in one region. Transfer to different sensors, roof materials, building conventions and urban morphologies remains unproven. A quality model used nationally or globally would require broader geographic validation.
The workflow also depends on manually classified footprint examples. It can reduce the volume of objects requiring inspection, but it does not remove human judgment from the process.
Nor does it solve omission errors. The classifier evaluates candidate polygons that already exist. A building missed by both extraction models will not be recovered by screening their outputs.
These limitations point toward a realistic division of labor. Extraction models can create candidate data at scale. A second model can prioritize suspicious objects. GIS professionals can then concentrate on omissions, ambiguous cases and acceptance standards rather than checking every polygon equally.
As GeoAI moves into cadastral mapping, urban planning and infrastructure databases, this distinction will matter increasingly. The relevant benchmark is not how convincing the initial segmentation looks. It is how much reliable, auditable vector data reaches the database—and how efficiently the remaining uncertainty is handled.
How do you like this article? Read more and subscribe to our monthly newsletter!