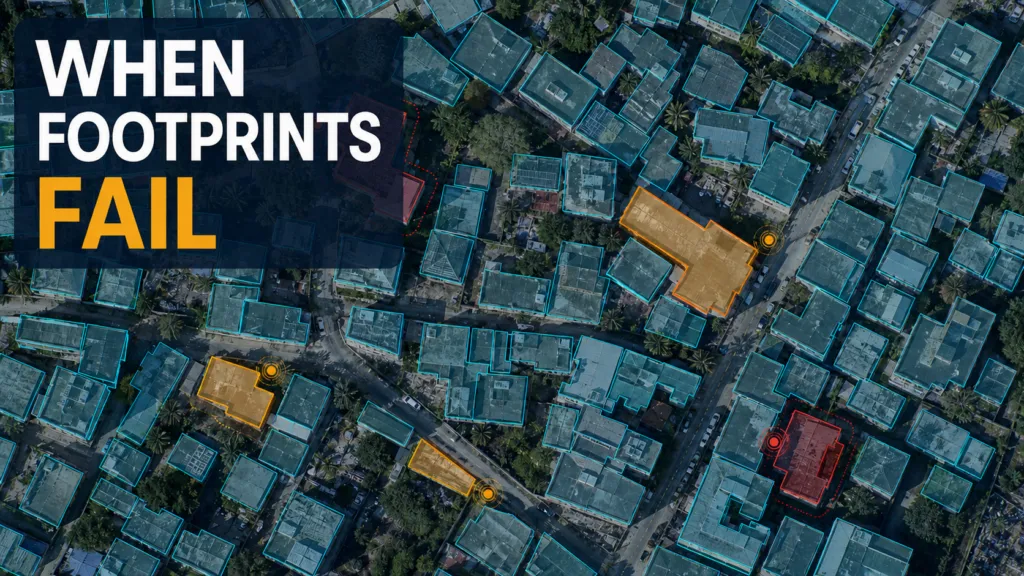

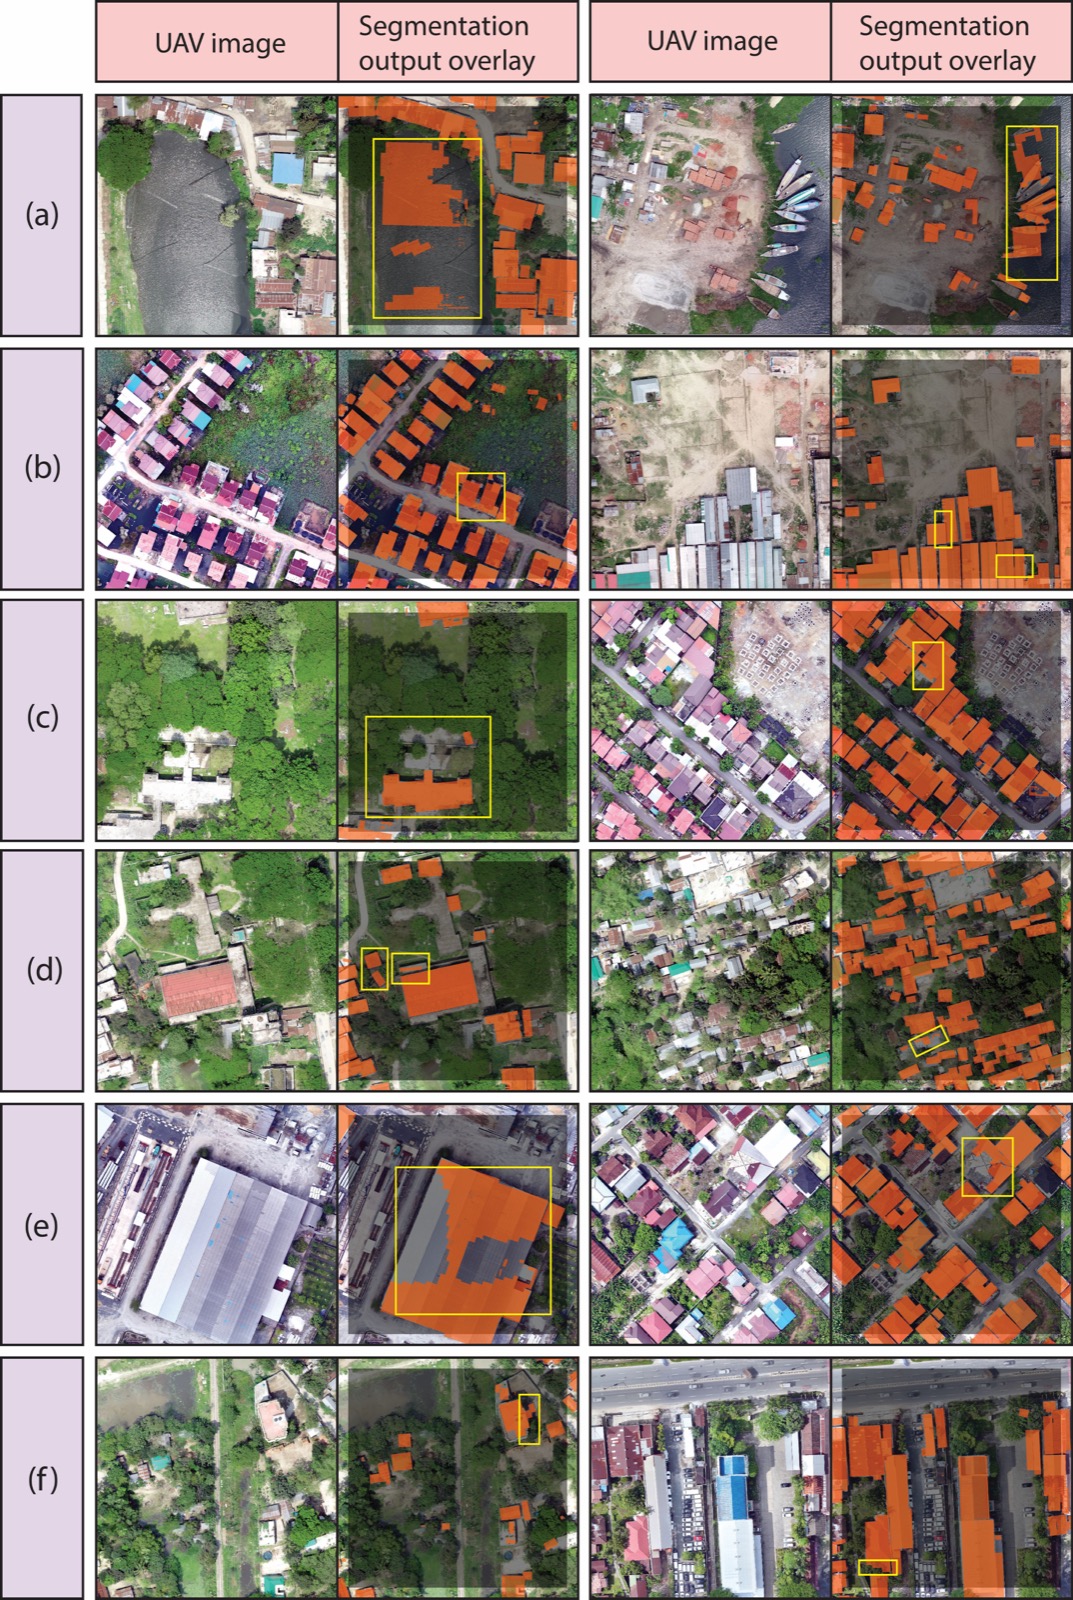
Building extraction is one of GeoAI’s most established use cases, but high segmentation accuracy does not guarantee usable vector data. Once raster masks are converted to polygons, production teams still encounter merged buildings, fragments, distorted boundaries and false positives that cannot be accepted into authoritative databases without review.
A new study addresses this post-segmentation stage. Rather than proposing another extraction network, the researchers developed a quality-control layer that evaluates individual footprint polygons and identifies those likely to require removal or manual inspection.
Testing the full raster-to-vector workflow
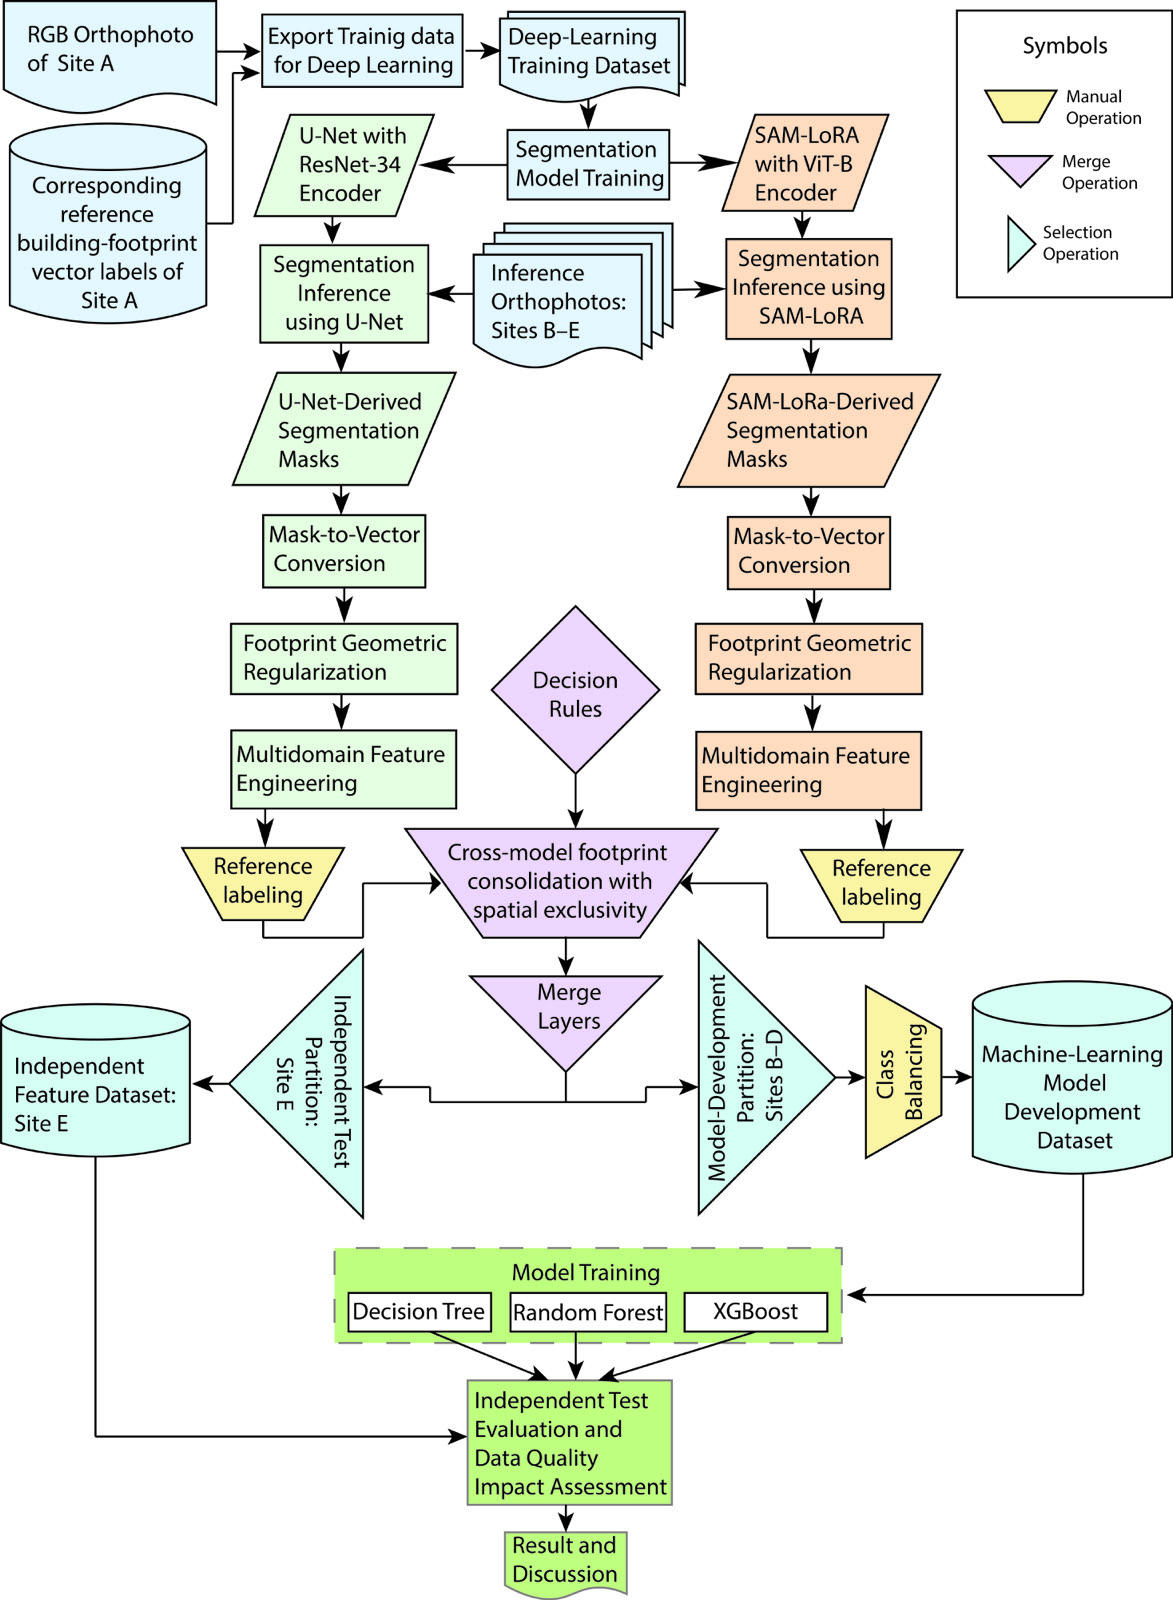
The research used 15 cm RGB orthophotos from five UAV survey sites in Bangladesh’s Dhaka Division. Candidate footprints were generated with two different architectures: U-Net with a ResNet-34 backbone and a LoRA-adapted Segment Anything model.
The masks were vectorized, geometrically regularized and consolidated to remove competing representations of the same building. This resembles a practical GIS workflow more closely than evaluating pixel-level segmentation alone. Esri’s own building-extraction example notes that detected polygons require post-processing to eliminate geometric artifacts.
Regularization improves cartographic form, but it does not determine whether a polygon represents the correct building. The researchers therefore described every candidate using 24 variables drawn from three domains.
Geometric variables captured properties such as compactness, elongation and boundary complexity. Spatial-context variables measured local density, nearest-neighbor relationships, orientation consistency and whether a building’s area appeared unusual relative to its surroundings. Raster variables described color, brightness and texture within the footprint.
Human reviewers labeled the resulting objects as acceptable or erroneous. Data from three sites supported model development, while a fourth site containing 4,162 objects was held out as a spatially independent test set.
Geometry and context carried the strongest signal
The best-performing configuration was a decision tree using geometric and spatial-context variables. On the held-out site, it achieved 95.31% accuracy, an F1 score of 91.06% and a Matthews correlation coefficient of 0.880.
At database level, the model identified 87.34% of erroneous footprints while retaining 98.31% of acceptable ones. The reported proportion of errors in the retained dataset fell from 27.32% to 4.62%.
Adding all raster-derived variables did not improve the best result. Direct evidence from polygon form and neighborhood structure was more useful for detecting boundary problems than the most feature-rich combination.
This is an important result for production GeoAI. A footprint’s quality is not only an image-classification problem. It is also a spatial-data problem involving topology, geometry and consistency with surrounding settlement patterns.
What the results do not establish
The independent test site strengthens the evaluation, but all five sites are located in one region. Transfer to different sensors, roof materials, building conventions and urban morphologies remains unproven. A quality model used nationally or globally would require broader geographic validation.
The workflow also depends on manually classified footprint examples. It can reduce the volume of objects requiring inspection, but it does not remove human judgment from the process.
Nor does it solve omission errors. The classifier evaluates candidate polygons that already exist. A building missed by both extraction models will not be recovered by screening their outputs.
These limitations point toward a realistic division of labor. Extraction models can create candidate data at scale. A second model can prioritize suspicious objects. GIS professionals can then concentrate on omissions, ambiguous cases and acceptance standards rather than checking every polygon equally.
As GeoAI moves into cadastral mapping, urban planning and infrastructure databases, this distinction will matter increasingly. The relevant benchmark is not how convincing the initial segmentation looks. It is how much reliable, auditable vector data reaches the database—and how efficiently the remaining uncertainty is handled.
How do you like this article? Read more and subscribe to our monthly newsletter!


#GeoAI

Next article
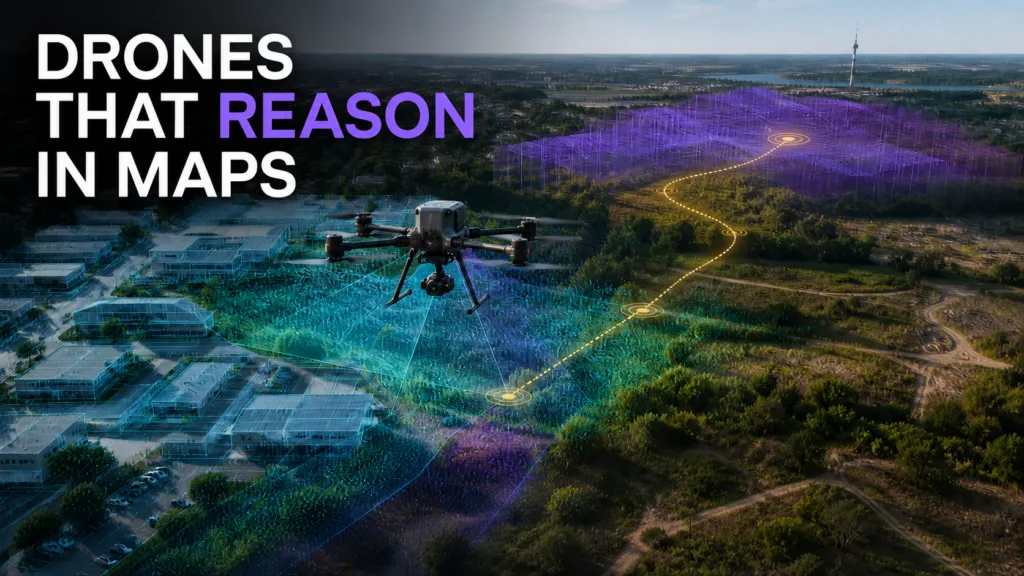
Vision-language navigation allows an autonomous system to interpret an instruction, relate it to camera observations and move toward a destination. For UAVs, the task is complicated by sparse viewpoints, three-dimensional movement and routes that extend beyond the immediately visible scene.
Many recent systems use language models or multimodal models to predict actions directly from instructions and imagery. A new framework called AirForesight takes a more explicitly spatial approach. It creates an internal representation of the current environment, reasons about a possible future spatial state and uses both to select the next 3D waypoint.
The work is notable because it treats mapping as part of an agent’s reasoning process rather than only as an input dataset or final output.
Giving the navigation agent a spatial state
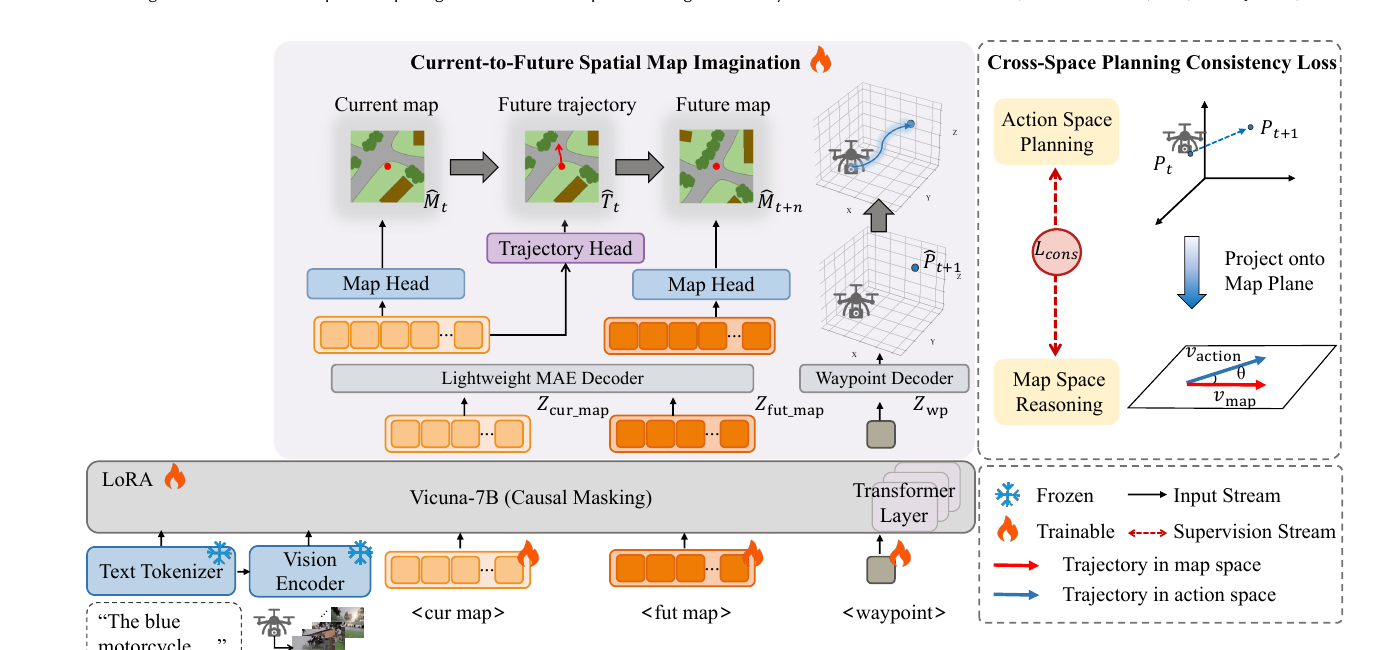
AirForesight begins with multiple visual observations around the UAV. These are organized into a structured current-map representation that encodes semantic and geometric relationships in the surrounding environment.
During training, the representation is supervised using both current-map reconstruction and future-trajectory prediction. A second stage propagates the current spatial knowledge into a representation of the anticipated future map. The two are then combined to predict the next waypoint.
The researchers also introduce a consistency objective that aligns the direction of the predicted map-space trajectory with the expert flight path. This is intended to prevent the spatial representation from becoming an auxiliary visualization with little influence on the action chosen by the agent.
Detailed map supervision is needed during training, but the operational model does not construct a complete dense map at every navigation step. That reduces the online processing burden compared with approaches that maintain a full explicit map during flight.
The framework was evaluated on OpenUAV and AerialVLN-S. The authors report improved navigation performance and stability relative to the selected baselines. The paper has been accepted by ACM Multimedia 2026. Earlier AerialVLN research established the broader task of instruction-guided UAV navigation in outdoor environments.
Why the mapping component matters
Direct action prediction can work well when instructions are short and relevant landmarks remain visible. Longer routes create a different requirement. The agent must preserve relationships between observations made at different moments and anticipate how movement will change the scene.
A structured spatial representation provides a common frame for those observations. It can connect a landmark described in the instruction with the agent’s current position and the direction of the intended route.
This has broader implications for agentic GeoAI. Spatial representations may function as working memory inside an autonomous system, supporting planning even when no conventional map is presented to the user. The map becomes an internal reasoning artifact.
Generalization remains the main challenge
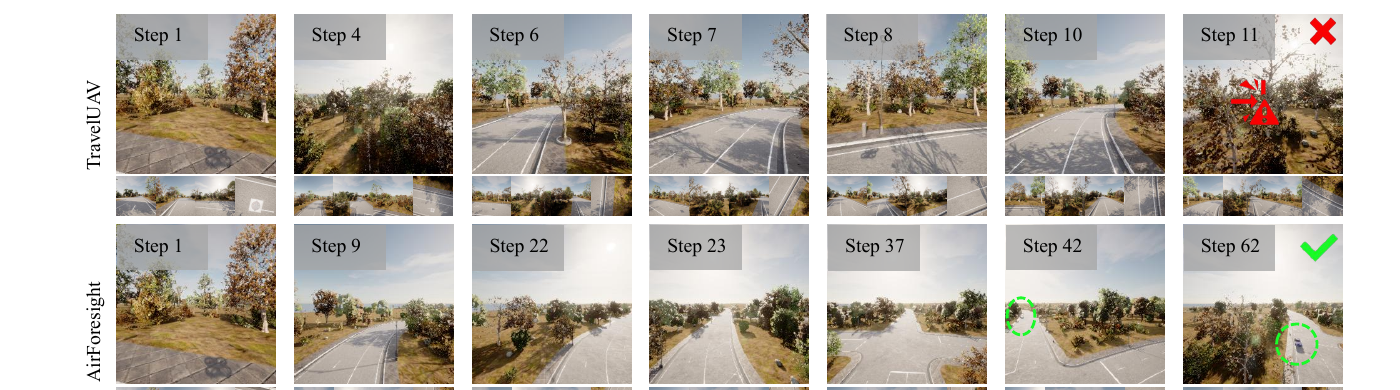
AirForesight’s results come from benchmark environments rather than operational flight trials. The authors also identify several important limitations.
Its training maps use automatically generated labels. Errors in object grounding, segmentation, depth estimation or projection can enter the spatial supervision. The maps are useful learning signals, but they are not exact reconstructions.
Part of the method estimates local trajectory direction using an approximation that is less reliable for sharp curves, sparse path masks or ambiguous geometry. Most importantly, performance still declines substantially on unseen maps and unfamiliar object categories.
The navigation policy also continues to use visual and language inputs alongside the learned spatial representations. The reported gains cannot be attributed to autonomous map reasoning alone.
These limitations define the next stage of evaluation: testing across genuinely unfamiliar geography, measuring sensitivity to incorrect spatial representations and exposing uncertainty when the internal map conflicts with current observations.
AirForesight does not yet show that a drone can reason reliably through an unknown real environment. It does offer evidence for a useful design principle: embodied AI benefits when spatial structure is represented explicitly rather than left for a general-purpose model to infer indirectly at every step.
How do you like this article? Read more and subscribe to our monthly newsletter!