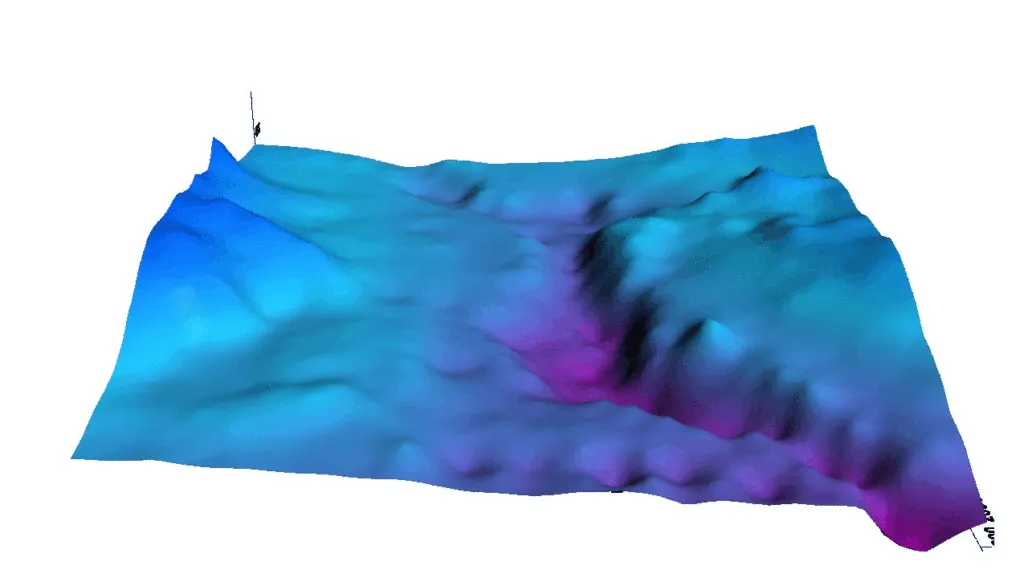
Imagine standing atop a hill, gazing across a landscape dotted with weather stations. Each station provides temperature data for its exact location, but what about the areas in between? How do we estimate the temperature at any given point across the entire landscape? This is where interpolation in GIS comes into play – a set of techniques that help us fill in the gaps between known data points.
In this article, we’ll explore what interpolation is, what it’s used for, and the types of data it can handle, while breaking down some of the most common methods in simple terms. Whether you’re a GIS professional, a student, or just a curious geospatial enthusiast, who wants to know how to create continuous surfaces from scattered data.
What is Interpolation in GIS?
Interpolation is a statistical method used to estimate unknown values between two or more known data points. In GIS, interpolation allows us to create continuous surfaces (like temperature, elevation, or pollution levels) from discrete samples collected at specific locations. Essentially, it’s a way of predicting values for all locations within an area based on the values at sampled points.
Why Do We Need Interpolation?
- Data Completeness: In many cases, it’s impractical or impossible to collect data for every point in an area. Interpolation helps fill in these gaps and overcomes the limitations of data collection by enabling analysis in areas with no direct measurements.
- Surface Creation: Interpolation enables the creation of continuous surfaces (raster layers) from point data, which is essential for analysis and visualization. This creation of detailed raster layers enhances visualization and spatial analysis capabilities.
- Decision Making: Interpolated surfaces can inform decisions in environmental management, urban planning, agriculture, and many fields. It also allows for predictions and trend analysis.
Cost Effectiveness: By bridging gaps and creating comprehensive spatial representations, interpolation reduces the need for extensive field sampling, while maximizing the value of existing data points.
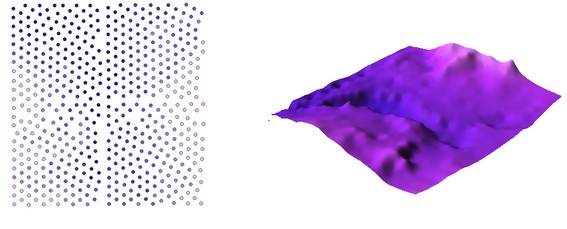
Turning Points into Surfaces
What Data Can Be Interpolated?
Interpolation is typically used with spatial data that varies continuously across a landscape. Common examples include:
- Elevation Data: Creating digital elevation models (DEMs) from contour lines or spot heights.
- Climate and Weather Data: Estimating temperature, precipitation (rainfall, snowfall), humidity, and wind speed and direction data across a region.
- Environmental Variables: Mapping soil properties (pH, texture, nutrient content, water quality parameters (dissolved oxygen, salinity), and air quality indices (particulate matter, ozone levels).
- Resource Distribution: Predicting the location of minerals, oil, or other resources.
Interpolation Methods Explained
There are many interpolation methods available in GIS, each with its own strengths and assumptions. Let’s explore some of the most commonly used techniques in simple terms.
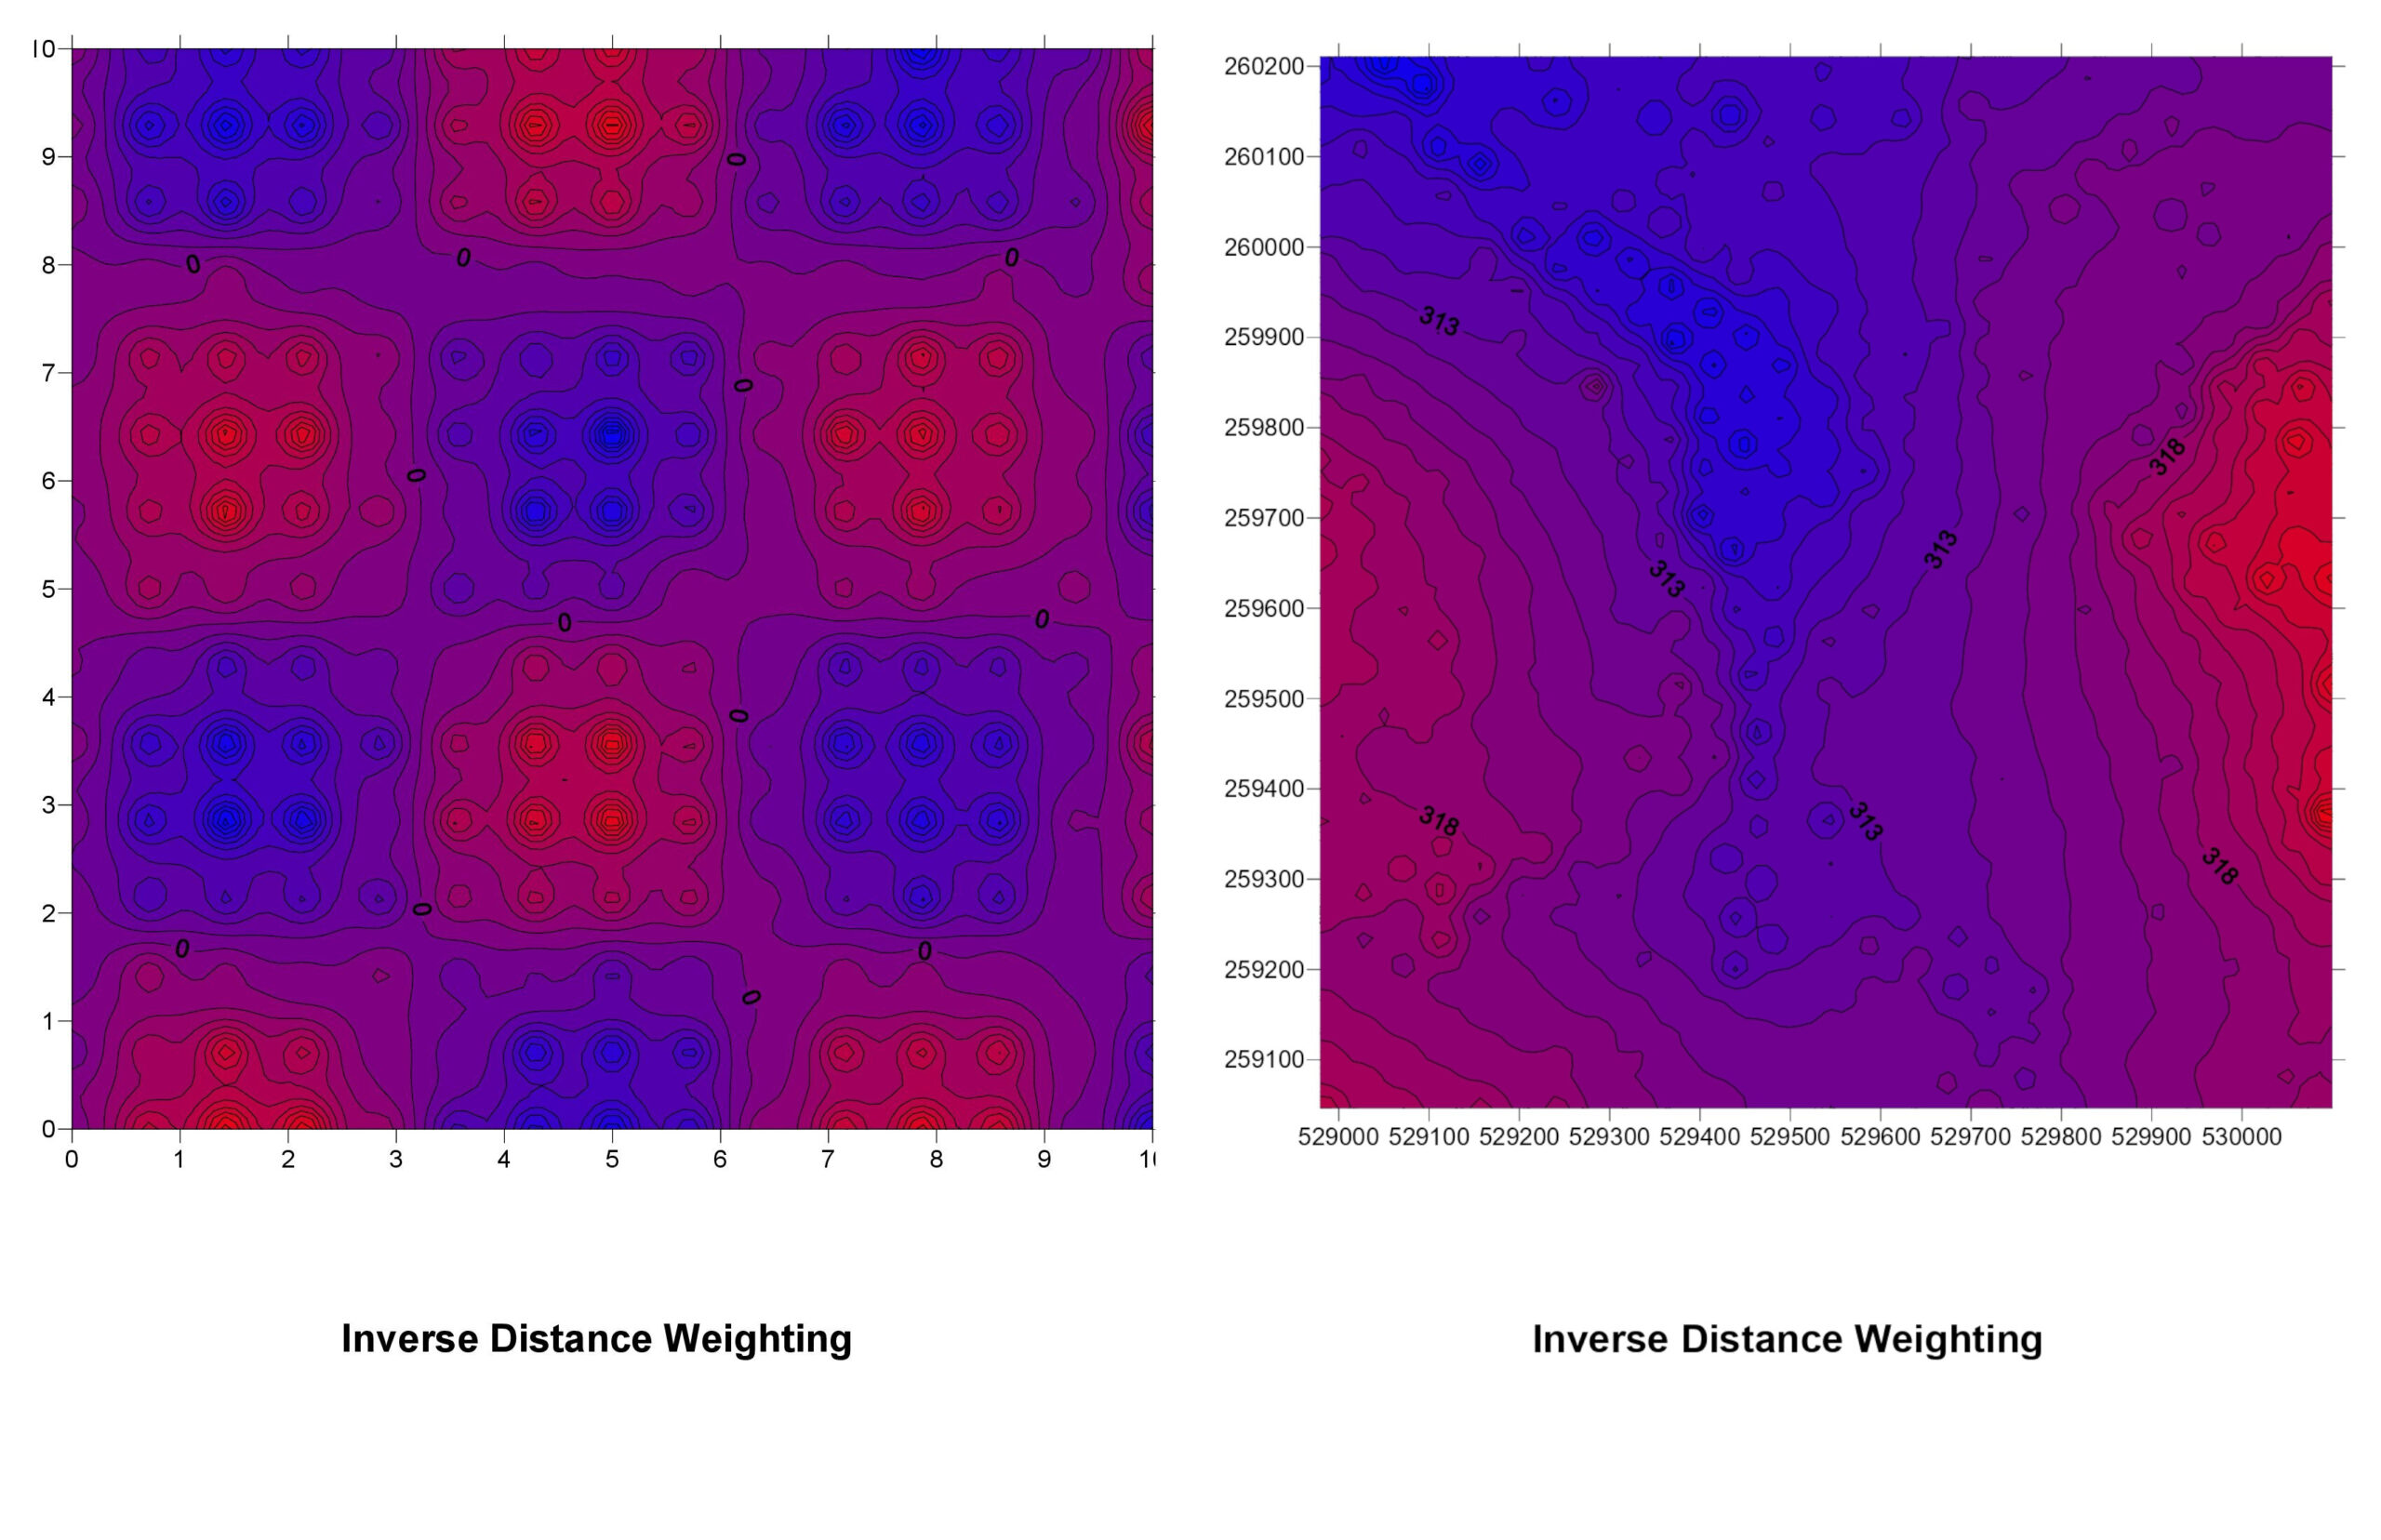
1. Inverse Distance Weighting (IDW)
How It Works: IDW assumes that the influence of a known data point diminishes with distance. In other words, points that are closer to the location being estimated have more influence than those farther away.
IDW Explained: Imagine you’re trying to guess the temperature at a specific spot. With IDW, you look at nearby weather stations and give more weight to those that are closer. If a station is just a mile away, its temperature reading is more relevant than a station 20 miles away.
Pros:
- Easy to understand and implement.
- Good for datasets where the influence of a point decreases uniformly with distance.
Cons:
- Doesn’t account for trends or patterns beyond distance.
- Can produce “bullseye” effects around data points.
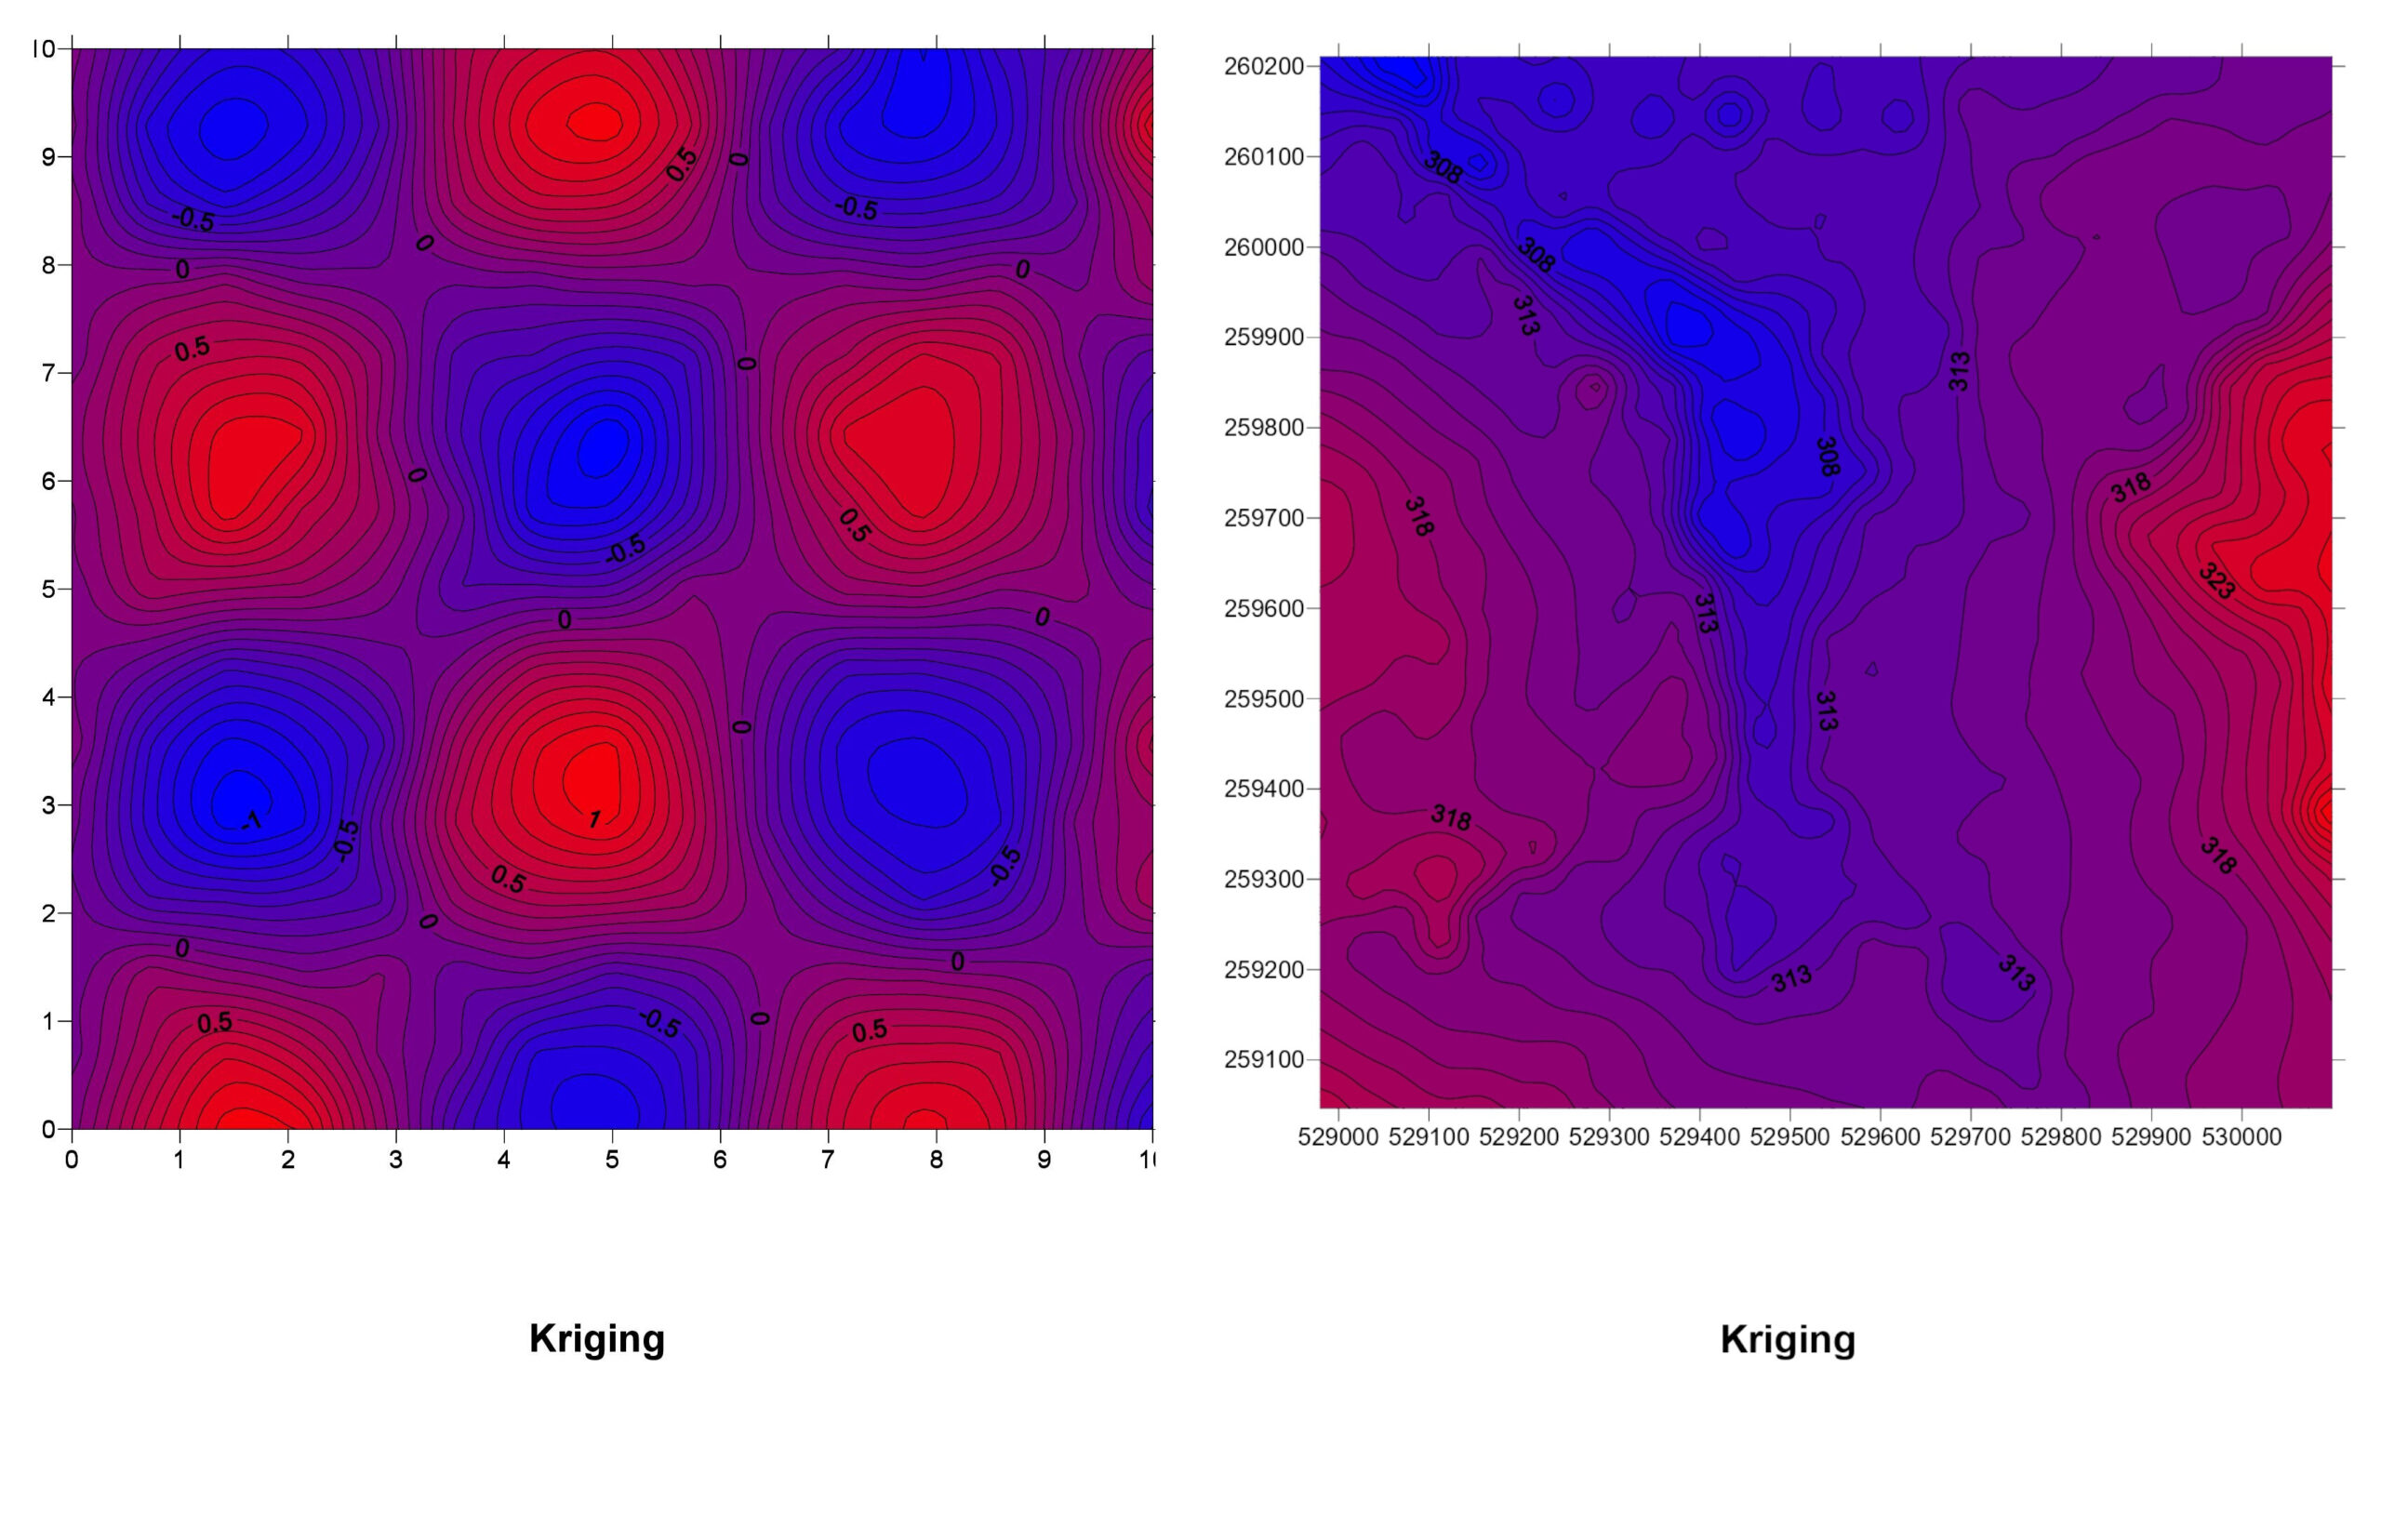
2. Kriging
How It Works: Kriging is a more advanced geostatistical method that not only considers the distance between points but also the overall spatial arrangement and trends in the data. It involves creating a variogram that models spatial correlation.
Kriging Explained: Think of Kriging as IDW’s smarter cousin. It doesn’t just look at how close other points are; it also considers how the values change over space. If there’s a trend (like increasing temperatures as you move south), Kriging takes that into account.
Pros:
- Provides statistically optimal predictions.
- Accounts for spatial trends and patterns.
- Offers measures of estimation uncertainty.
Cons:
- More complex and computationally intensive.
- Requires a good understanding of geostatistics to set up properly.
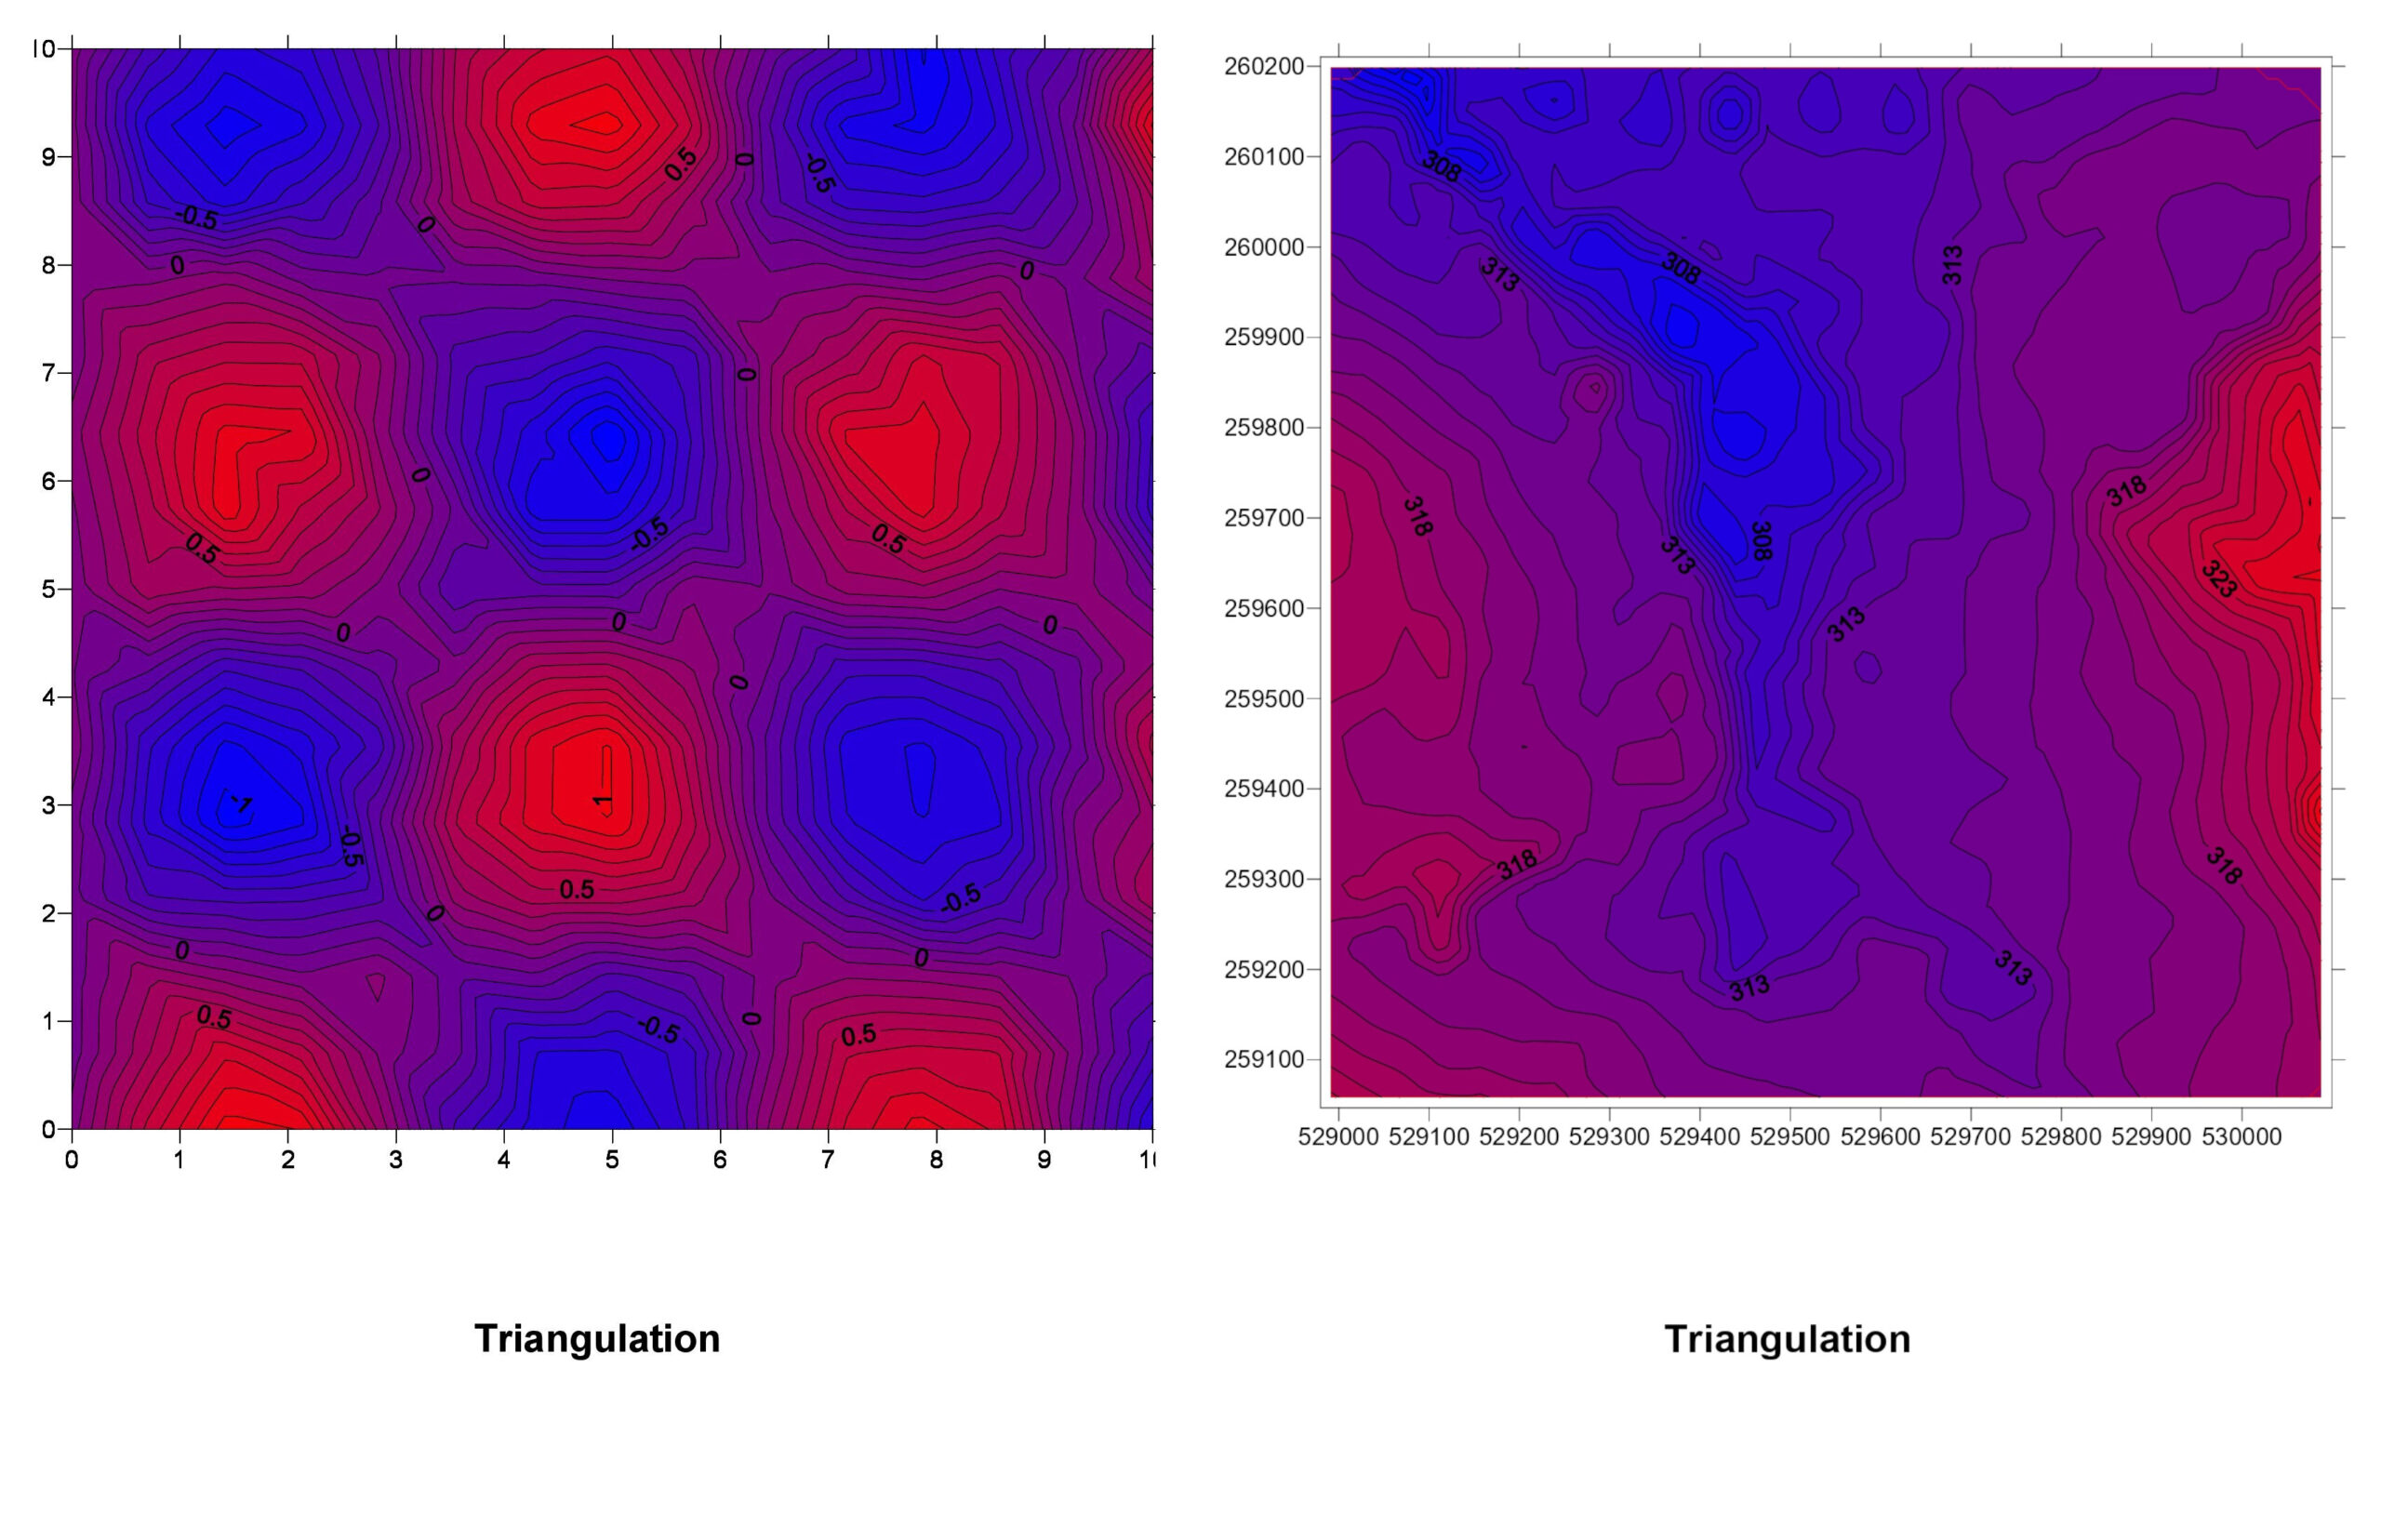
3. Triangulation (TIN – Triangulated Irregular Network)
How It Works: Triangulation divides the area into triangles based on the input points, creating a network. The value within each triangle is estimated based on the vertices.
TIN Explained: Picture connecting all your data points with lines to form a web of triangles. Within each triangle, the surface is estimated based on the three corners. It’s like stretching a sheet over pegs placed at each data point.
Pros:
- Good for modeling surfaces with abrupt changes, like cliffs.
- Preserves the exact values at the data points.
Cons:
- Can produce unrealistic surfaces if data points are unevenly distributed.
- Not ideal for smoothly varying surfaces.
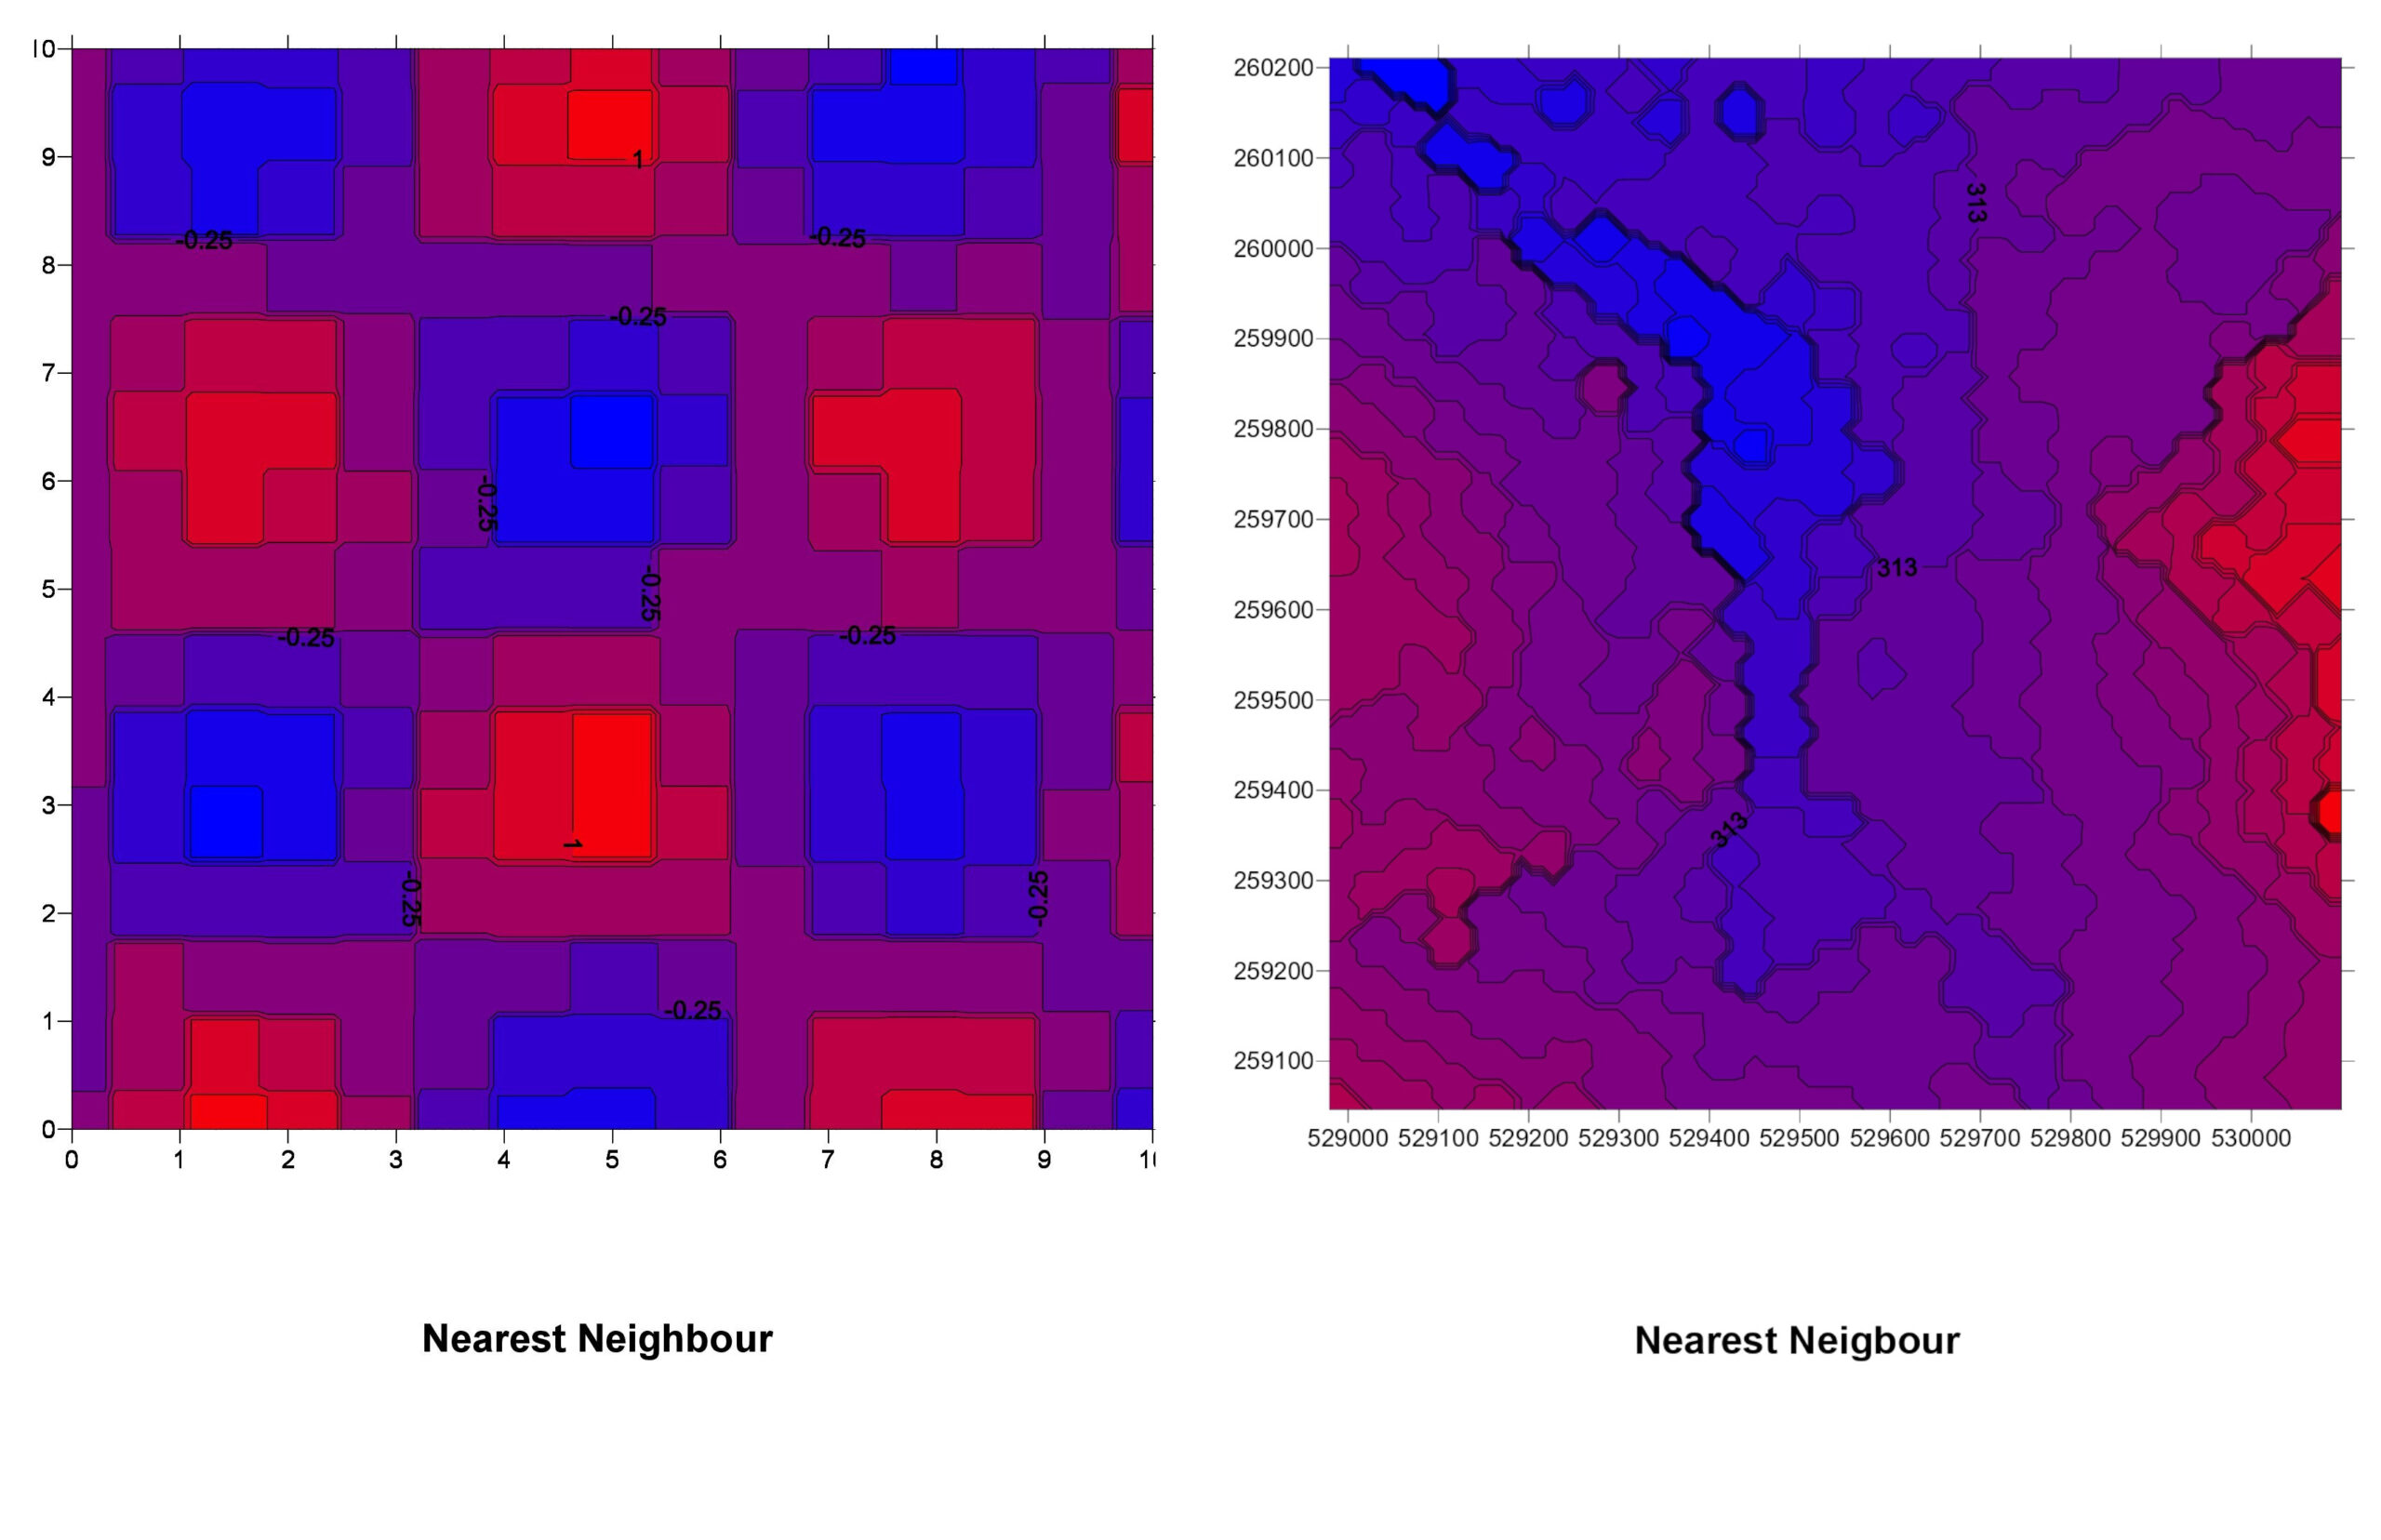
4. Nearest Neighbor
How It Works: This method assigns the value of the nearest known data point to each unknown location. It doesn’t interpolate but rather classifies areas based on proximity.
Nearest Neighbor Explained: For any location where you need an estimate, you find the closest known data point and use its value. It’s like saying, “The nearest weather station says it’s 20°C, so I’ll assume it’s 20°C here too.”
Pros:
- Simple and fast.
- Preserves the original data values.
Cons:
- Creates abrupt changes at the boundaries between areas.
- Not suitable for smoothly varying data.
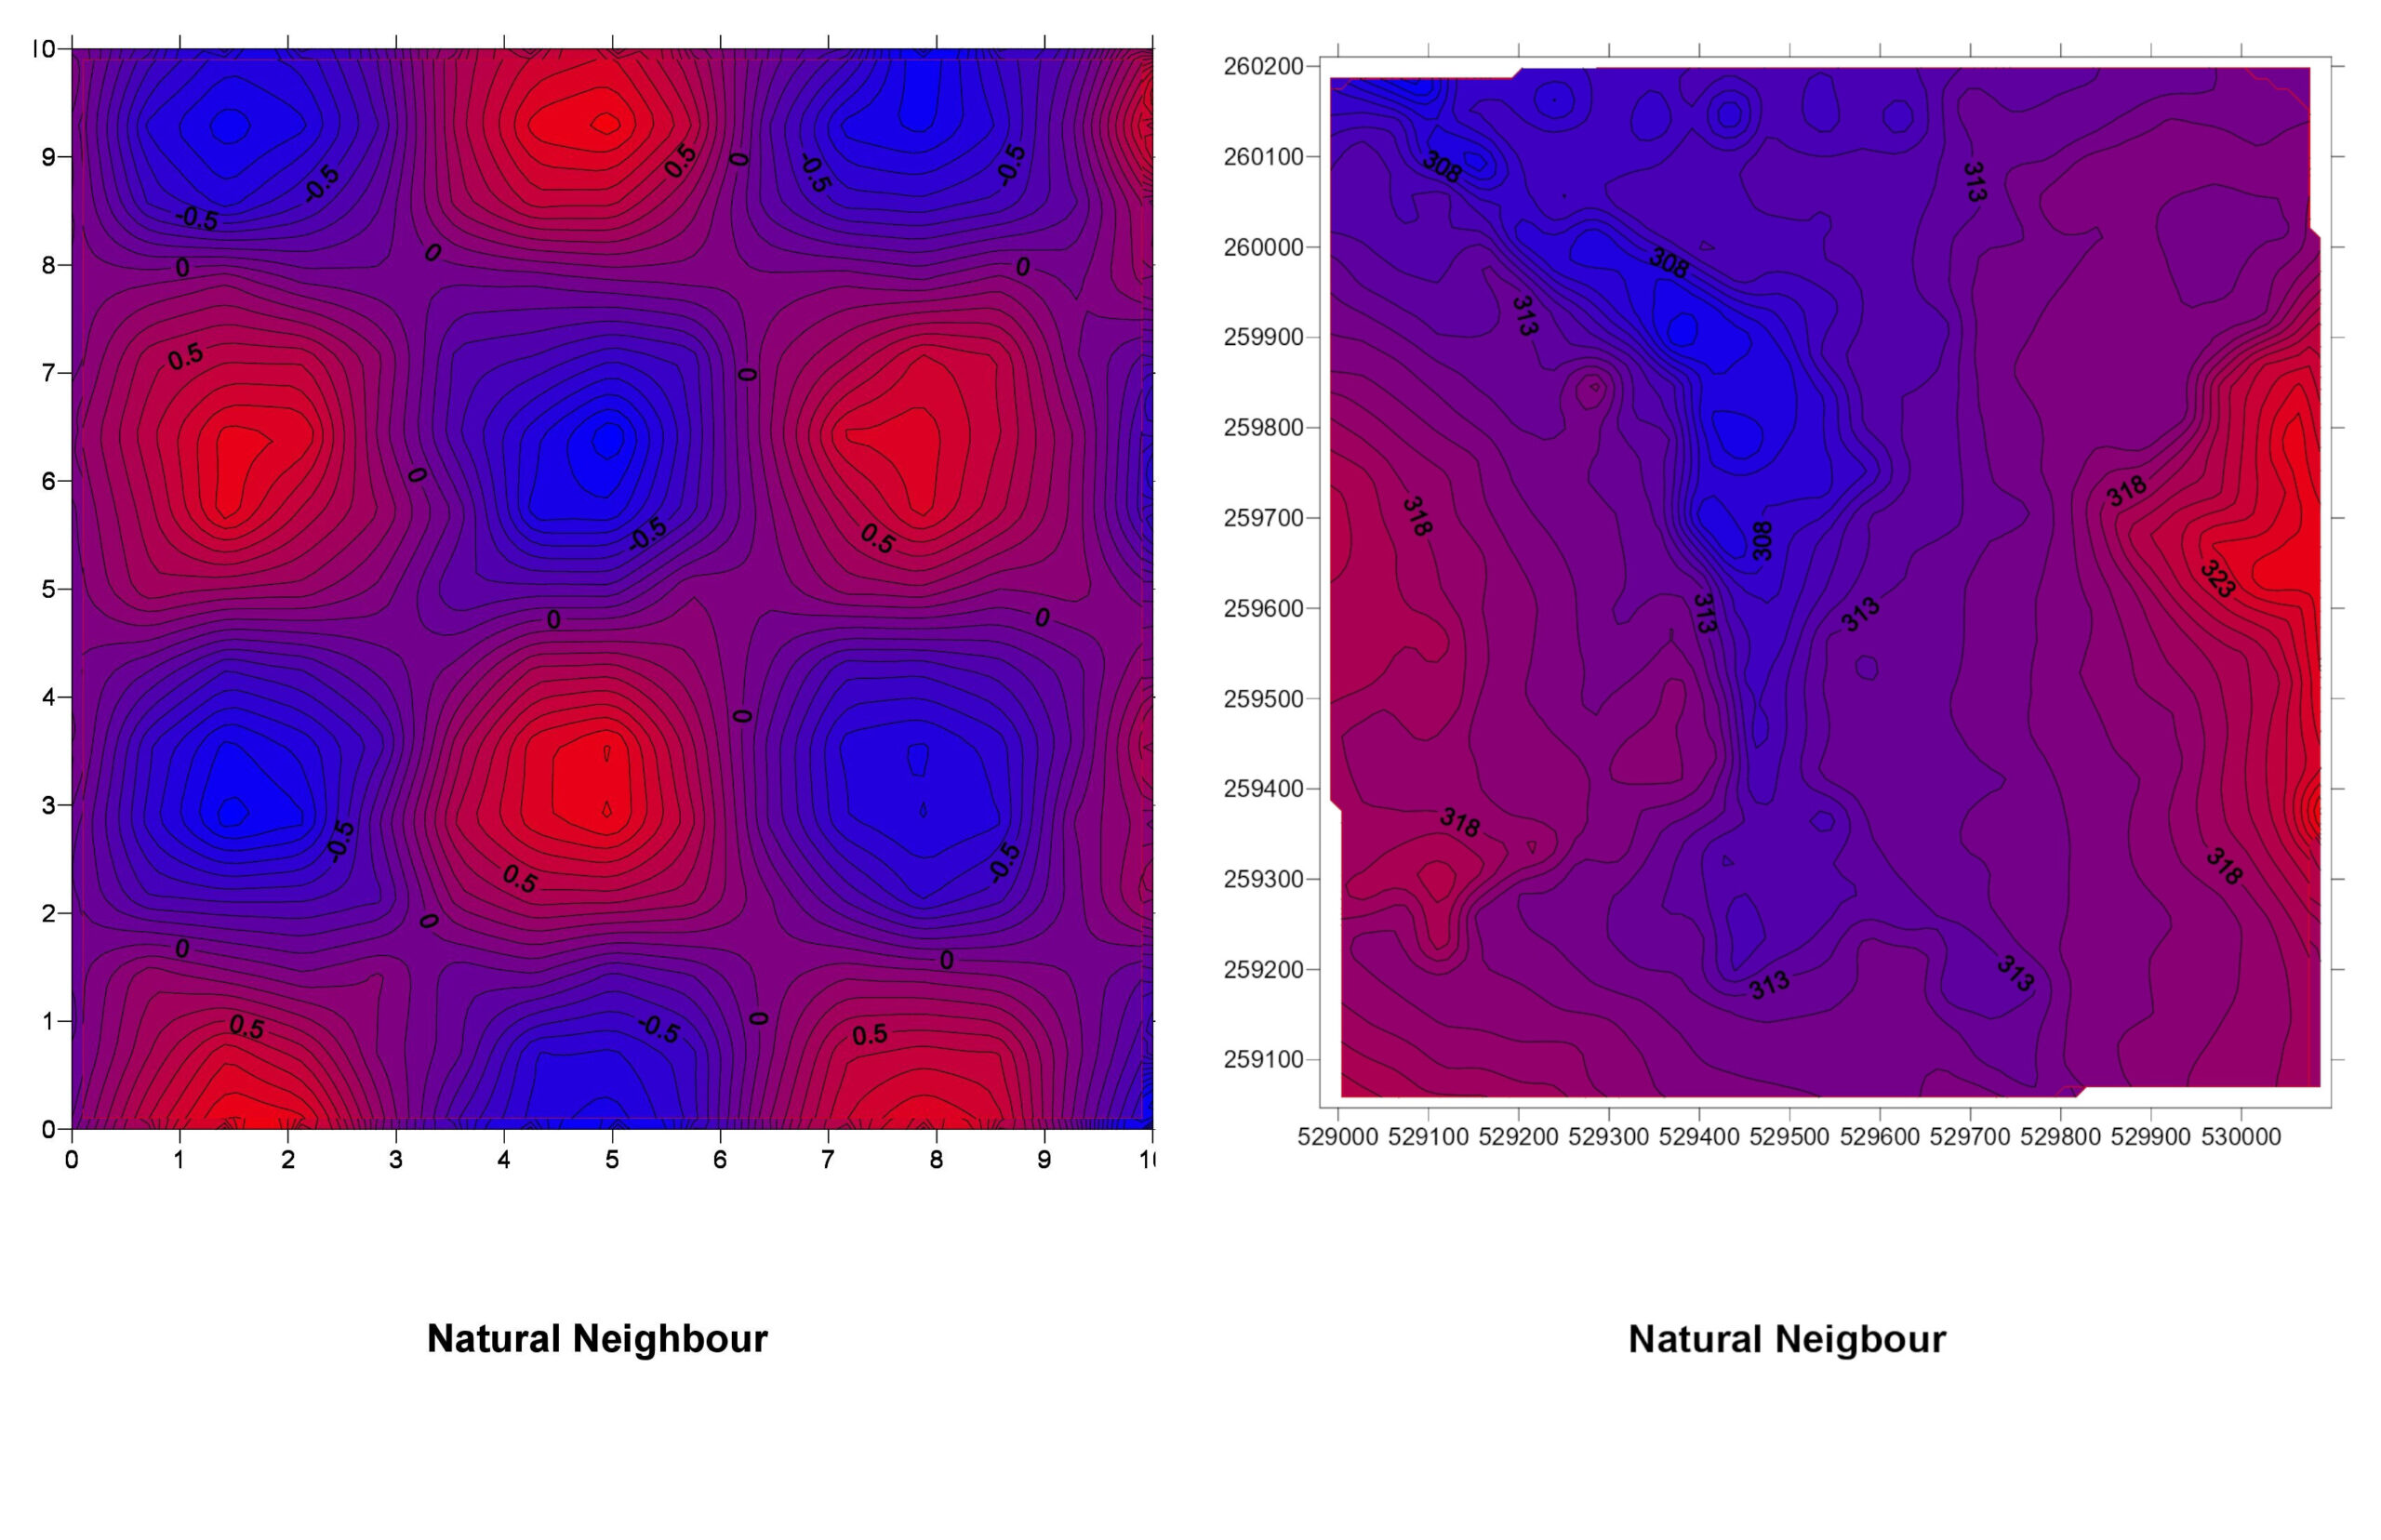
5. Natural Neighbor
How It Works: Natural Neighbor interpolation uses Voronoi tessellation (a way of dividing space) to determine weights based on proximity and area of influence.
Natural Neighbor Explained: Imagine each data point has its own territory. When estimating a value at a new location, you see how much of that location falls into the territories of surrounding points. Those with larger overlaps have more influence.
Pros:
- Produces smooth surfaces without abrupt changes.
- Adapts well to irregularly spaced data.
Cons:
- Computationally more intensive than simpler methods.
- Less intuitive than methods like IDW.
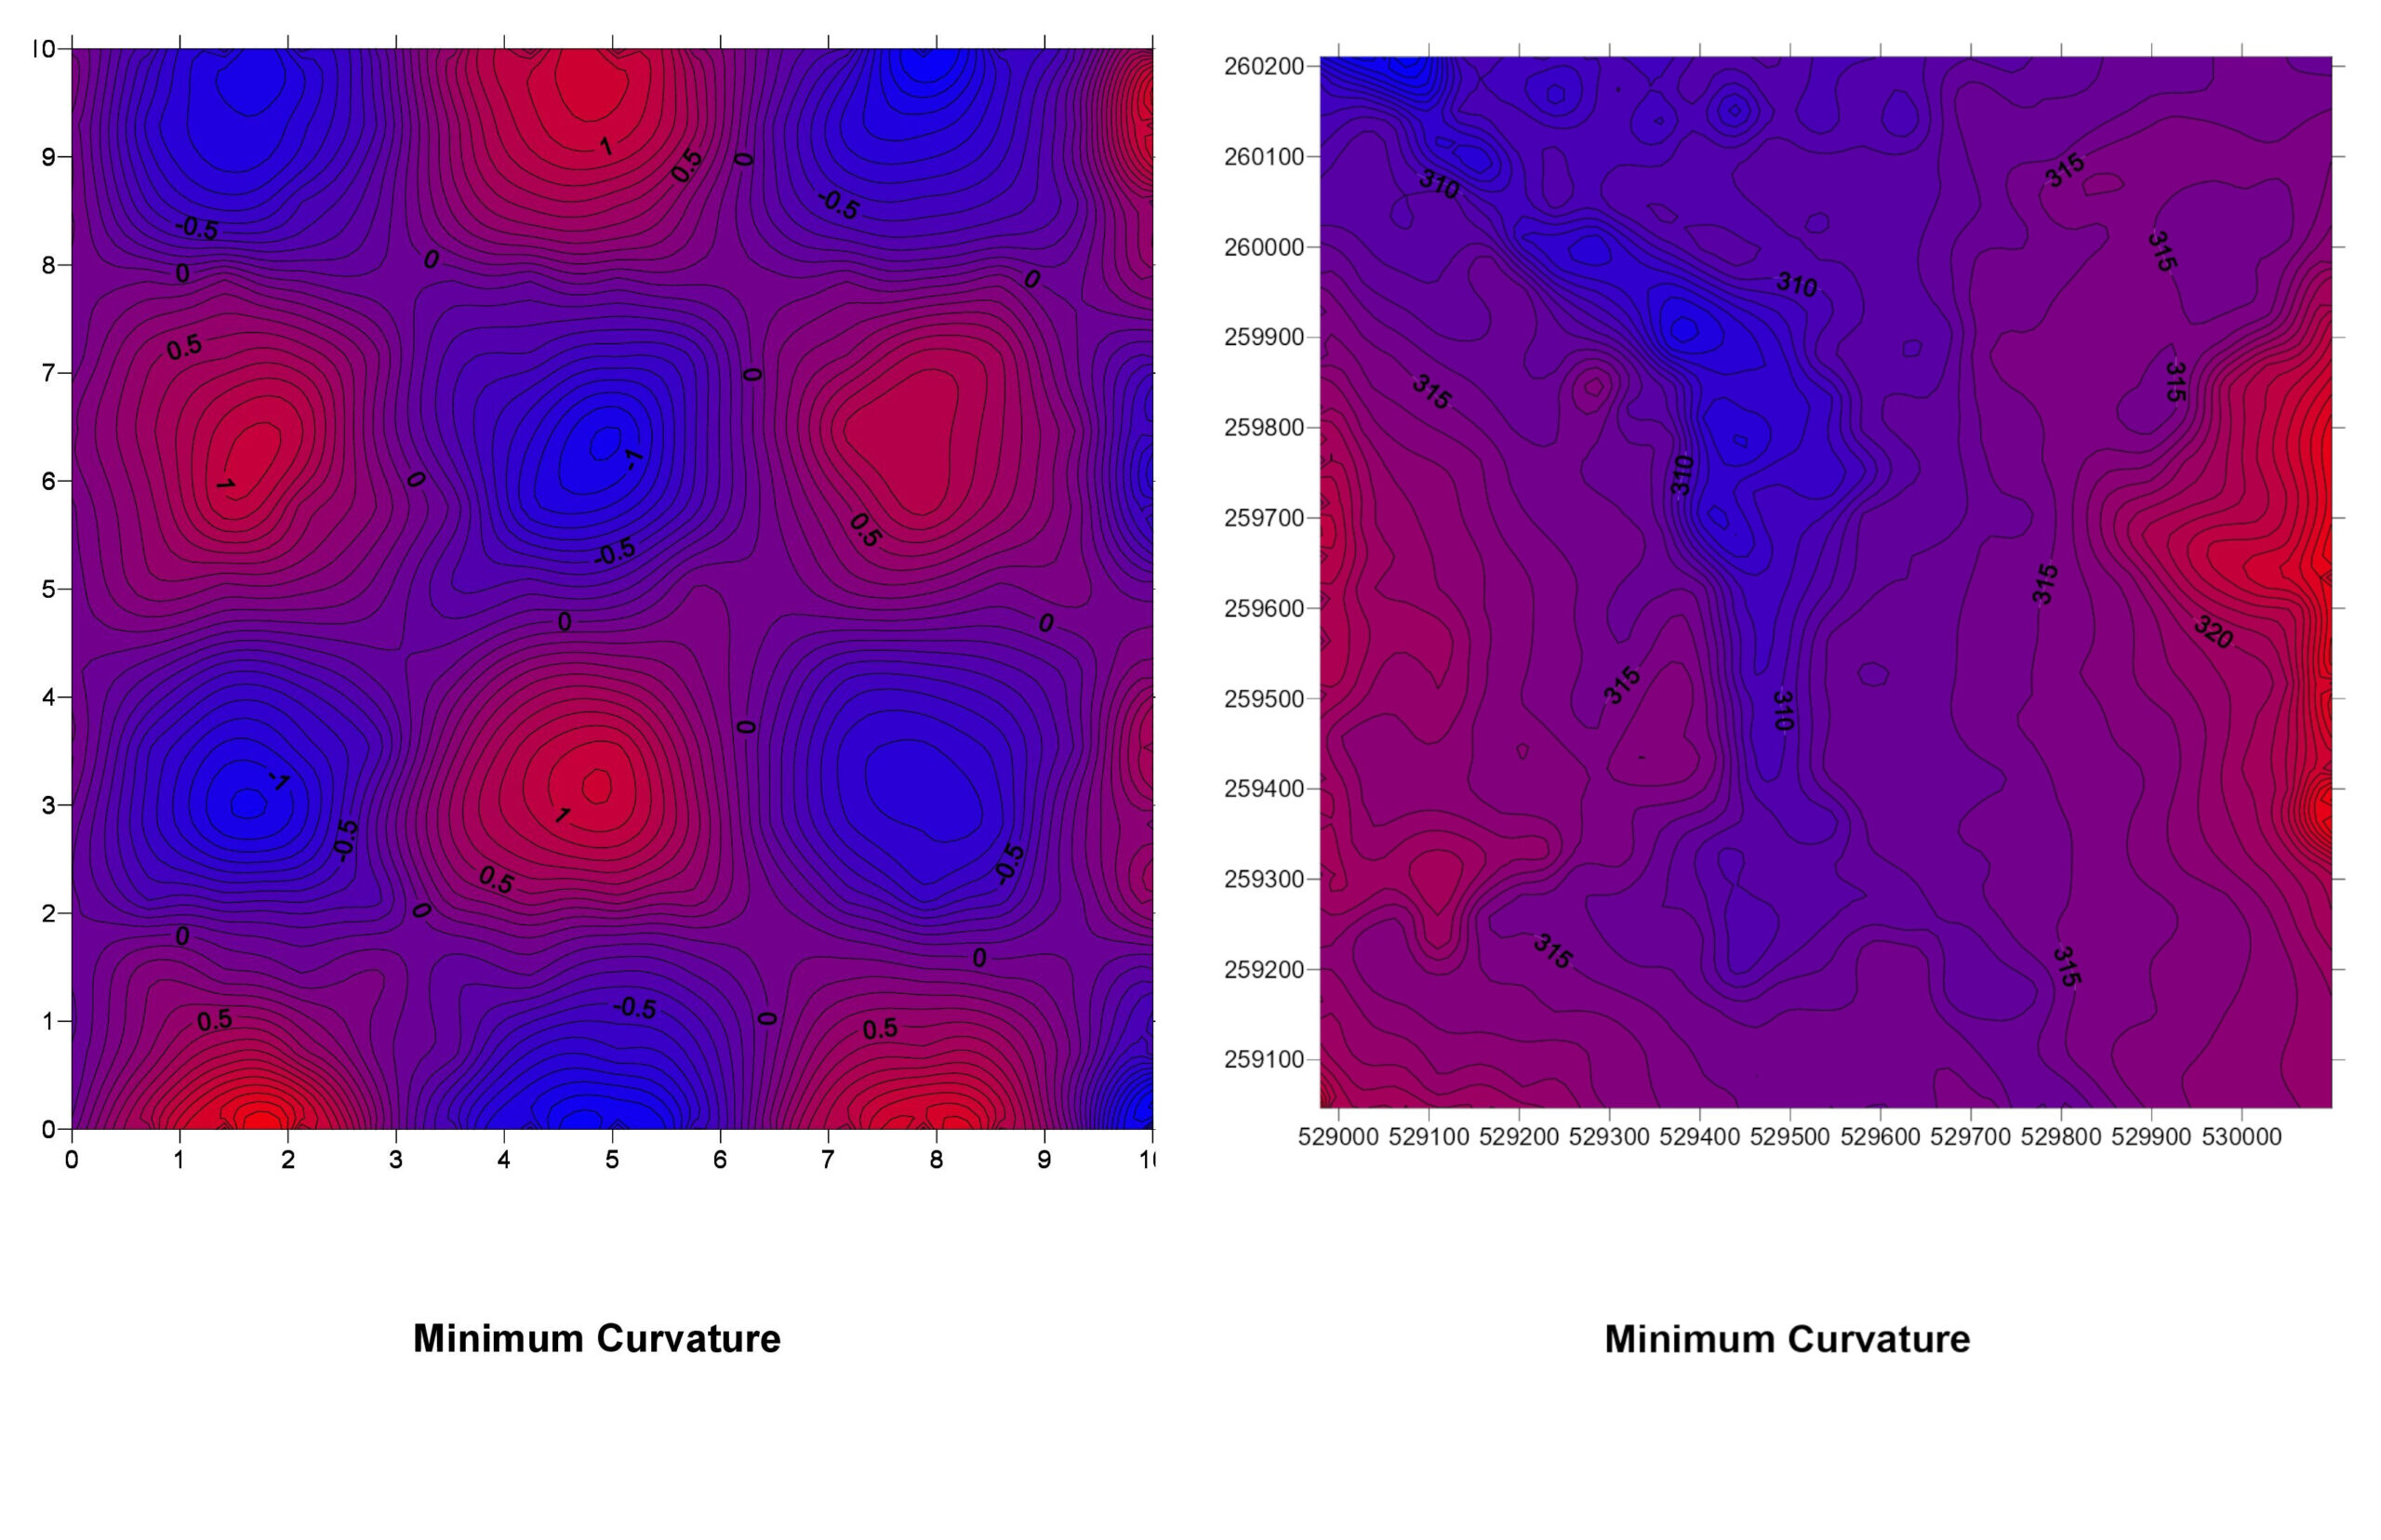
6. Minimum Curvature (Spline)
How It Works: This method fits a smooth surface that minimizes the overall curvature, similar to bending a flexible sheet to pass through the data points.
Minimum Curvature Explained: Think of laying a rubber sheet over your data points, with the sheet touching each point. The sheet bends smoothly between points, creating a surface with minimal twists and turns.
Pros:
- Creates smooth and visually appealing surfaces.
- Good for gently varying data.
Cons:
- Can overshoot or produce unrealistic values (overfitting).
- Not suitable for data with sharp changes.
Choosing the Right Method of Interpolation
Selecting an interpolation method depends on several factors:
- Data Characteristics: Is your data smoothly varying or has abrupt changes?
- Distribution of Data Points: Are the points evenly spread out or clustered?
- Purpose of the Analysis: Do you need a quick estimate or a statistically robust prediction?
- Computational Resources: Some methods require more processing power and time.
Tips:
- Experiment: Try multiple methods and compare the results.
- Cross-Validation: Use a subset of data to validate the accuracy of your interpolation.
- Consult Expertise: For complex datasets, consider consulting a geostatistician.
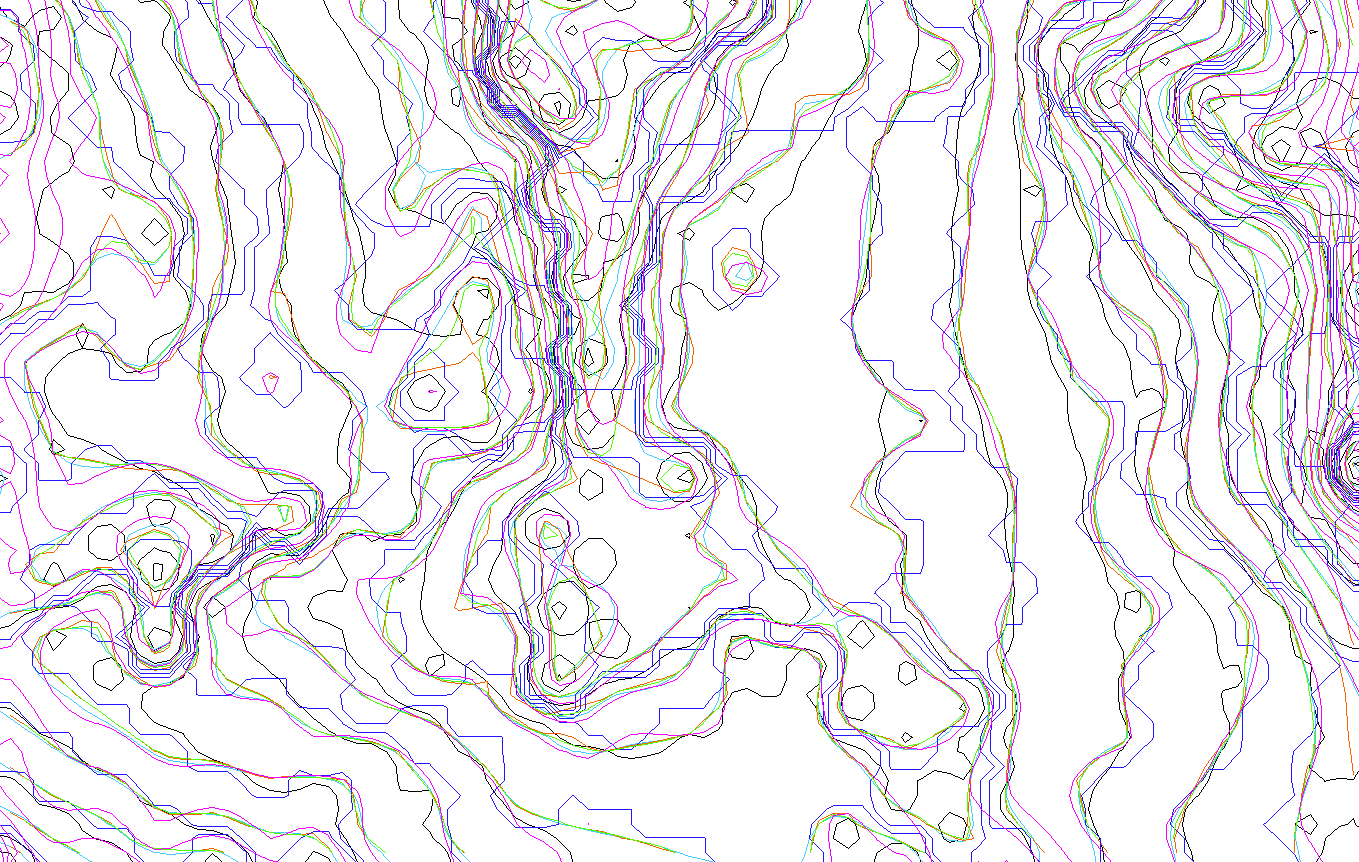
By overlaying the interpolated maps (like in the image below), we can conclude that no interpolation technique produces the same result. This allows for the manipulation of visualizations by GIS analytics.
In a nutshell, interpolation is a technique in GIS that transforms scattered data points into continuous surfaces, unlocking insights and enabling informed decision-making.
By understanding the basics of methods like IDW, Kriging, Triangulation, Nearest Neighbor, Natural Neighbor, and Minimum Curvature, you’re better equipped to handle spatial data challenges. Remember, there’s no one-size-fits-all solution—each method has its place, and the best choice depends on your specific needs and data characteristics.
So the next time you’re faced with a landscape of unknowns, you’ll know how to bridge the gaps, turning dots into a meaningful picture of the world.
Did you like this post? Read more and subscribe to our monthly newsletter!


#Science

Next article

Call for nominations: Global Top 100 Geospatial Companies 2025 Edition

We’re thrilled to announce that the nomination phase for the Geoawesome Global Top 100 Geospatial Companies 2025 is officially open! ? Submit your entries by Friday, December 20th, 2024 and join us in this initiative to celebrate the most innovative and influential companies in the geospatial industry worldwide.
#GlobalTop100Geo 2025 Edition
What’s New This Year
- Enhanced Focus on Core Competencies: This year, we’re emphasizing core geospatial competencies and emerging trends shaping the future of the industry.
- Streamlined Nomination Process: We’ve simplified the nomination form by removing questions related to basic company data and reduced the total number of questions.
- Organic Awareness-Building Opportunities: All companies that participate in the nomination process will be contacted by our team with organic awareness-building opportunities, such as inclusion in our geospatial industry logo map, reports, and more.
How to Nominate
Starting today (October 1, 2024), you can nominate your company through our official nomination form.
Timeline and key dates:
- Open call for nominations: Tuesday 1st October 2024
- Deadline for nominations: Friday 20th December 2024
- Communication under embargo to 100 companies: Monday 27th January 2025
- Publication of the list and online event: Friday 31st January 2025
Criteria for Selection
As in past years, our expert panel will review all nominations and decide the final list. Companies will be evaluated based on:
- Product and Impact on the Industry
- Innovation and Technological Advancement
- Contribution to the Community
- Commitment to Diversity, Equity, and Inclusion (DEI)
- Environmental, Social, and Governance (ESG) Practices
About the Top 100 Geospatial Companies List:
Now in its 7th edition, this annual initiative celebrates the most innovative and influential companies in the geospatial industry worldwide. This authoritative list is not only a salute to these trailblazers but also an indispensable guide for professionals and aficionados across our diverse geospatial community. It’s an opportunity to recognize organizations that are pushing the boundaries of geospatial technology, driving innovation, and making significant contributions to the field.
You can check out our list from 2016, 2019, 2021, 2022, 2023 and 2024.
Expert Panel
- Sives Govender, Research Group Leader, CSIR, South Africa and Co- founder and coordinator of Environmental Information System-Africa
- Siau Yong, Director, GeoSpatial and Data & Chief Data Officer, Singapore Land Authority
- Osamu Ochiai, Senior Engineer, Manager for Satellite Applications and Operation Center at Japan Aerospace Exploration Agency
- Justyna Redelkiewicz, Head of Section Entrepreneurship and Environment at the European Union Agency for Space Programme (EUSPA)
- Chiara Solimini, Space Downstream Market Officer at the European Union Agency for Space Programme (EUSPA)
- Peter Rabley, CEO at Open Geospatial Consortium (OGC)
- Denise McKenzie, Manging Partner at PLACE Trust
- Dr. Nadine Alameh, Executive Director of the Taylor Geospatial Institute
- Paloma Merodio, VP at National Institute of Statistics and Geography of Mexico (INEGI)
and
- Aleksander Buczkowski and Muthukumar Kumar for Geoawesome

