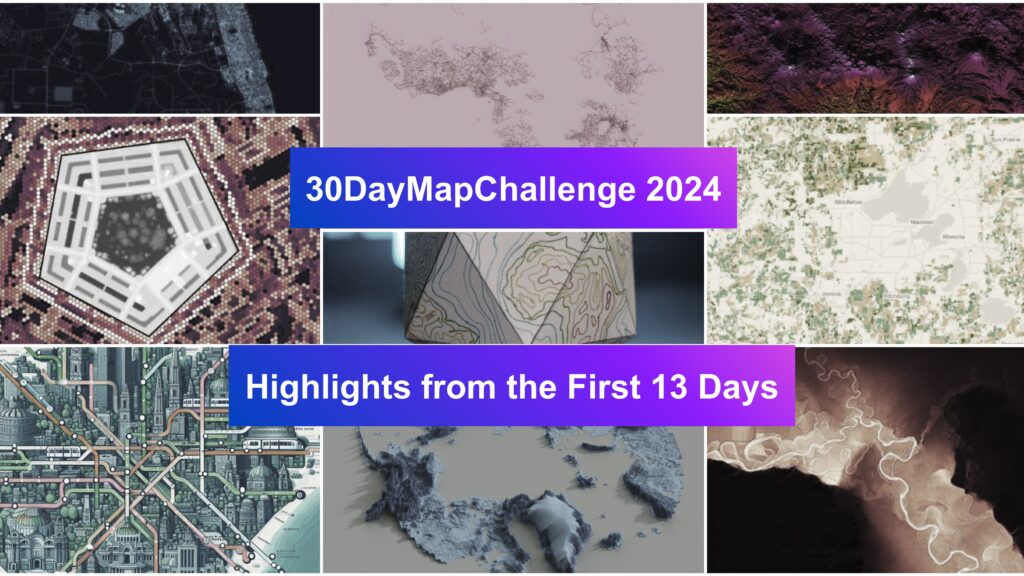
The annual #30DayMapChallenge, created by Topi Tjukanov, is an open invitation to mapmakers of all levels to create and share thematic maps every day in November. Each day presents a new theme, encouraging participants to experiment, learn new tools, and showcase creative takes on classic and contemporary mapping topics. It’s a perfect occasion to express love for all things that are ‘geo’. Here’s a look at the first 13 days and how each theme inspired the community.
Points ?
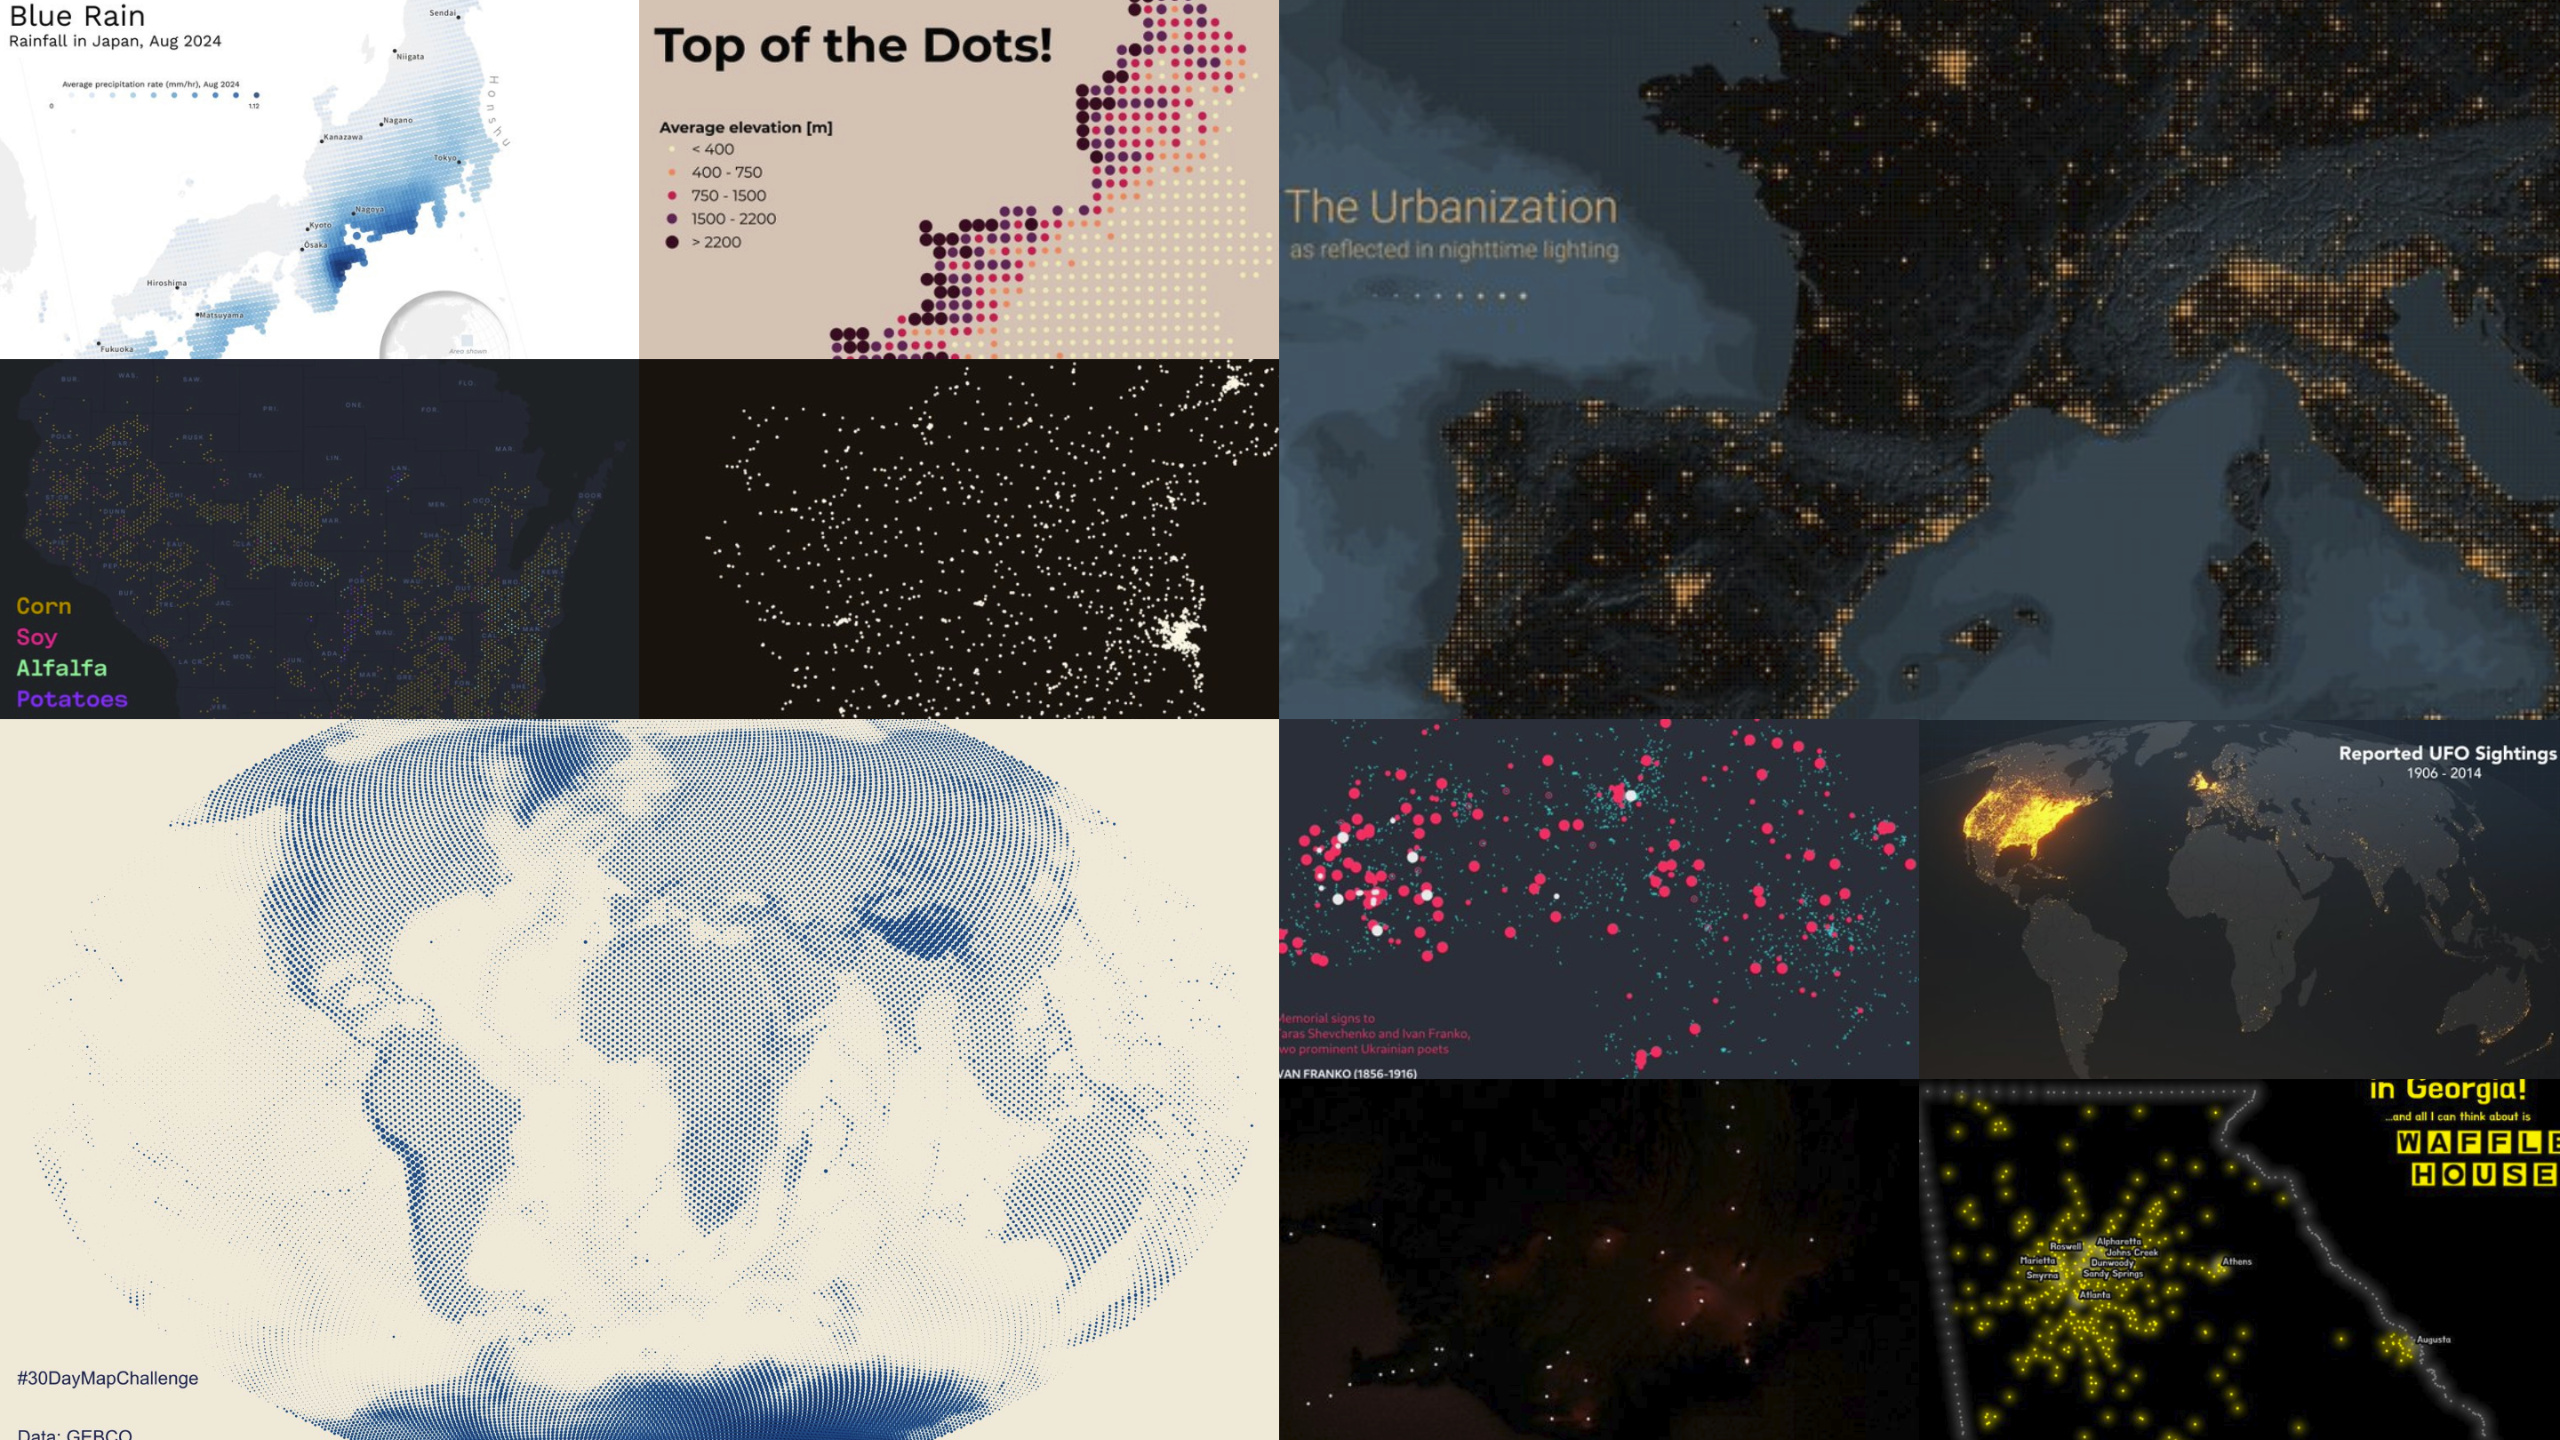
The challenge began with “Points,” focusing on individual locations. From city maps to clusters of natural landmarks, participants used points to represent everything from populations to environmental patterns, underscoring the foundational role of points in mapping.
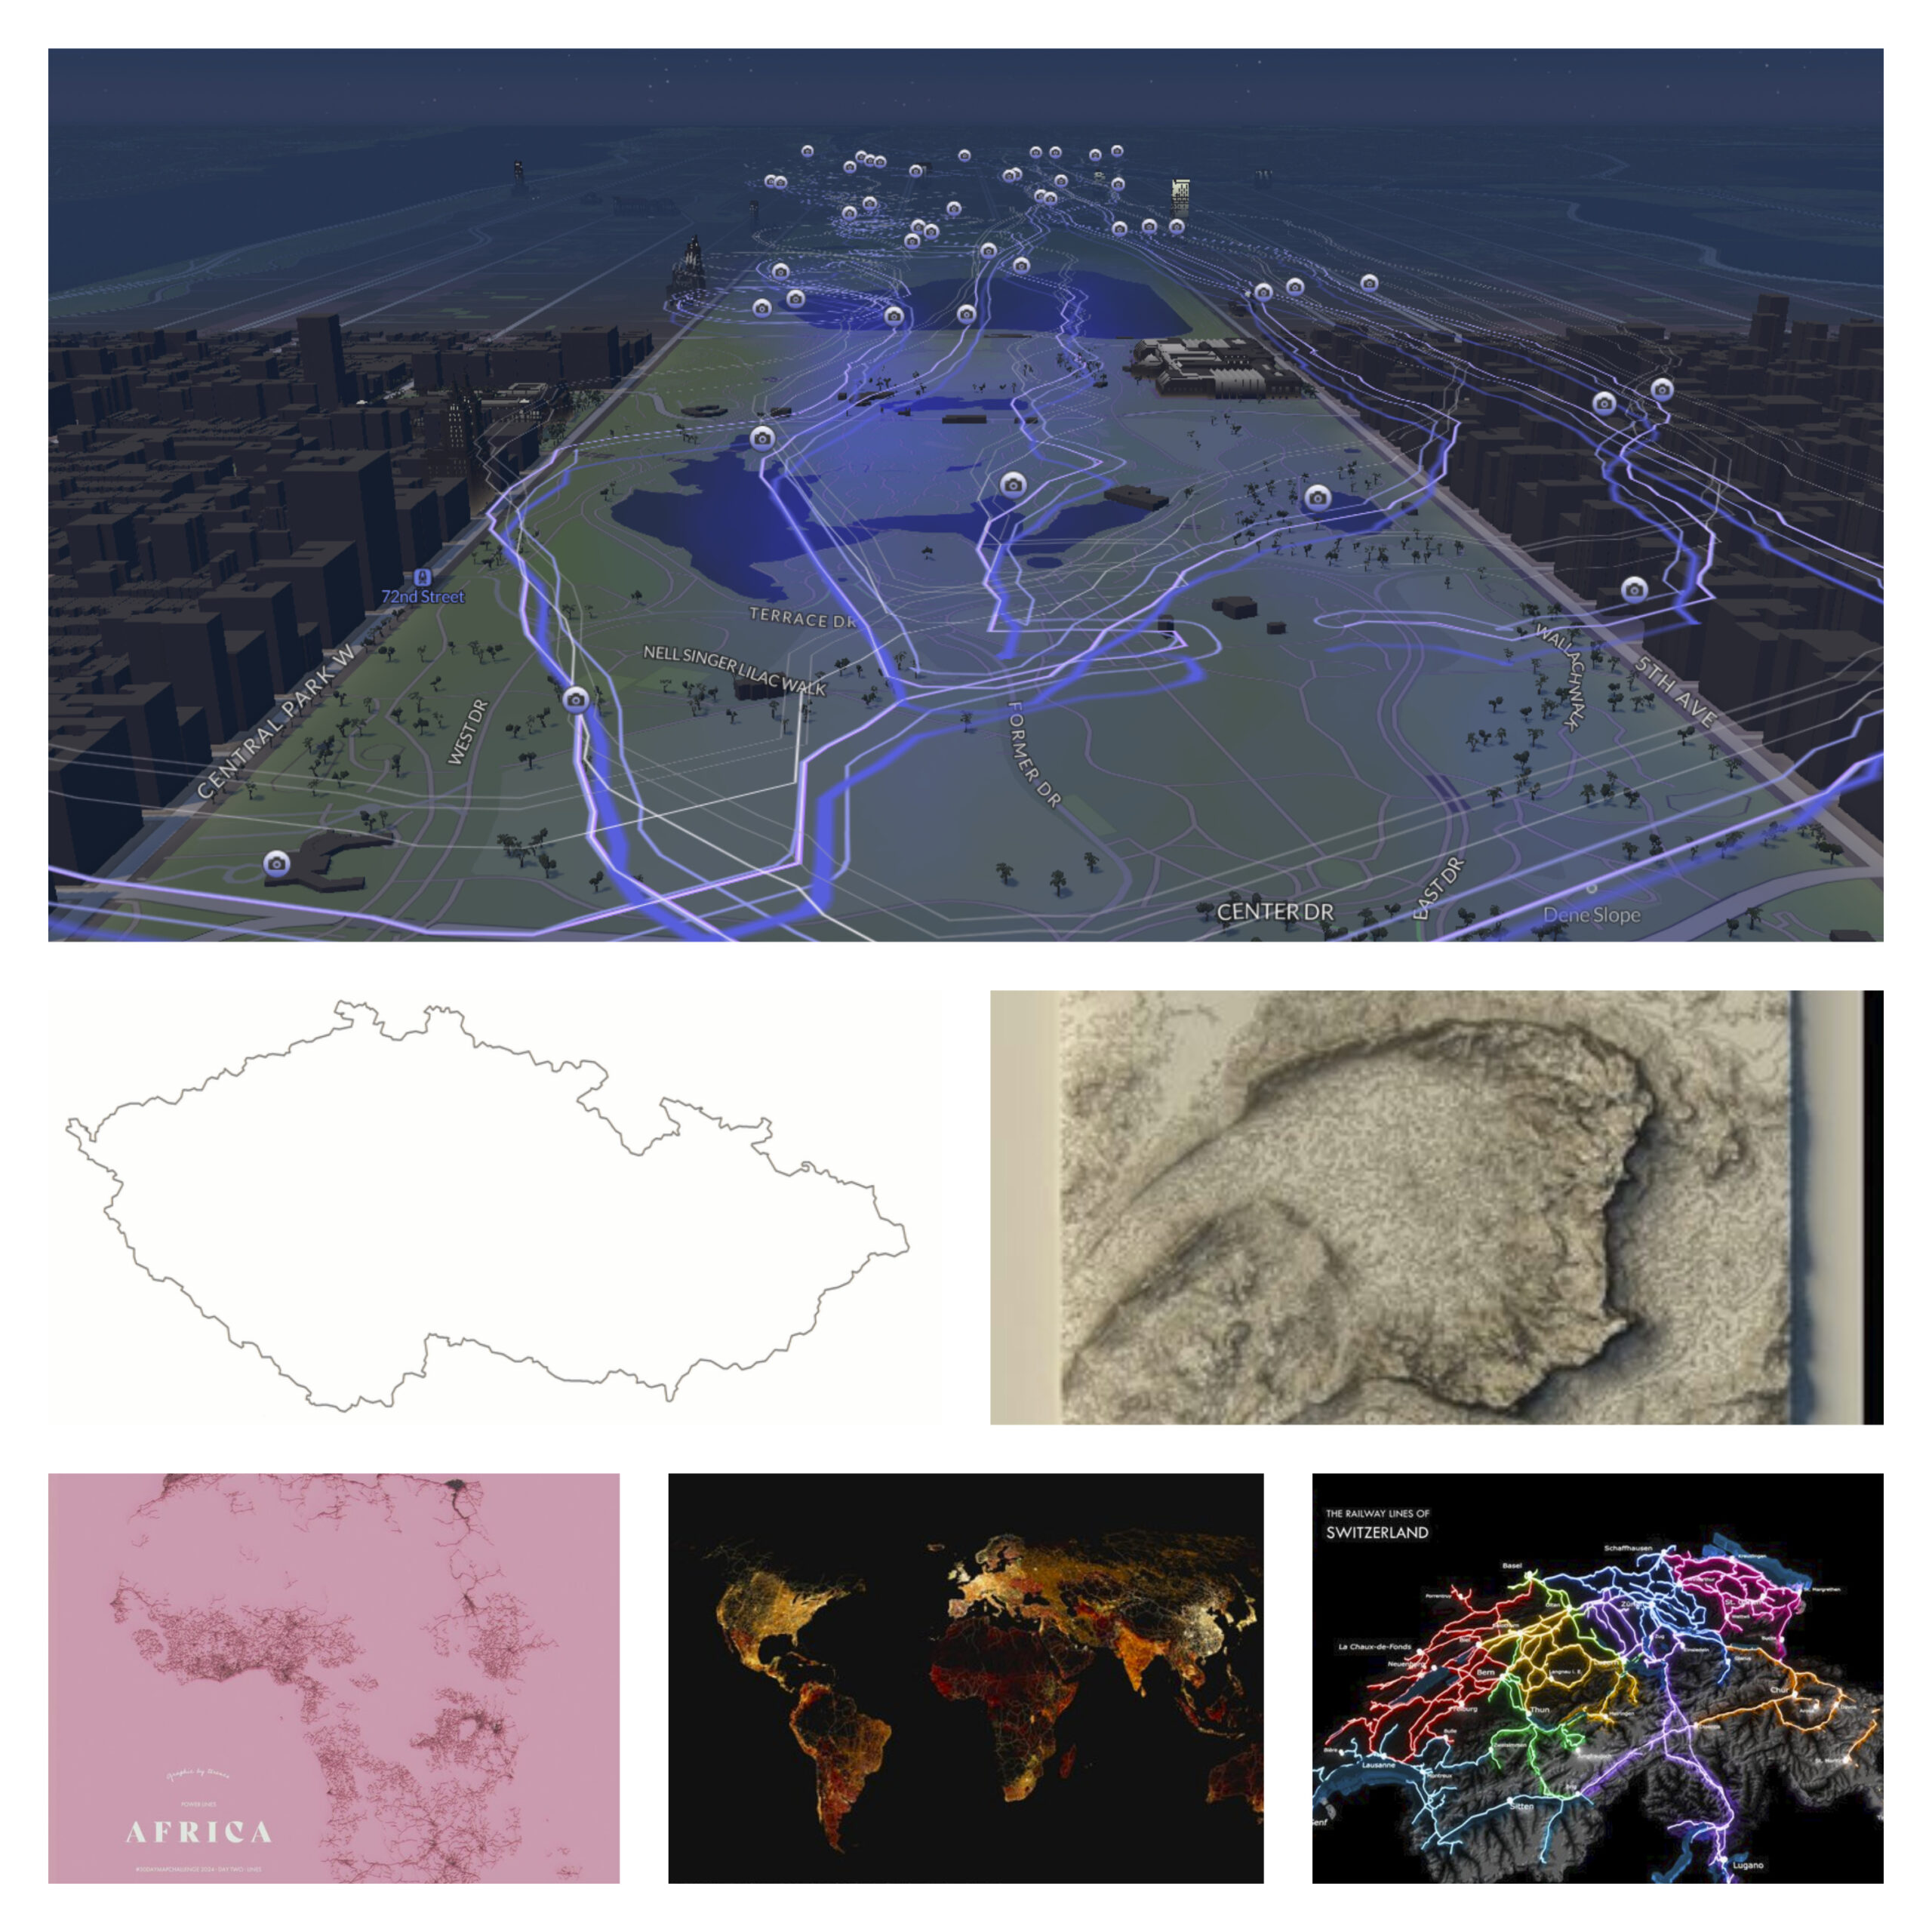
Lines ?
“Lines” invited mappers to capture connections and boundaries through roads, rivers, and flight paths. This theme emphasized the beauty of linear features, showing the world’s movement and divisions.
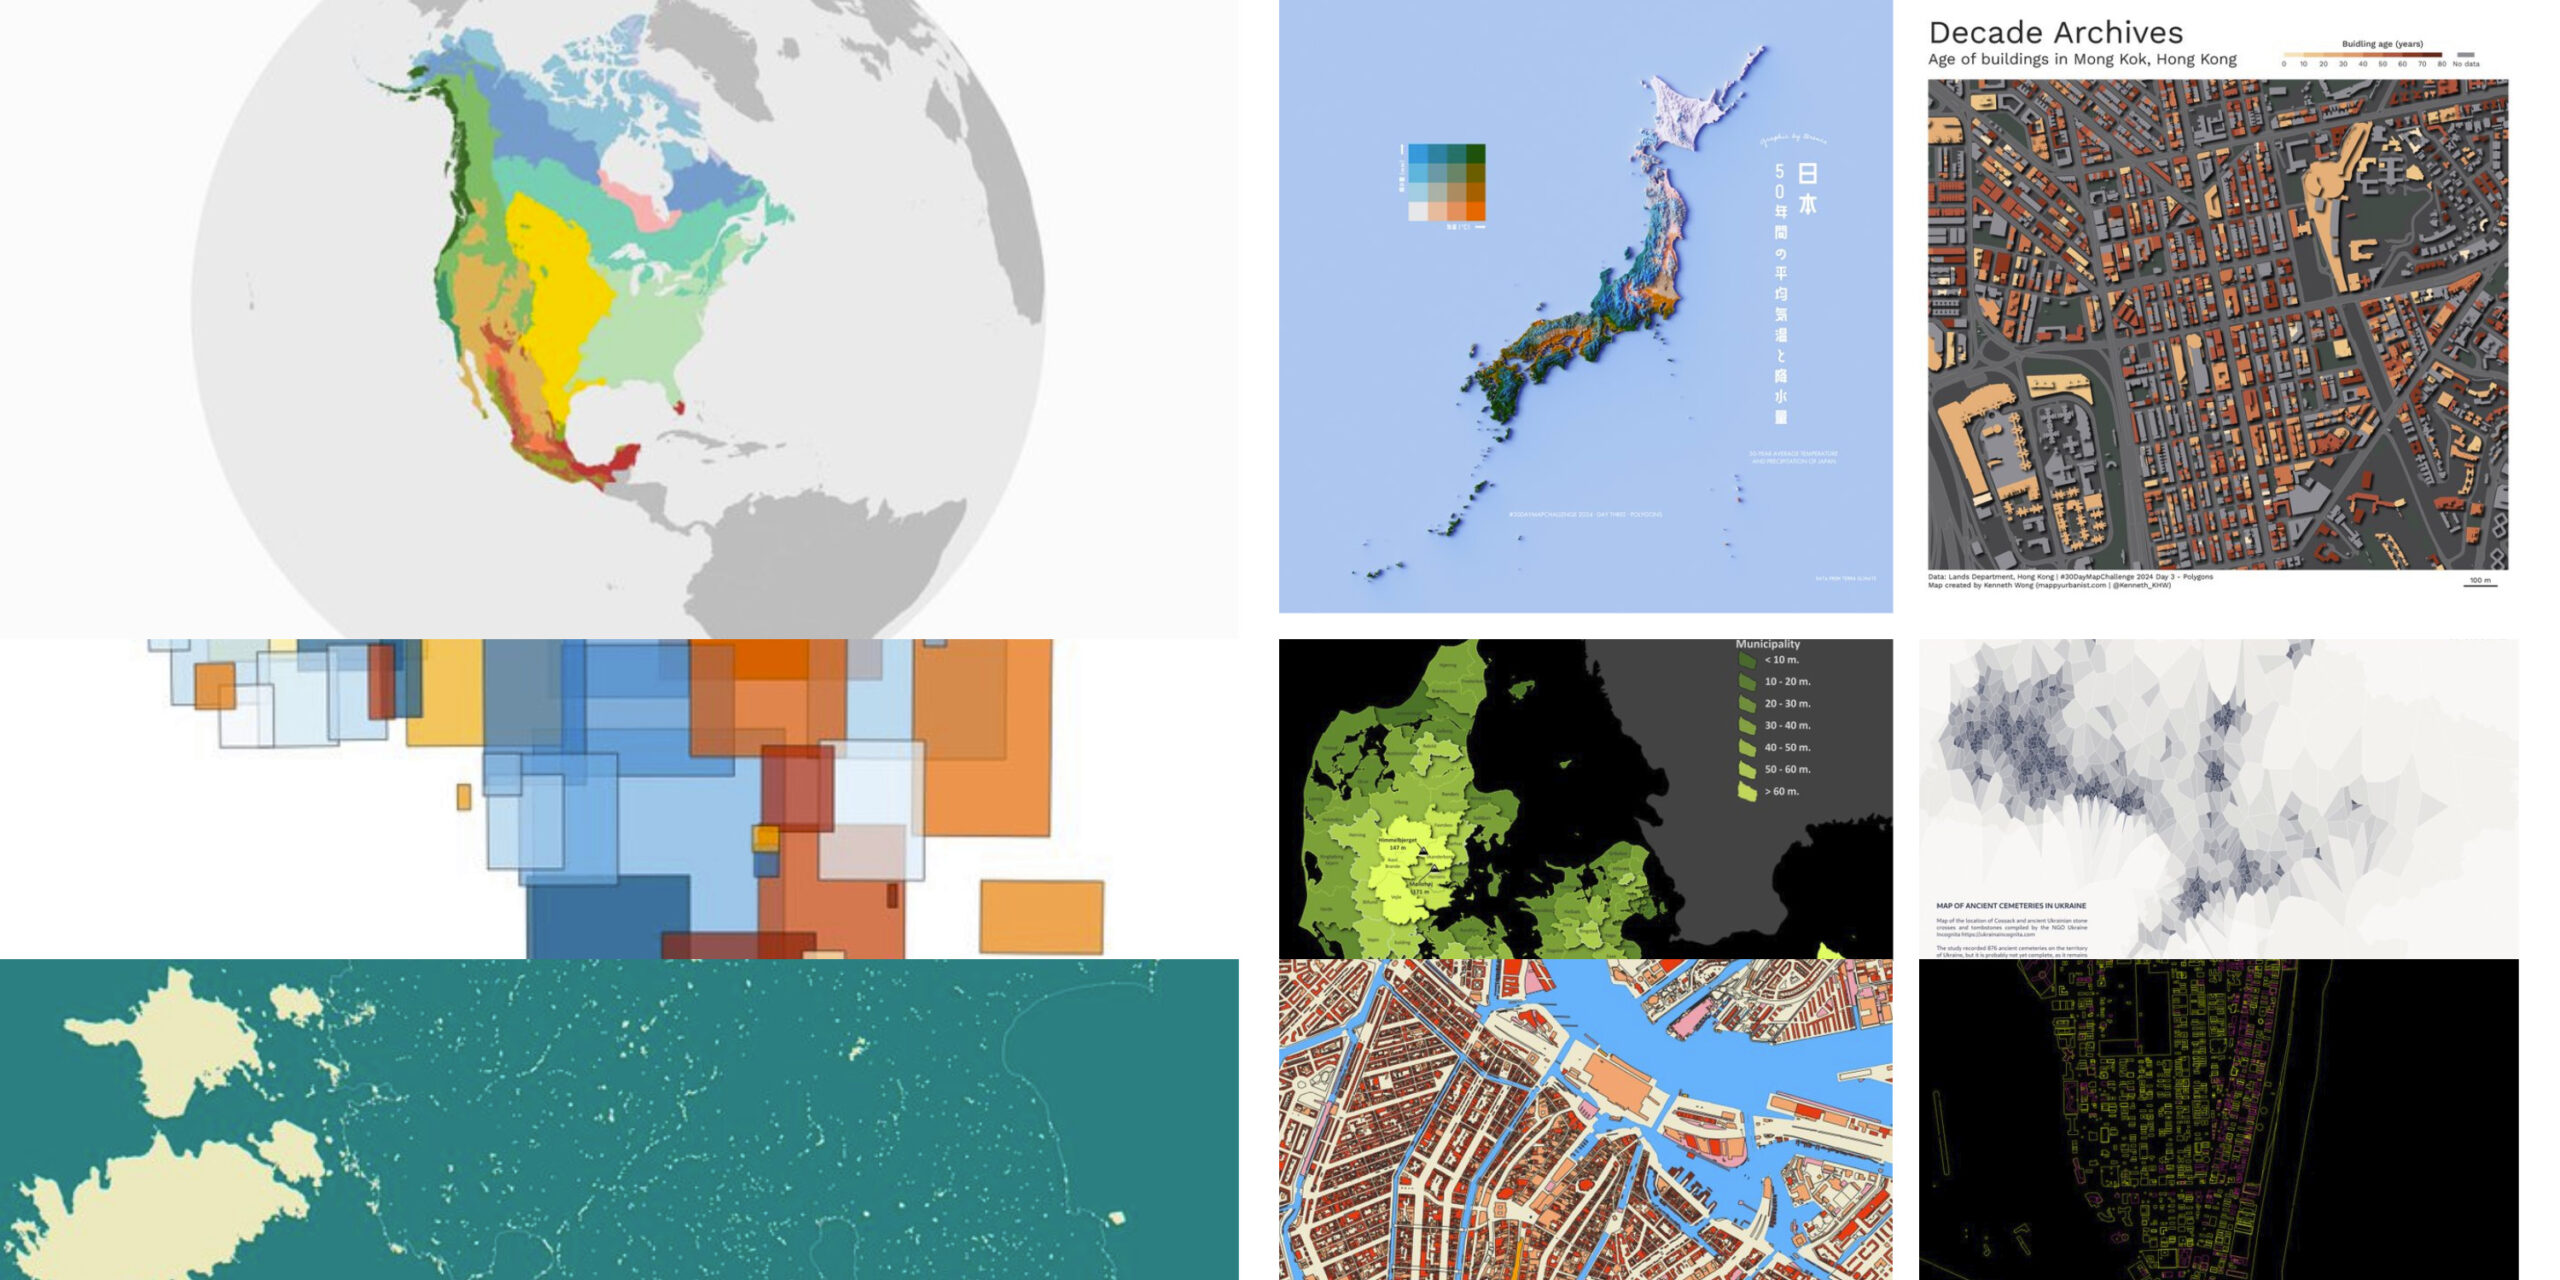
Polygons ?
Polygons added depth, allowing participants to visualize defined regions and areas, from city zones to climate regions. This theme highlighted the diversity of areas that can be mapped using filled shapes.
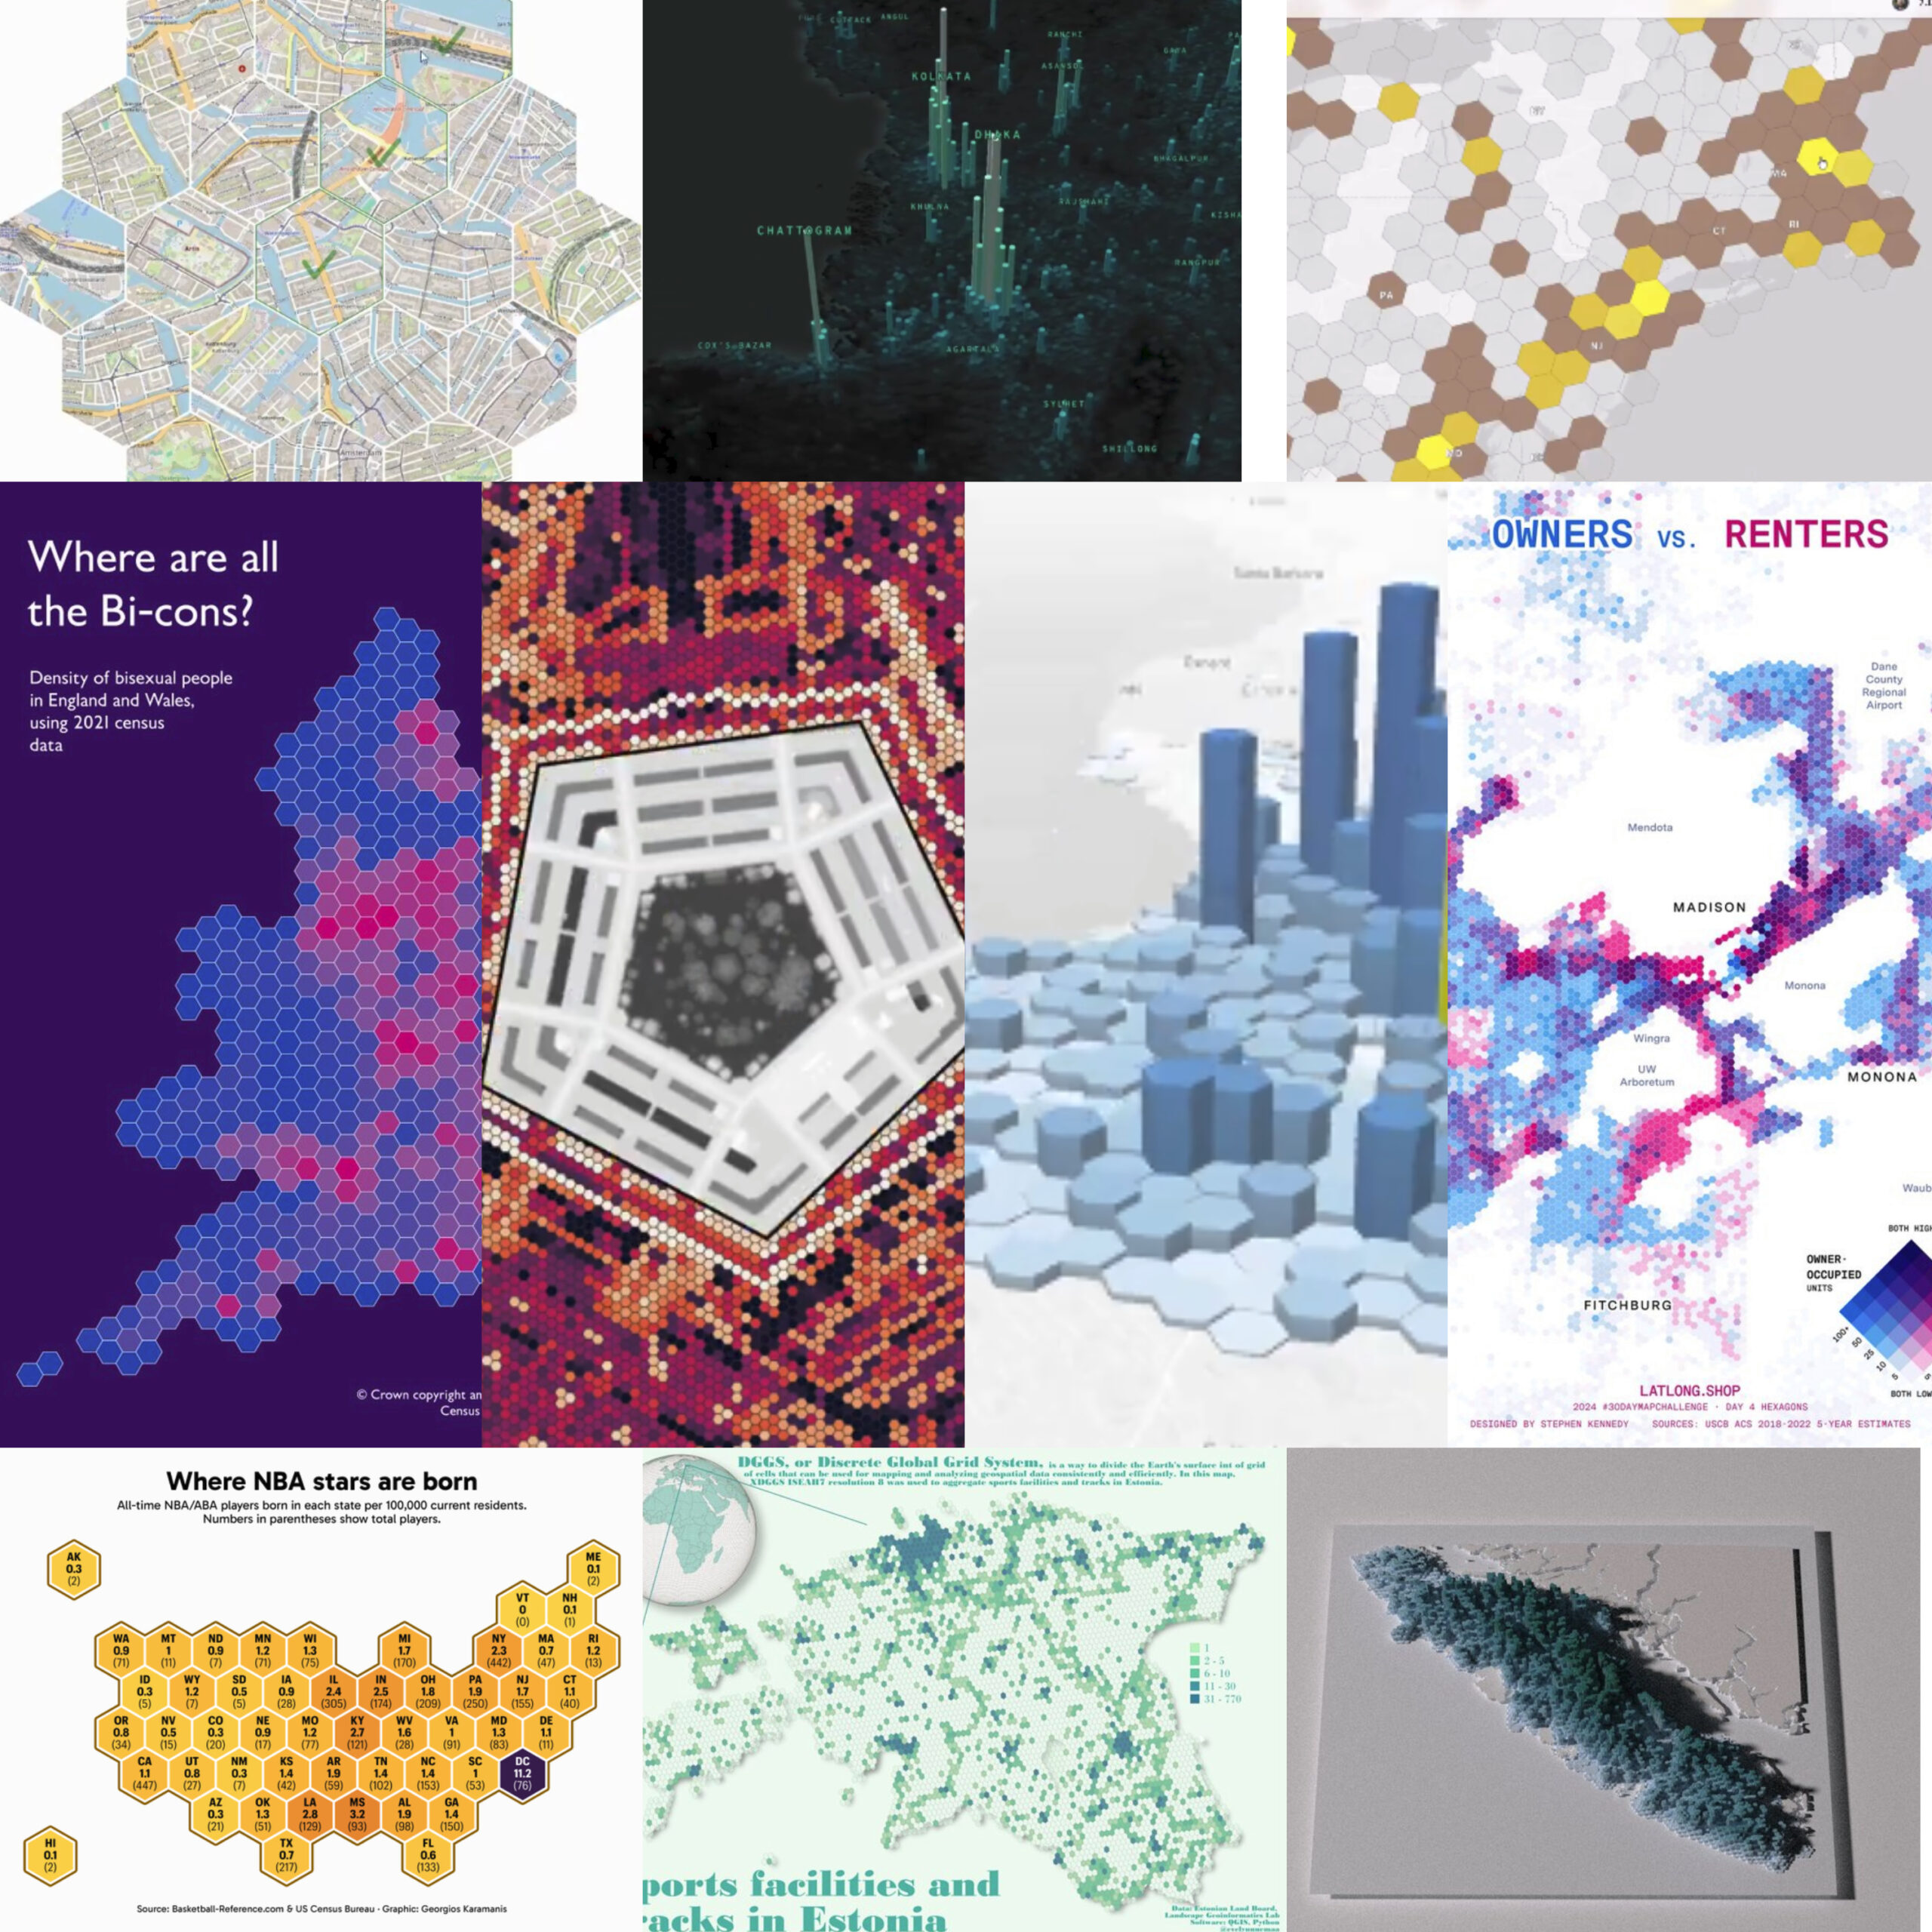
Hexagons ?
Swapping square grids for hexagons, participants created smoother visual representations of density, movement, and spatial patterns. Hexagonal grids were popular for visualizing urban layouts and distribution patterns.
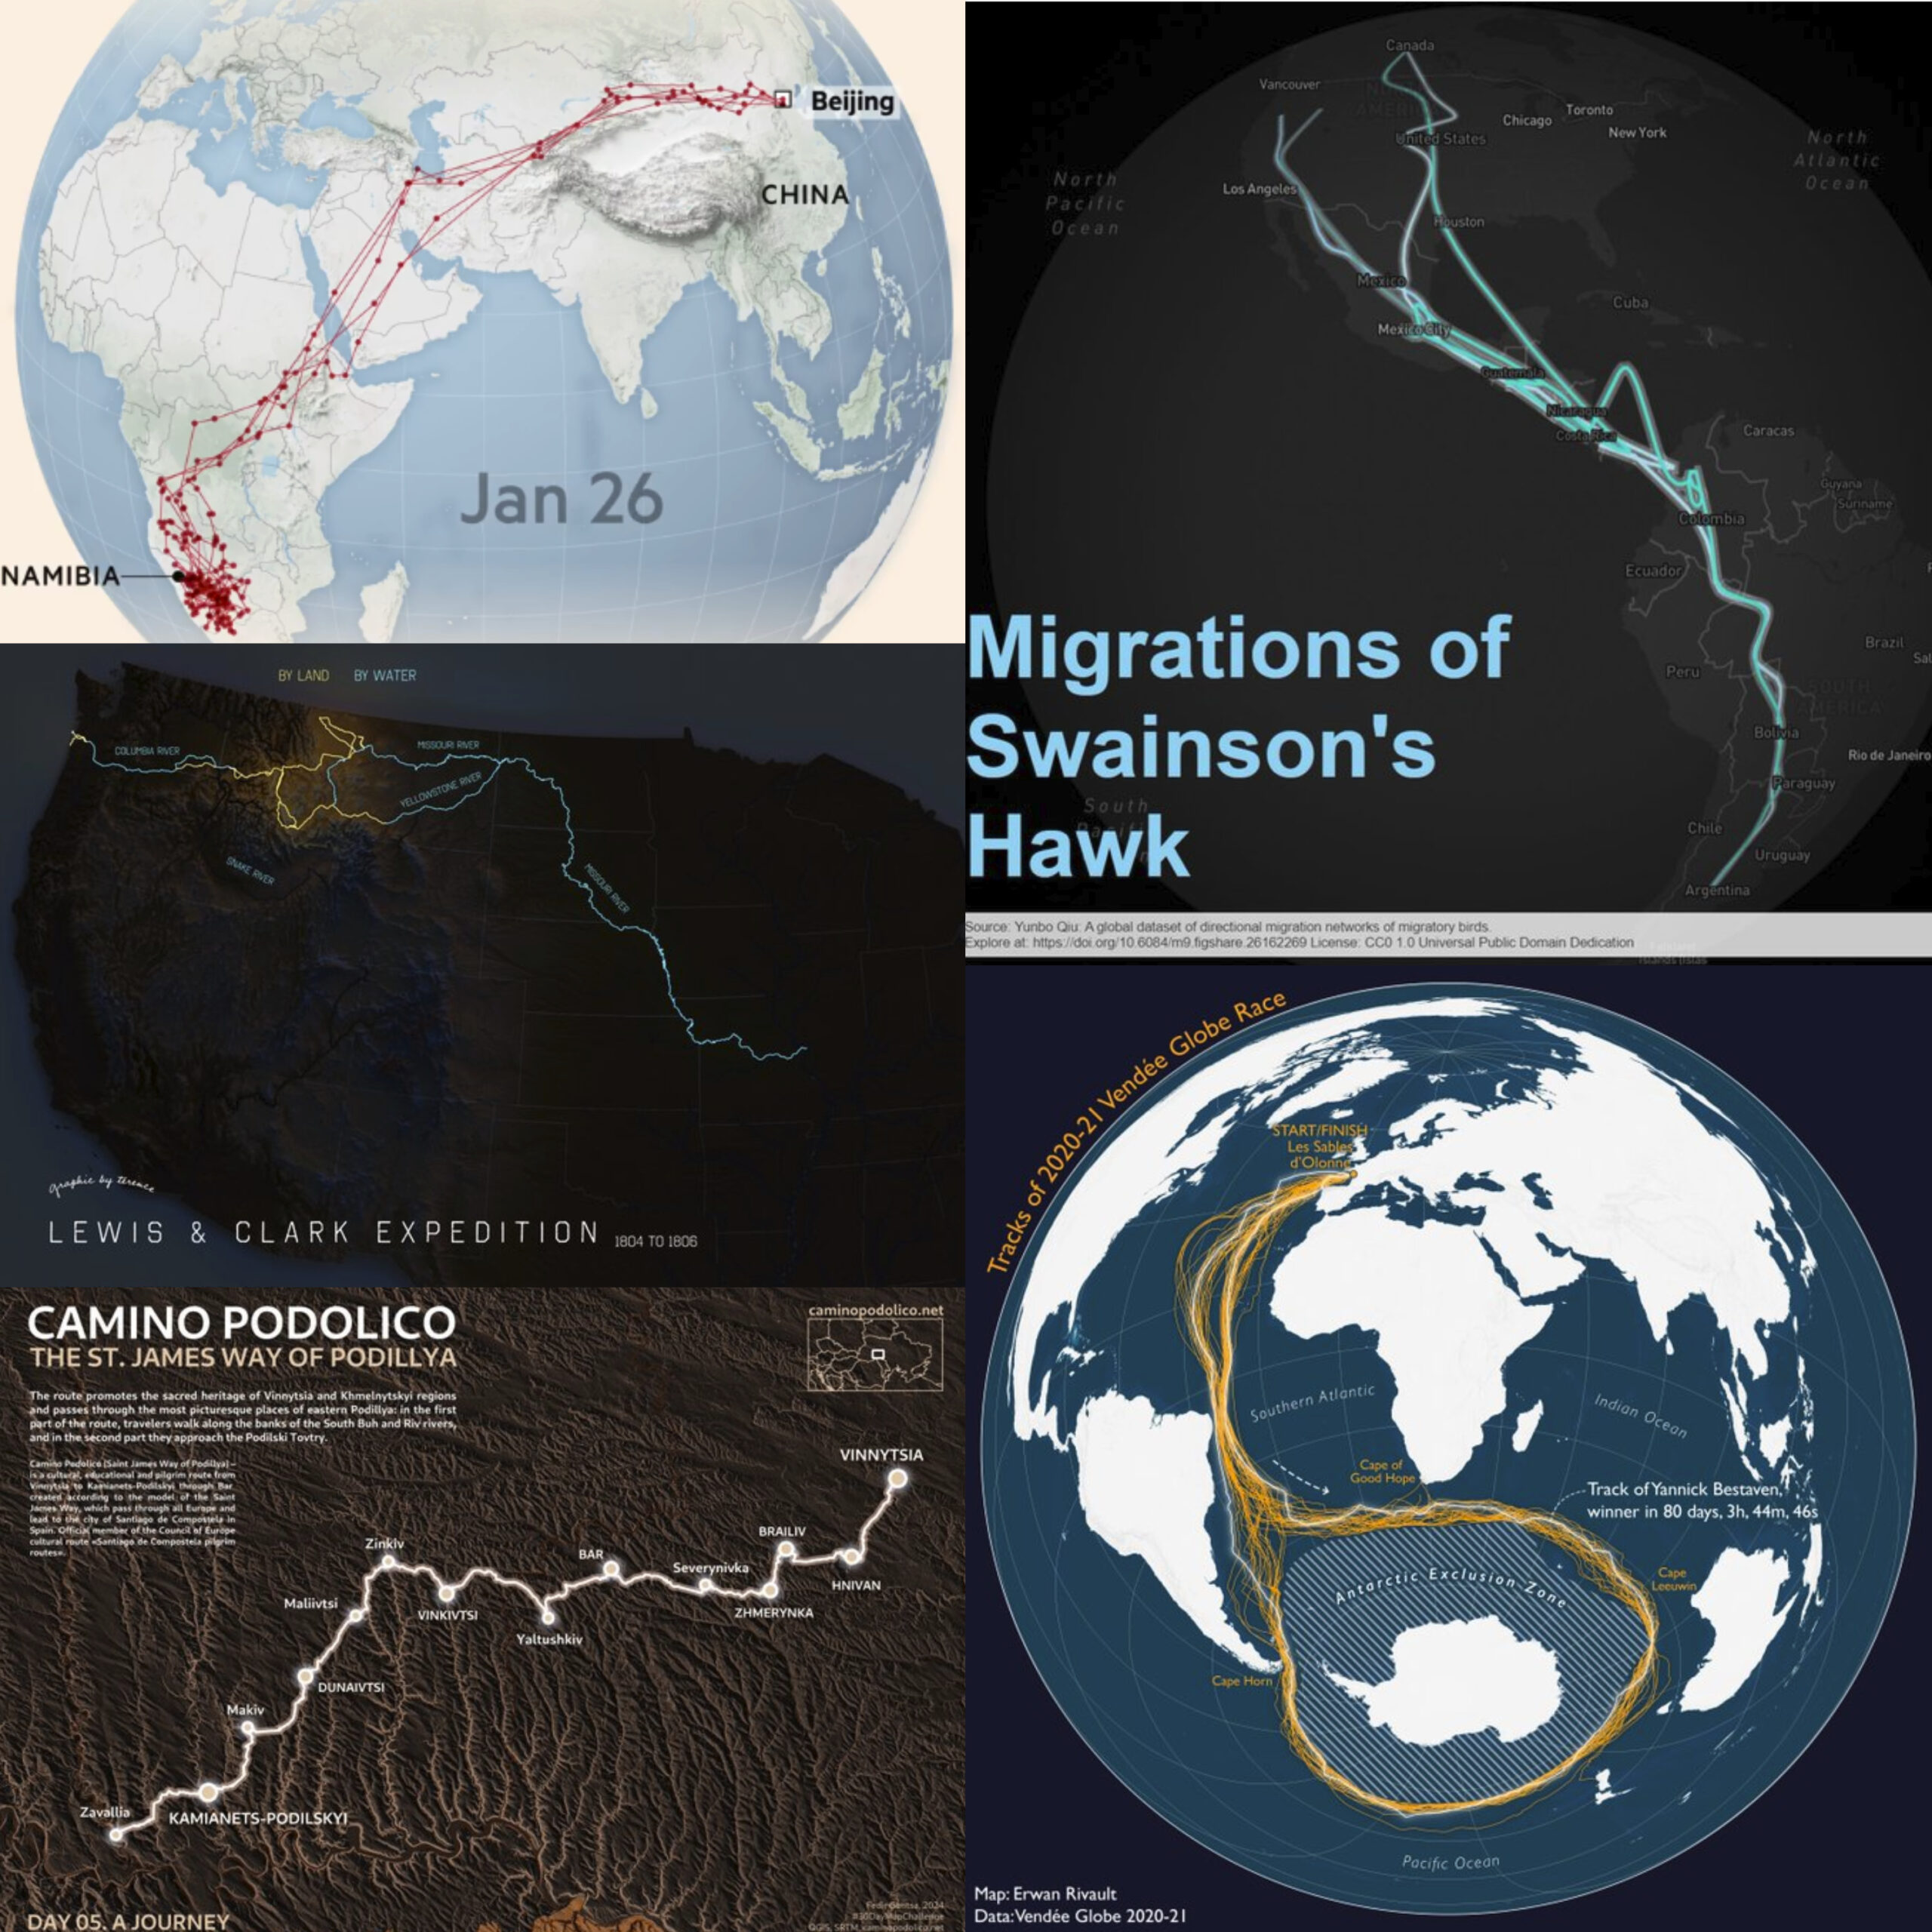
A Journey ?♂️✈️
“A Journey” brought narrative into maps, encouraging participants to trace paths, from personal commutes to historical explorations. Each map represented a unique story of movement across places and time.
Raster ??
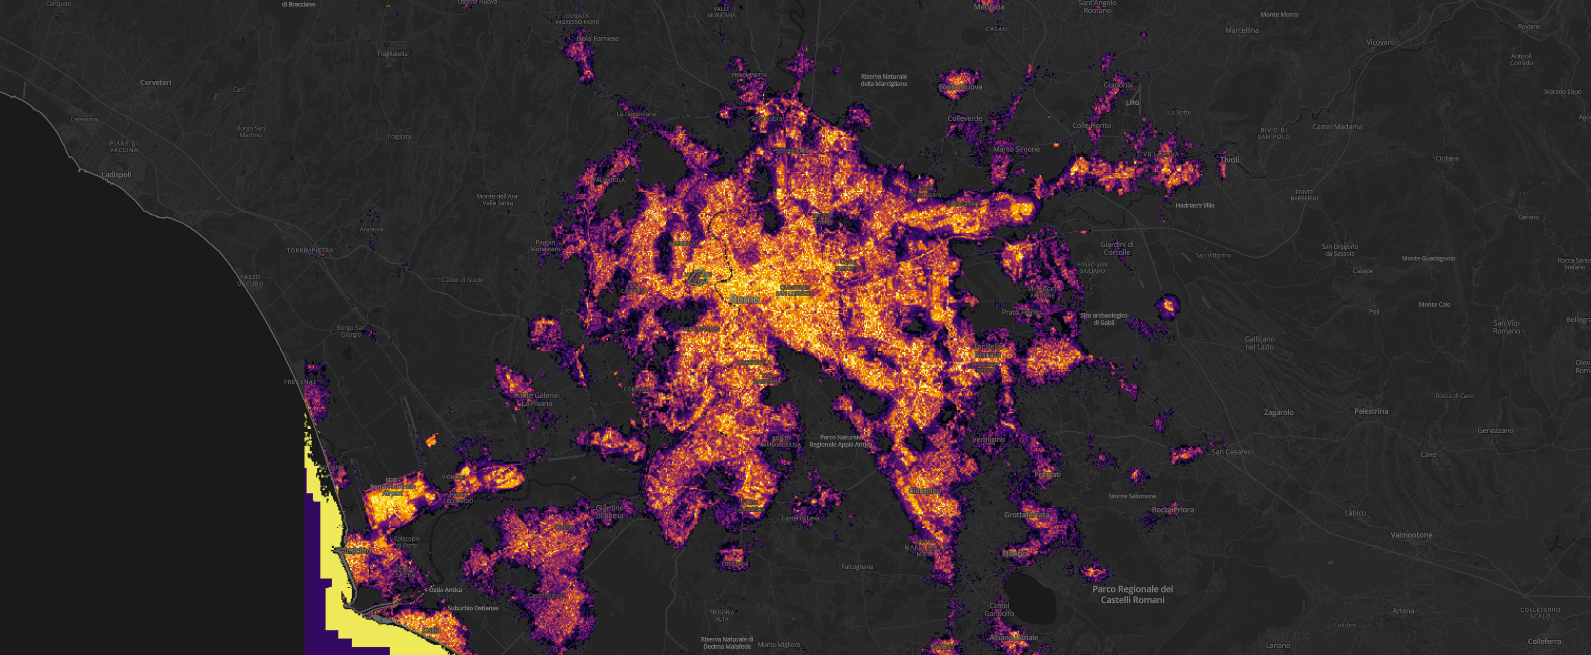
Using raster data, mappers highlighted the continuous surfaces found in satellite imagery, heatmaps, and population density maps. The results showed the flexibility of pixels in visualizing everything from temperature shifts to nighttime city lights.
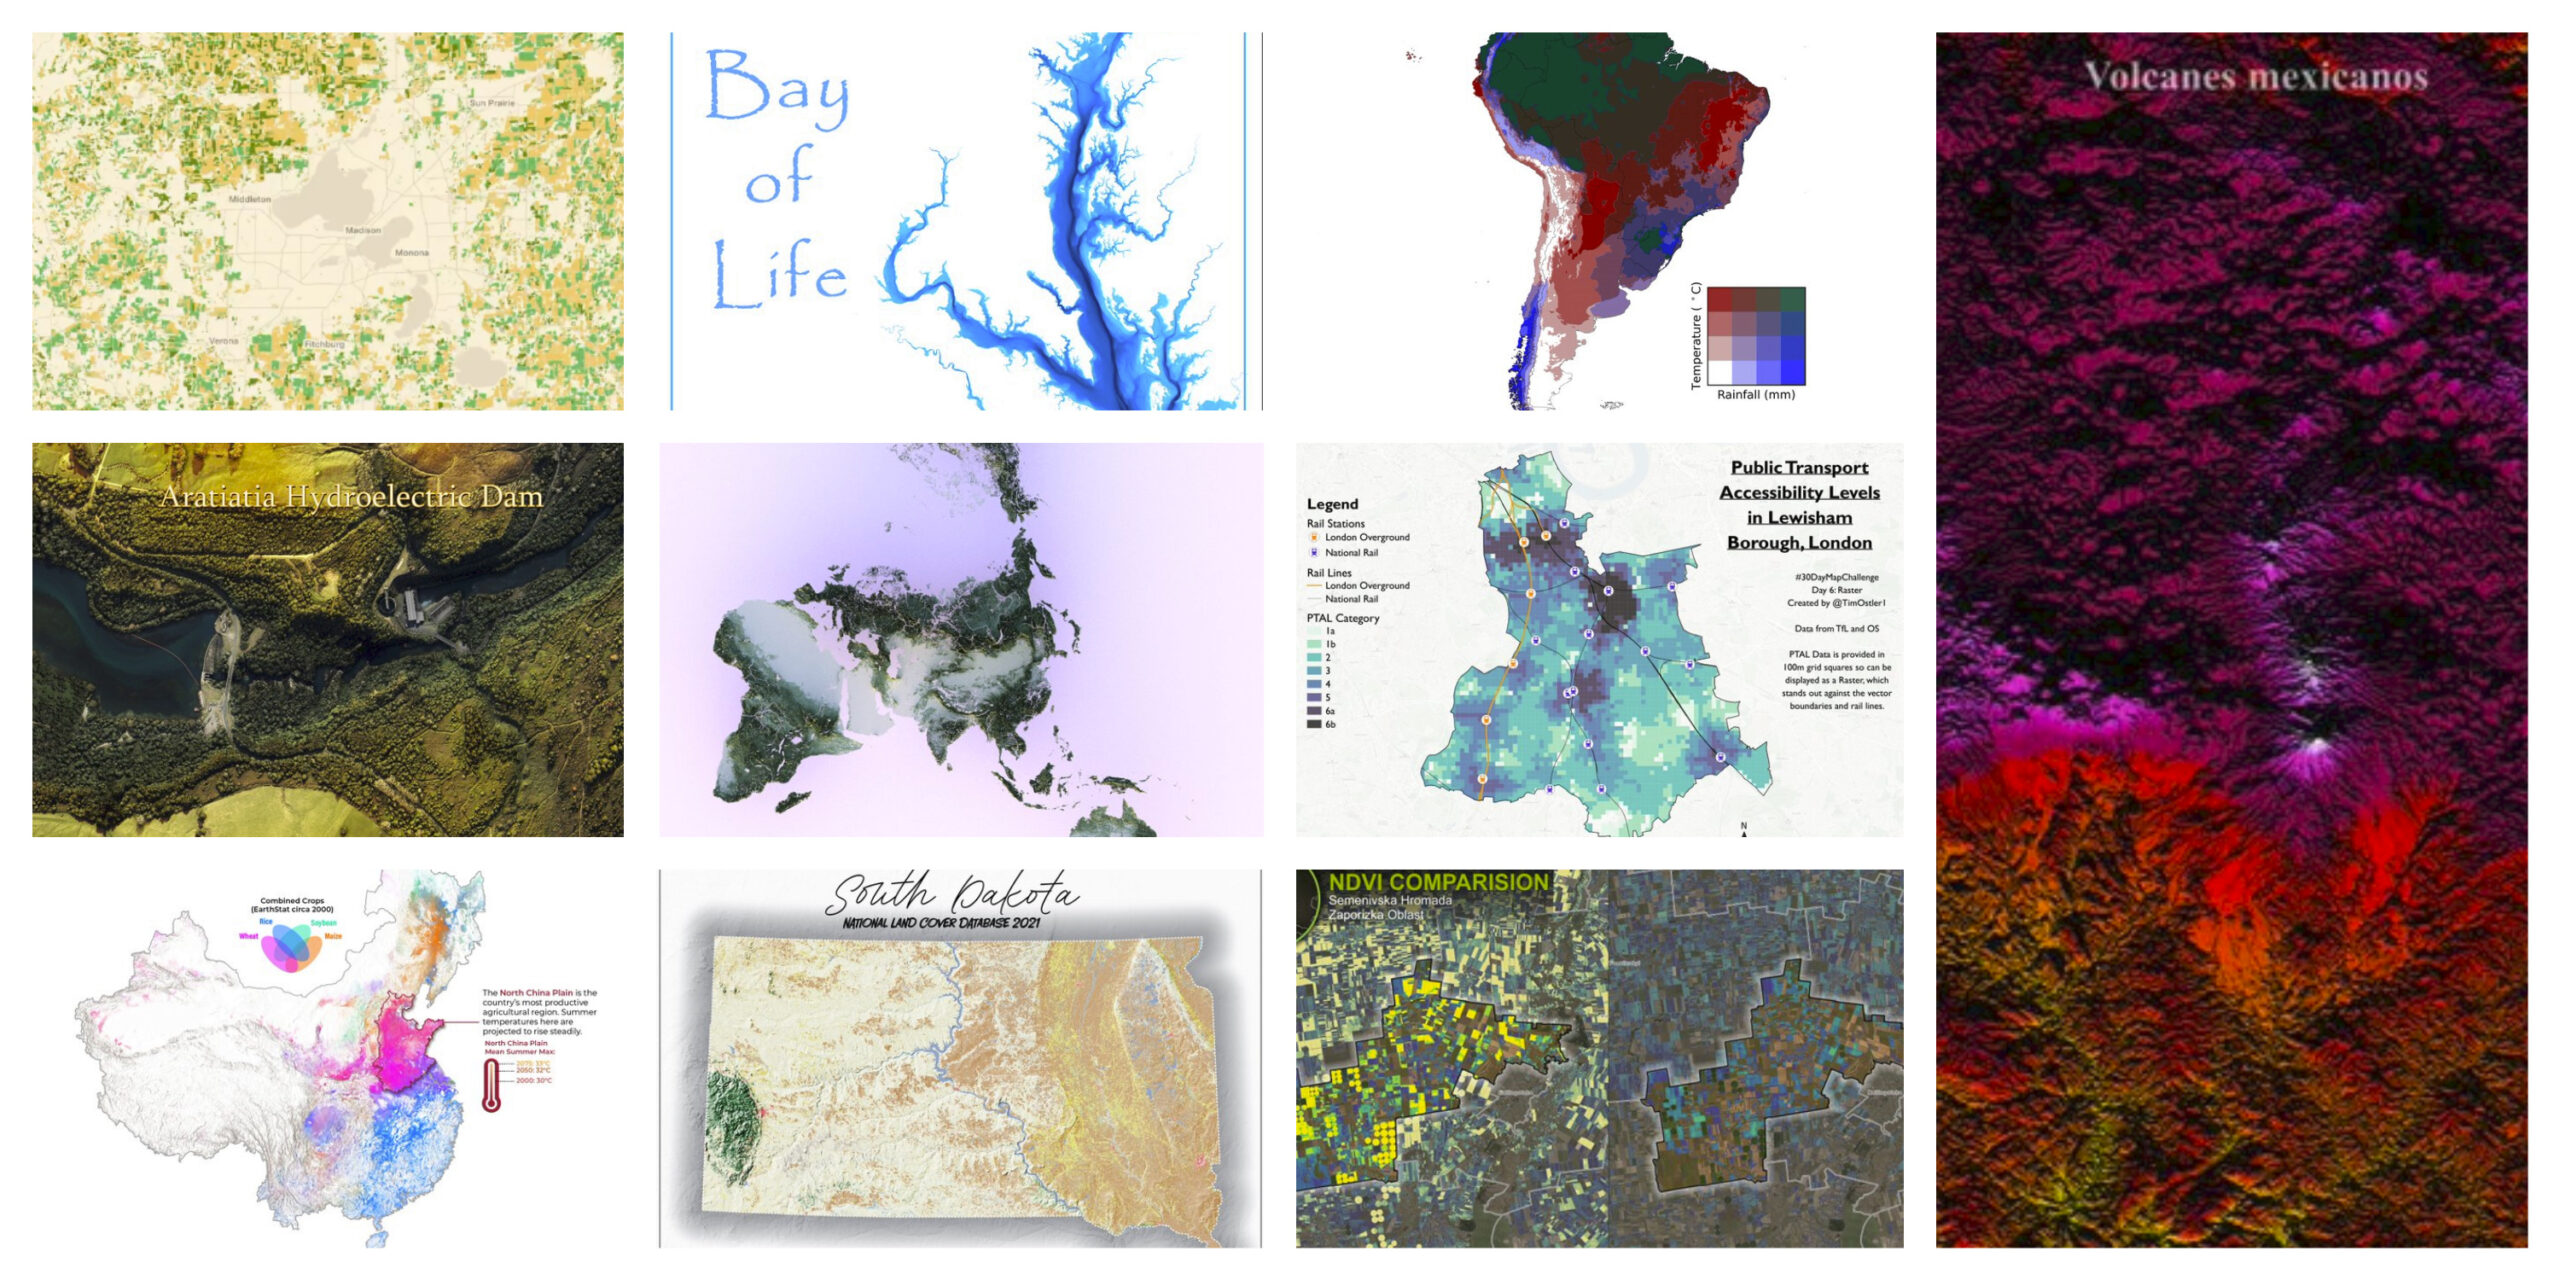
Vintage Style ?️?️
This theme let mappers add a nostalgic twist, using vintage aesthetics for modern subjects. The maps captured an old-world charm with muted colors and antique fonts while addressing contemporary topics.
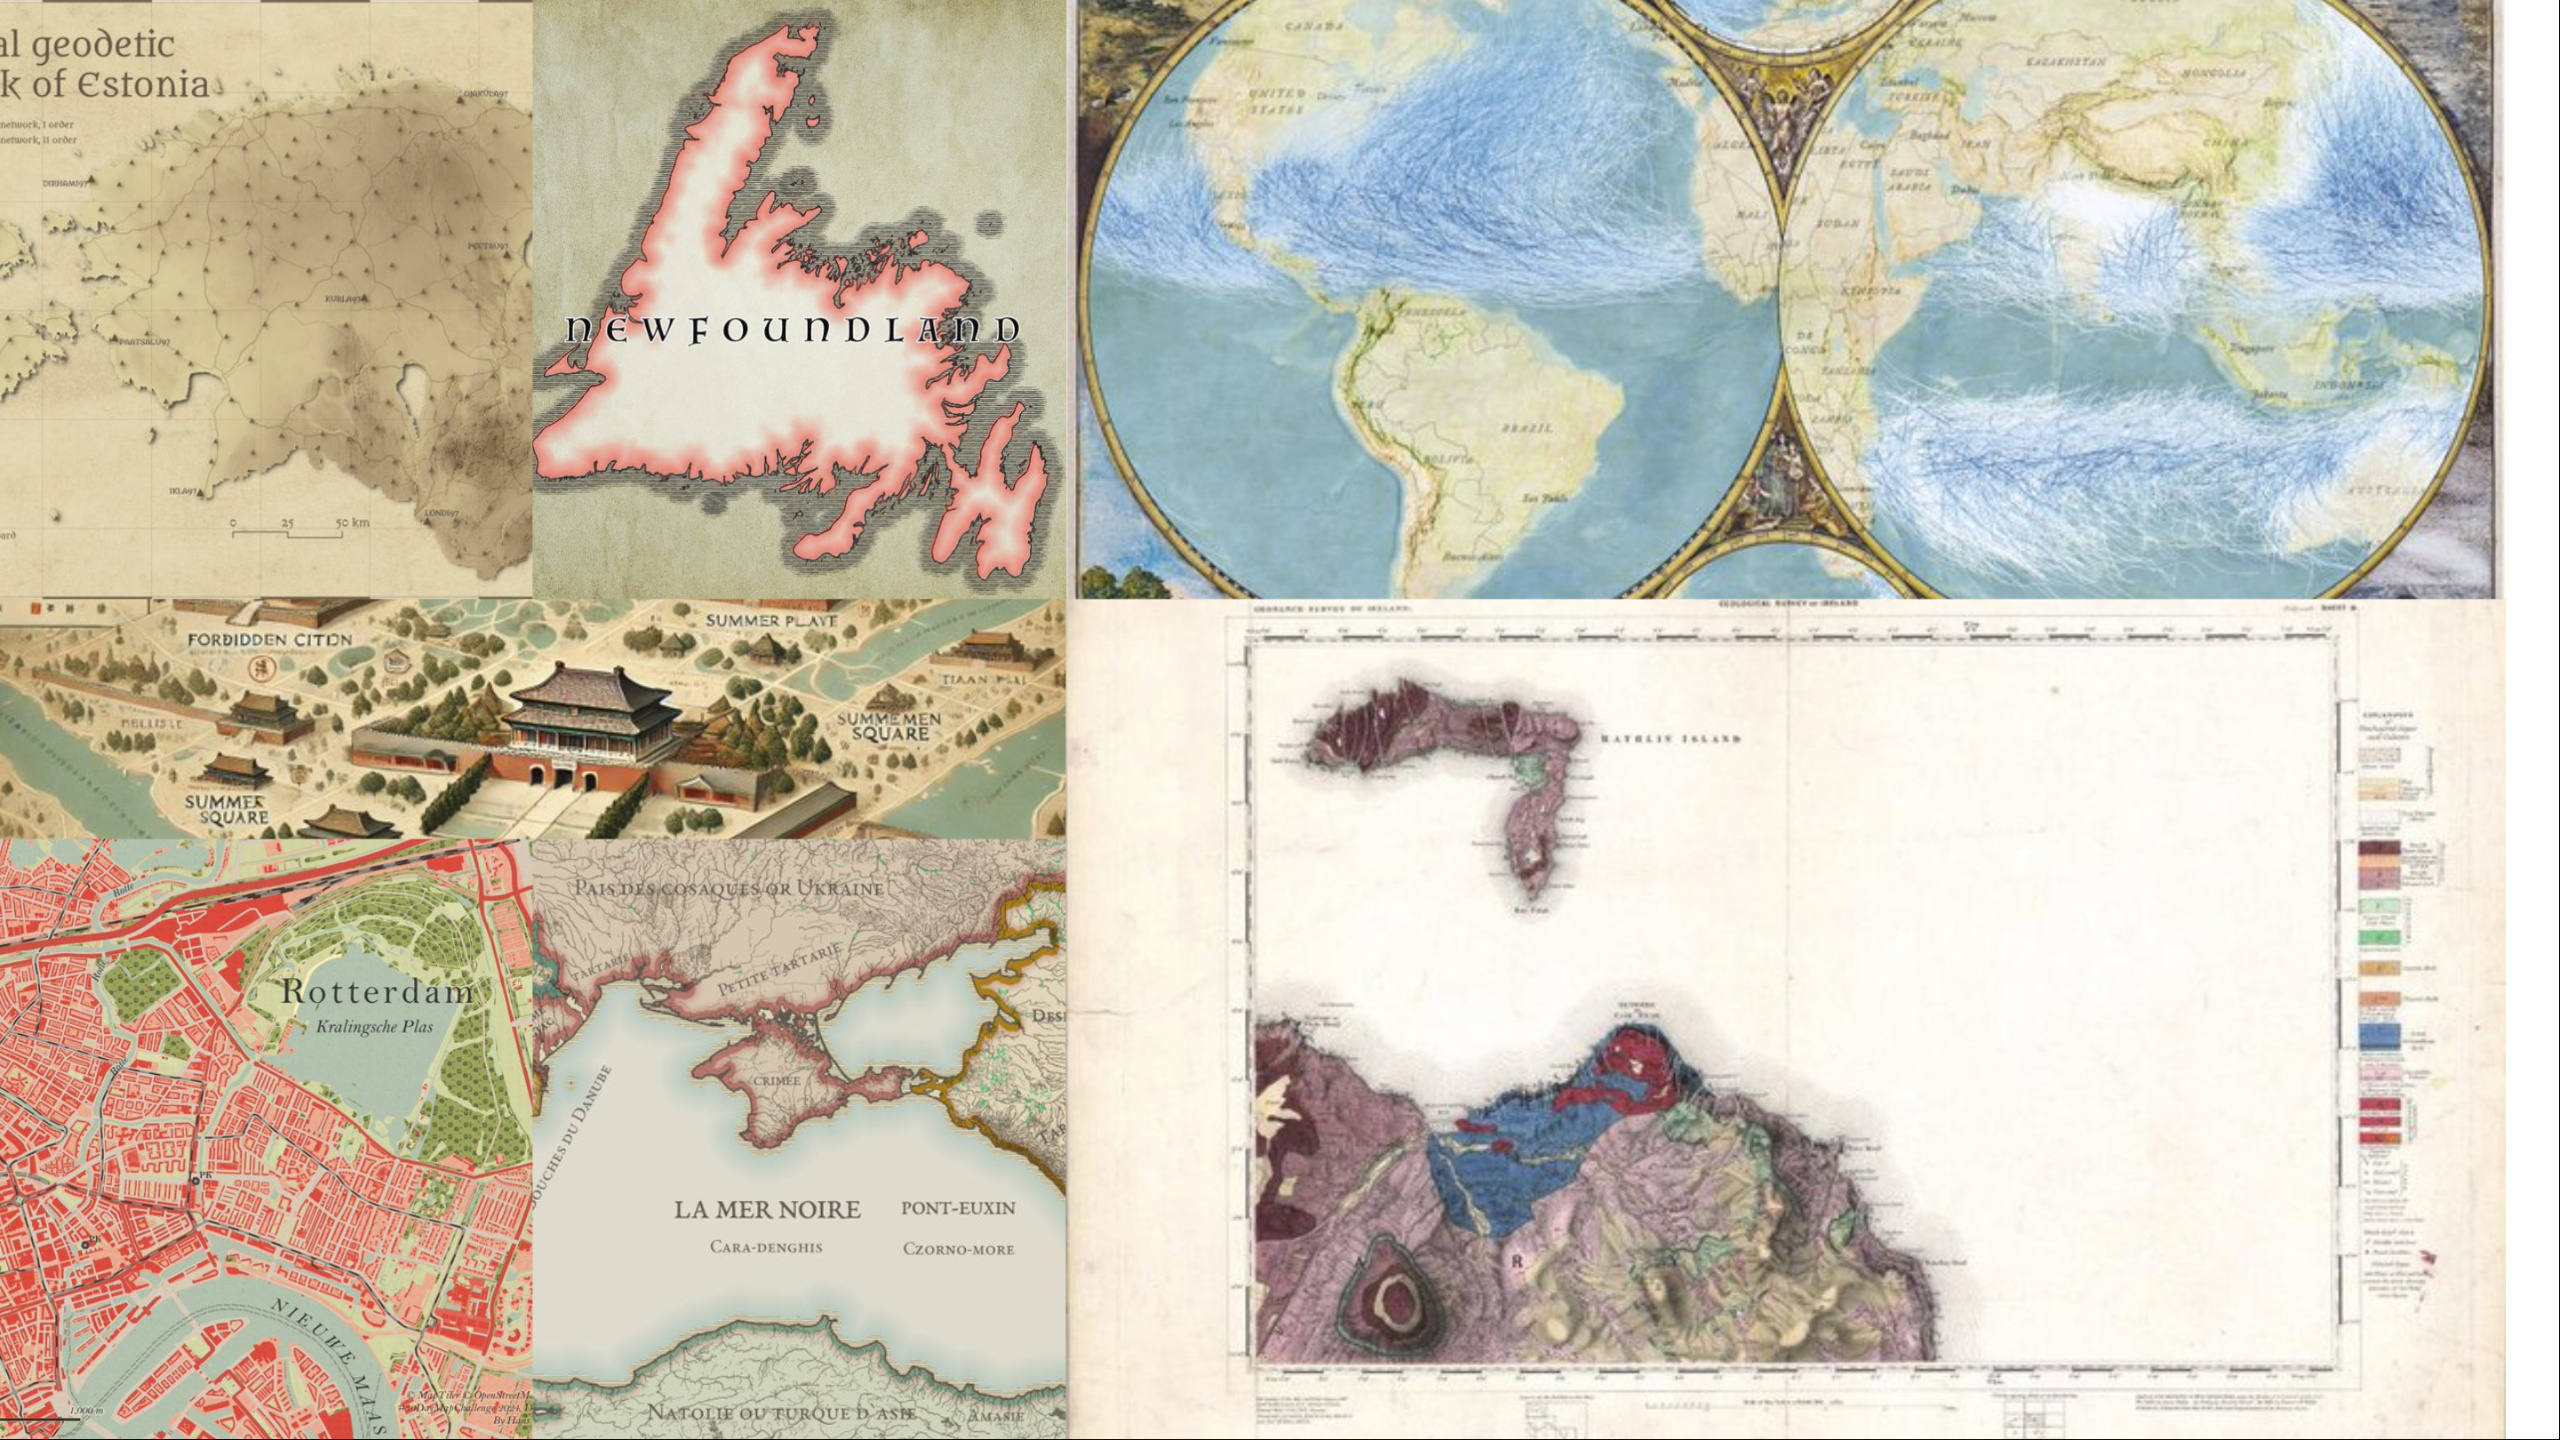
Humanitarian Data Exchange (HDX) ??
“HDX” focused on humanitarian mapping, using data from the Humanitarian Data Exchange to address issues like health, disaster response, and development. The maps brought attention to vulnerable areas, reminding us of data’s role in social impact.
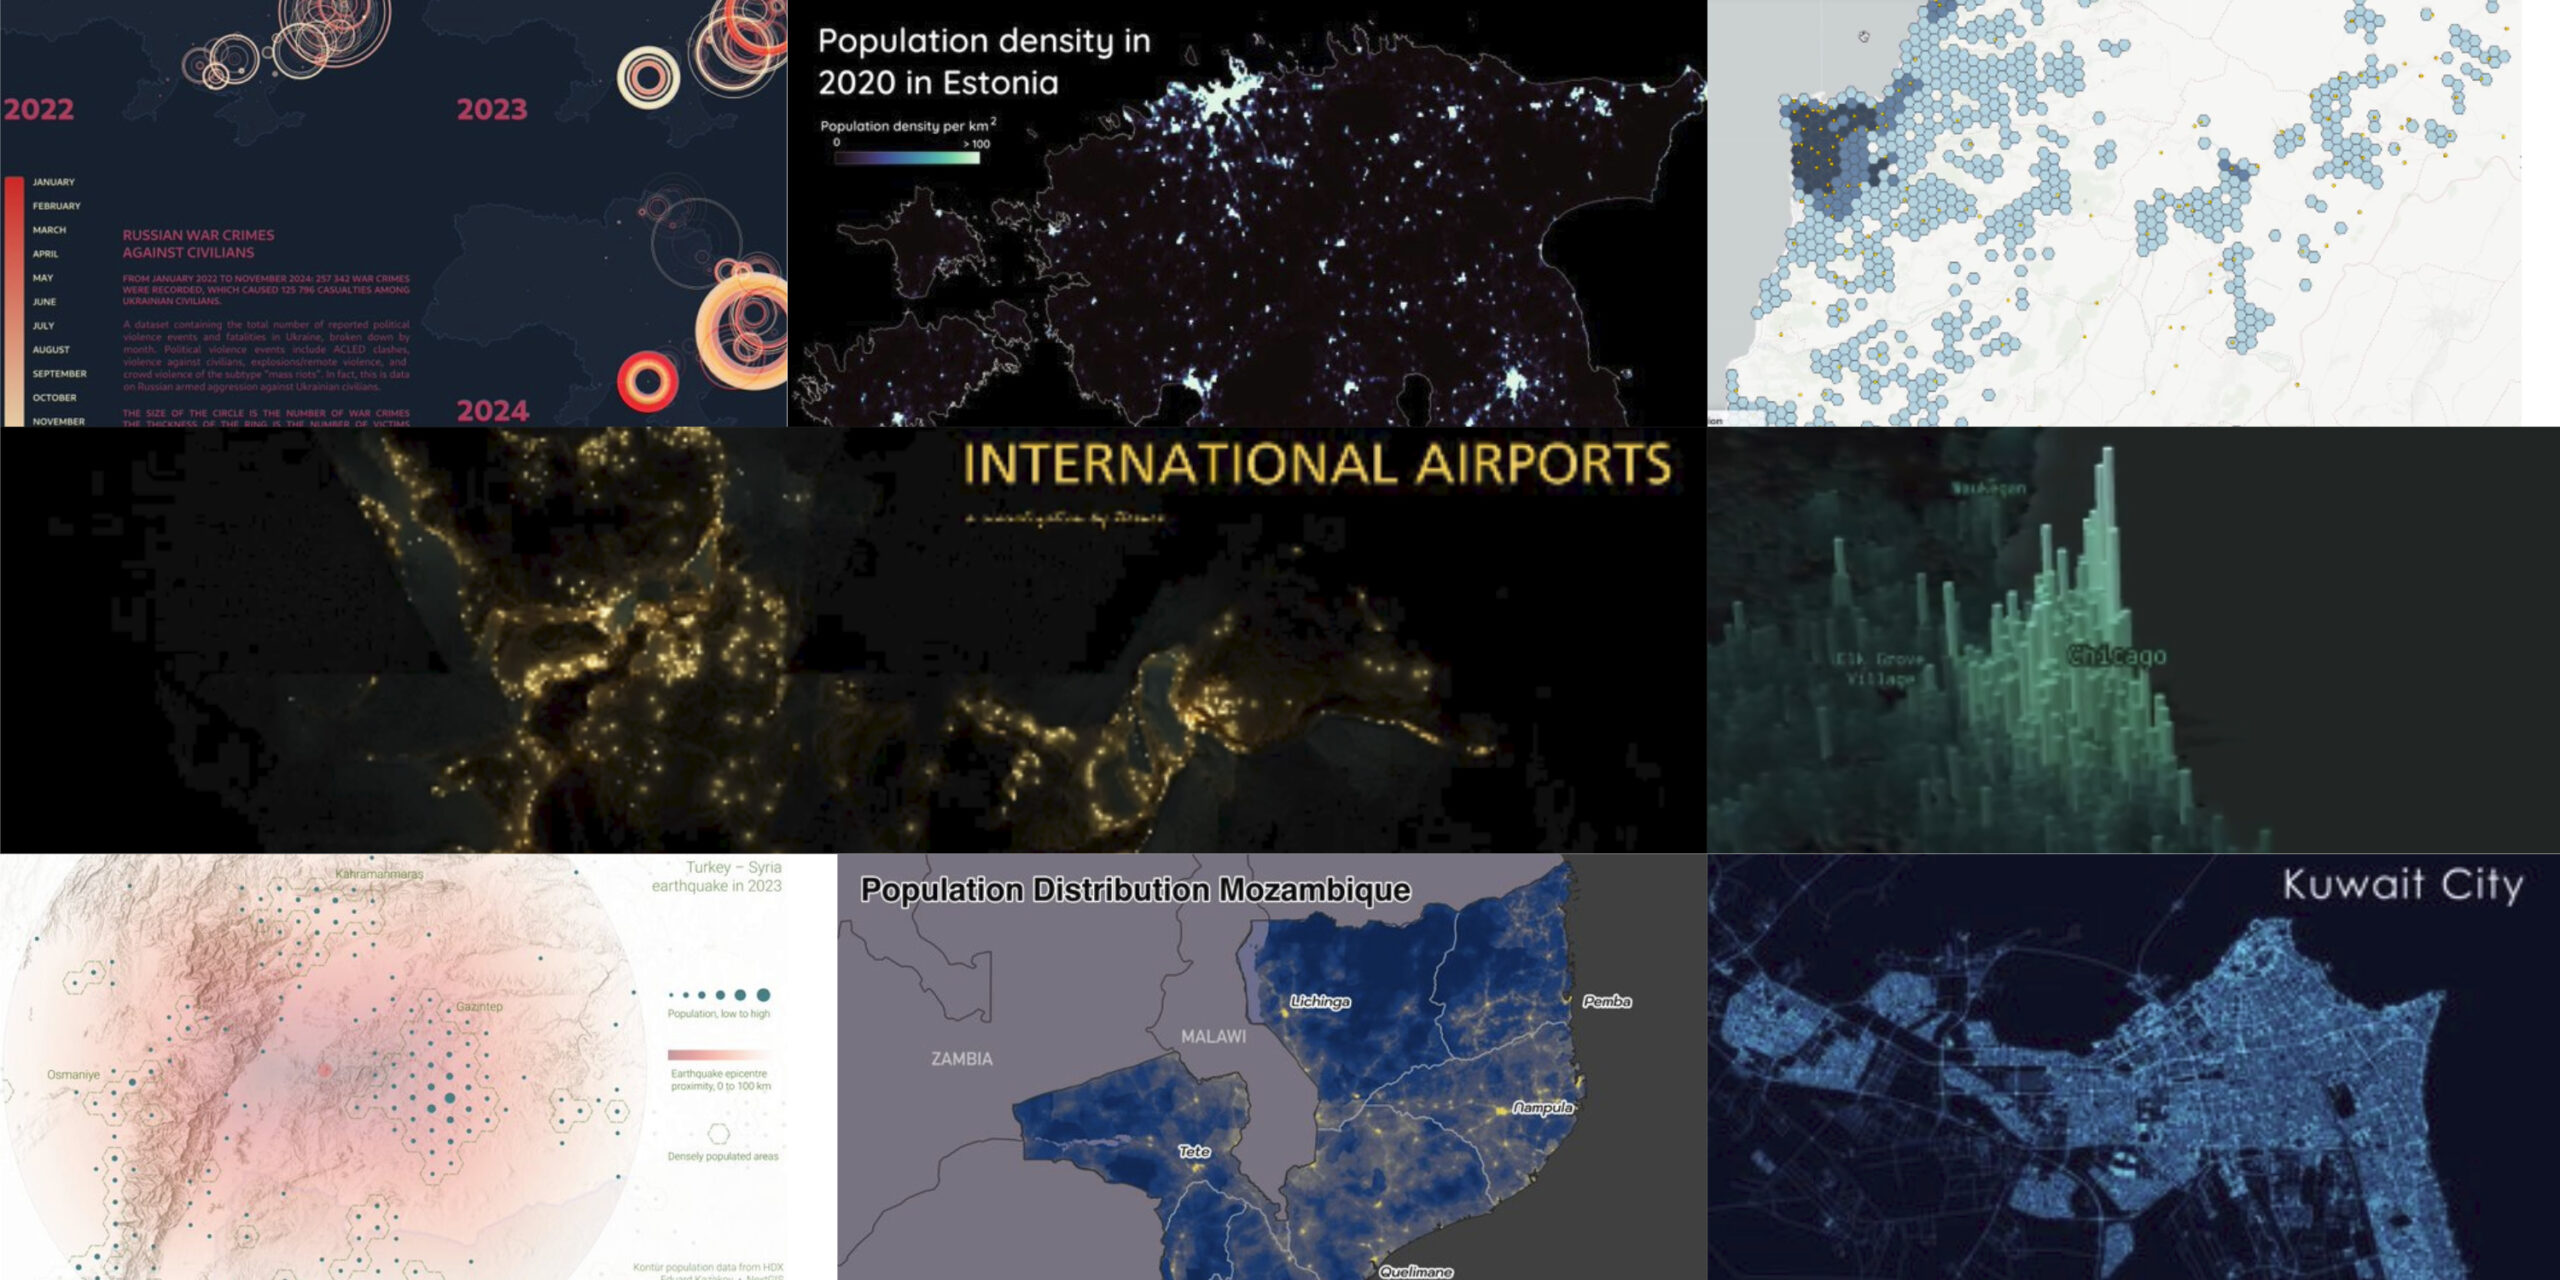
AI Only ?
On this day, participants experimented with AI tools like DALL-E and ChatGPT, using prompts to generate maps. This exercise pushed the boundaries of AI’s potential in cartography, sparking discussions on its limitations and strengths.
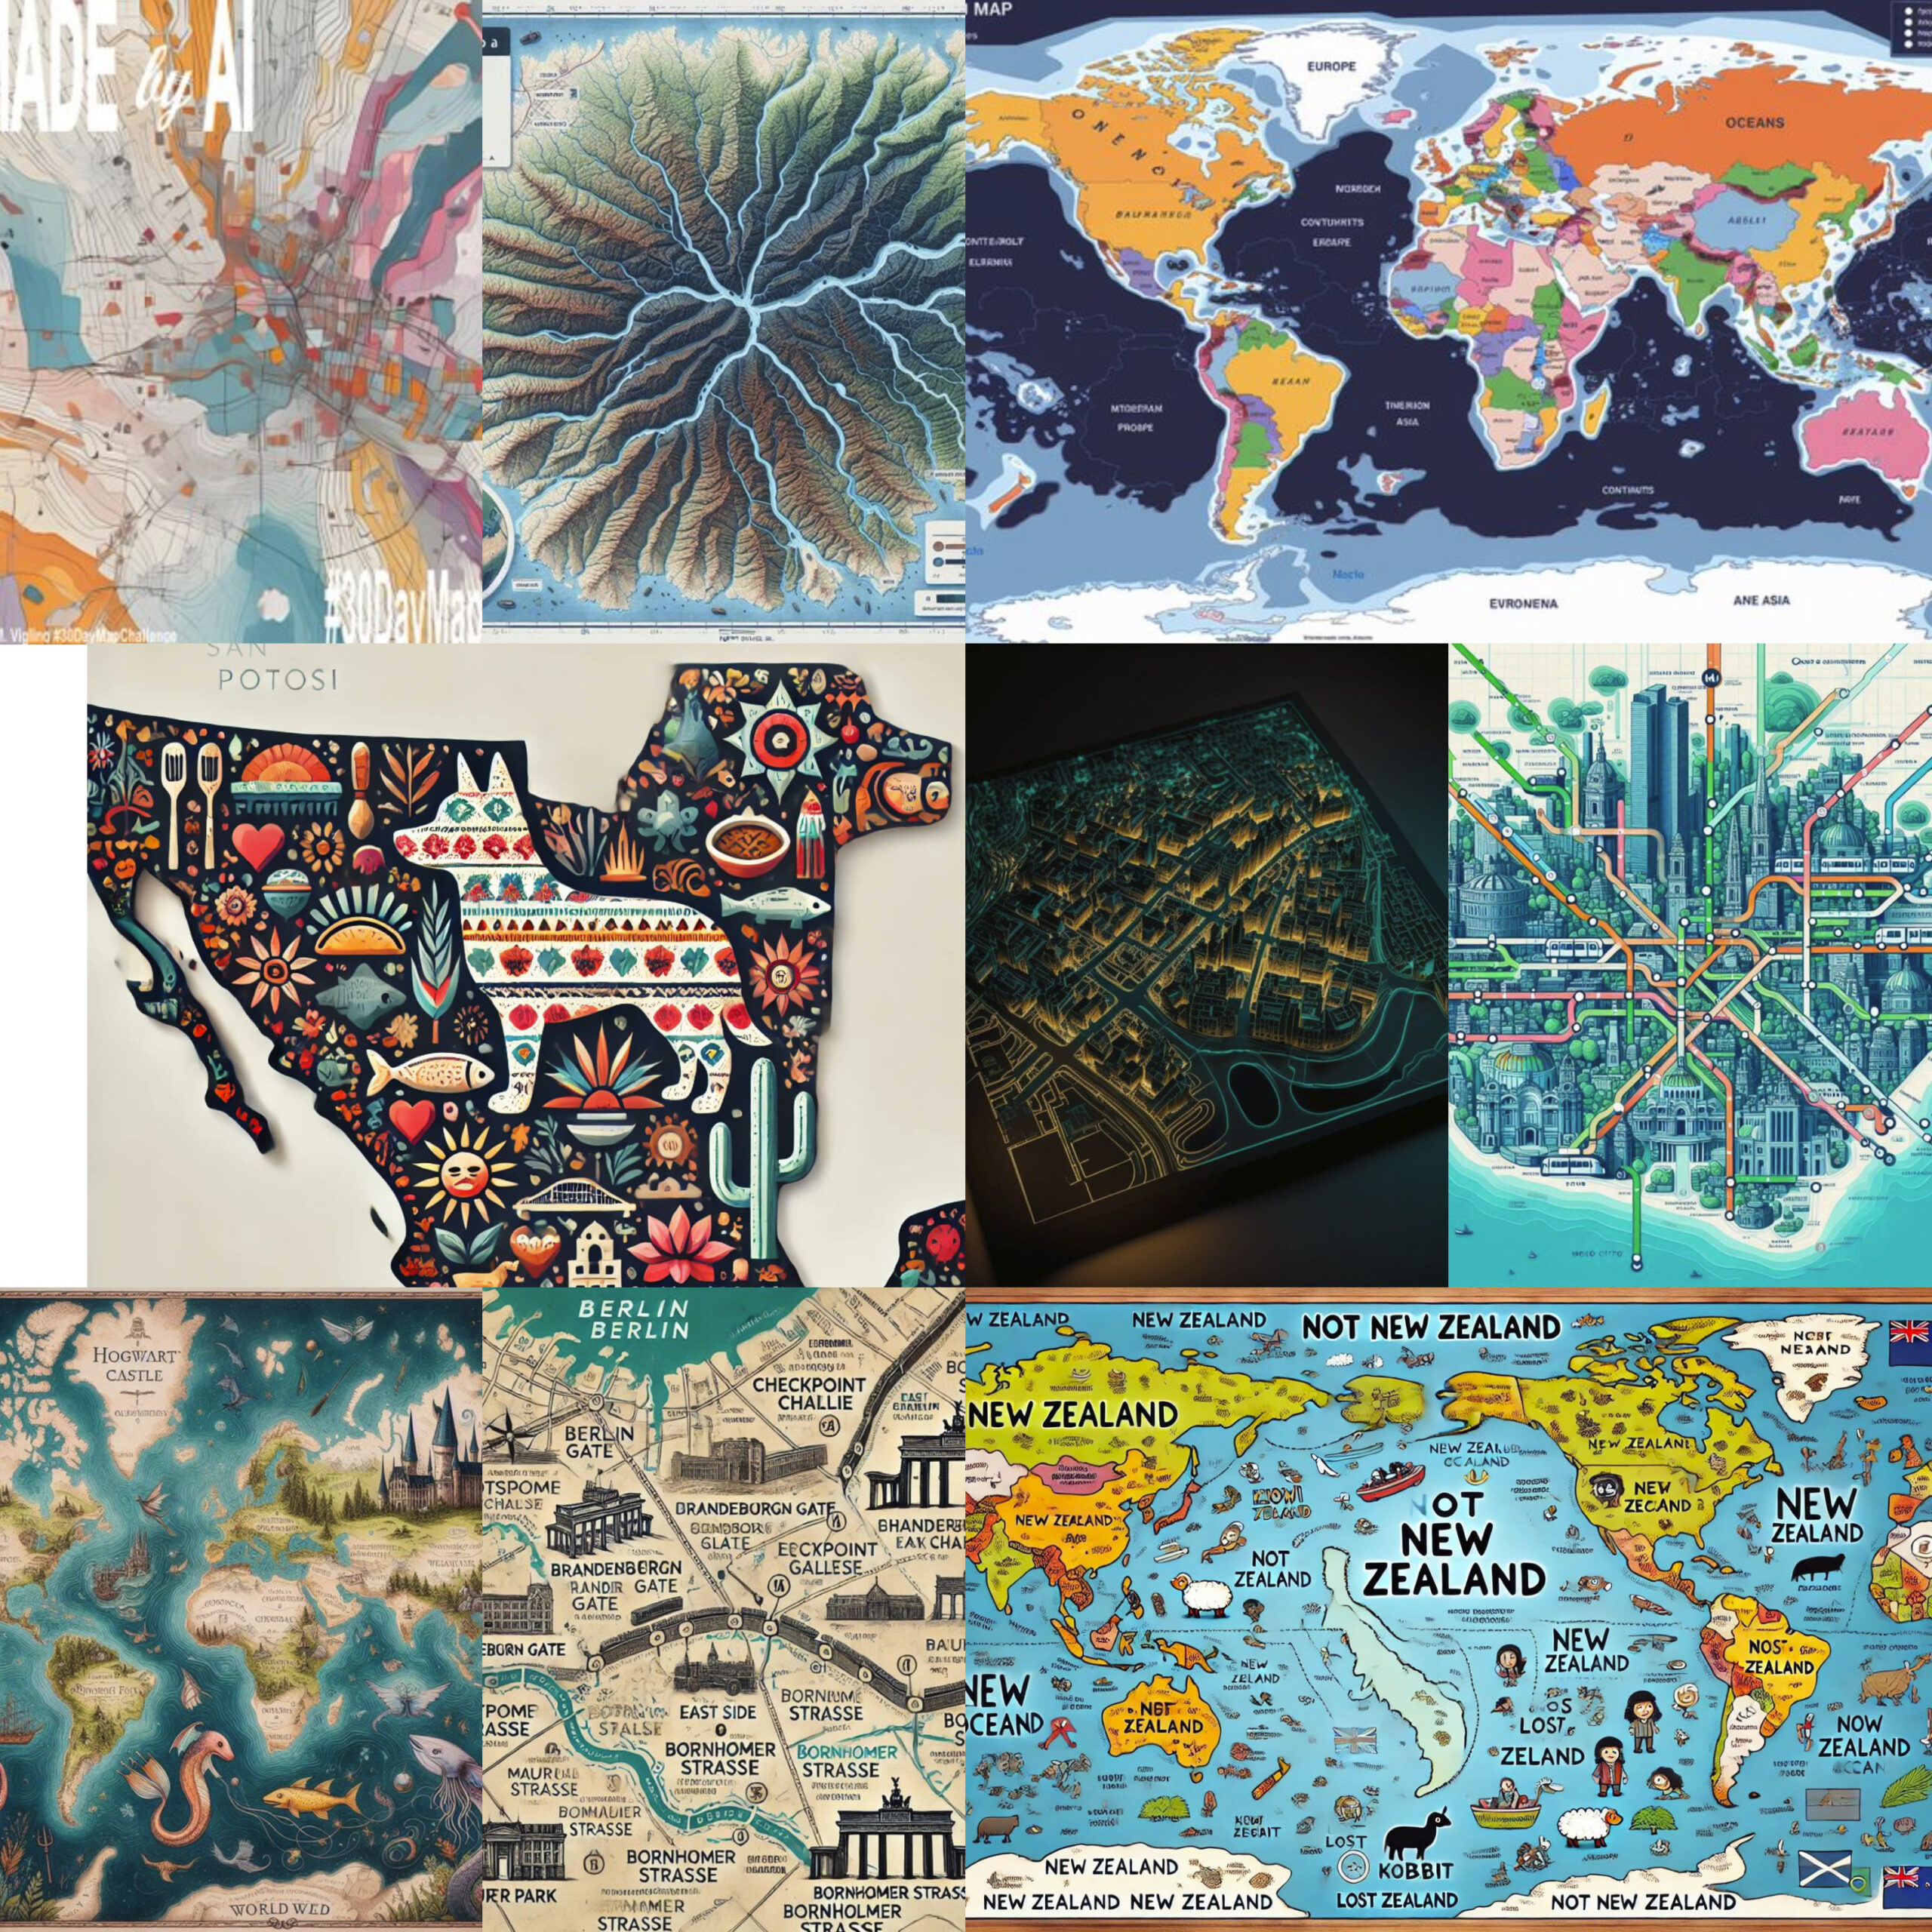
Pen & Paper ✏️?️
“Pen & Paper” day invited participants to step away from screens and draw by hand, highlighting the personal and artistic side of mapmaking. From simple sketches to detailed fantasies, each map was a unique piece of analog creativity.
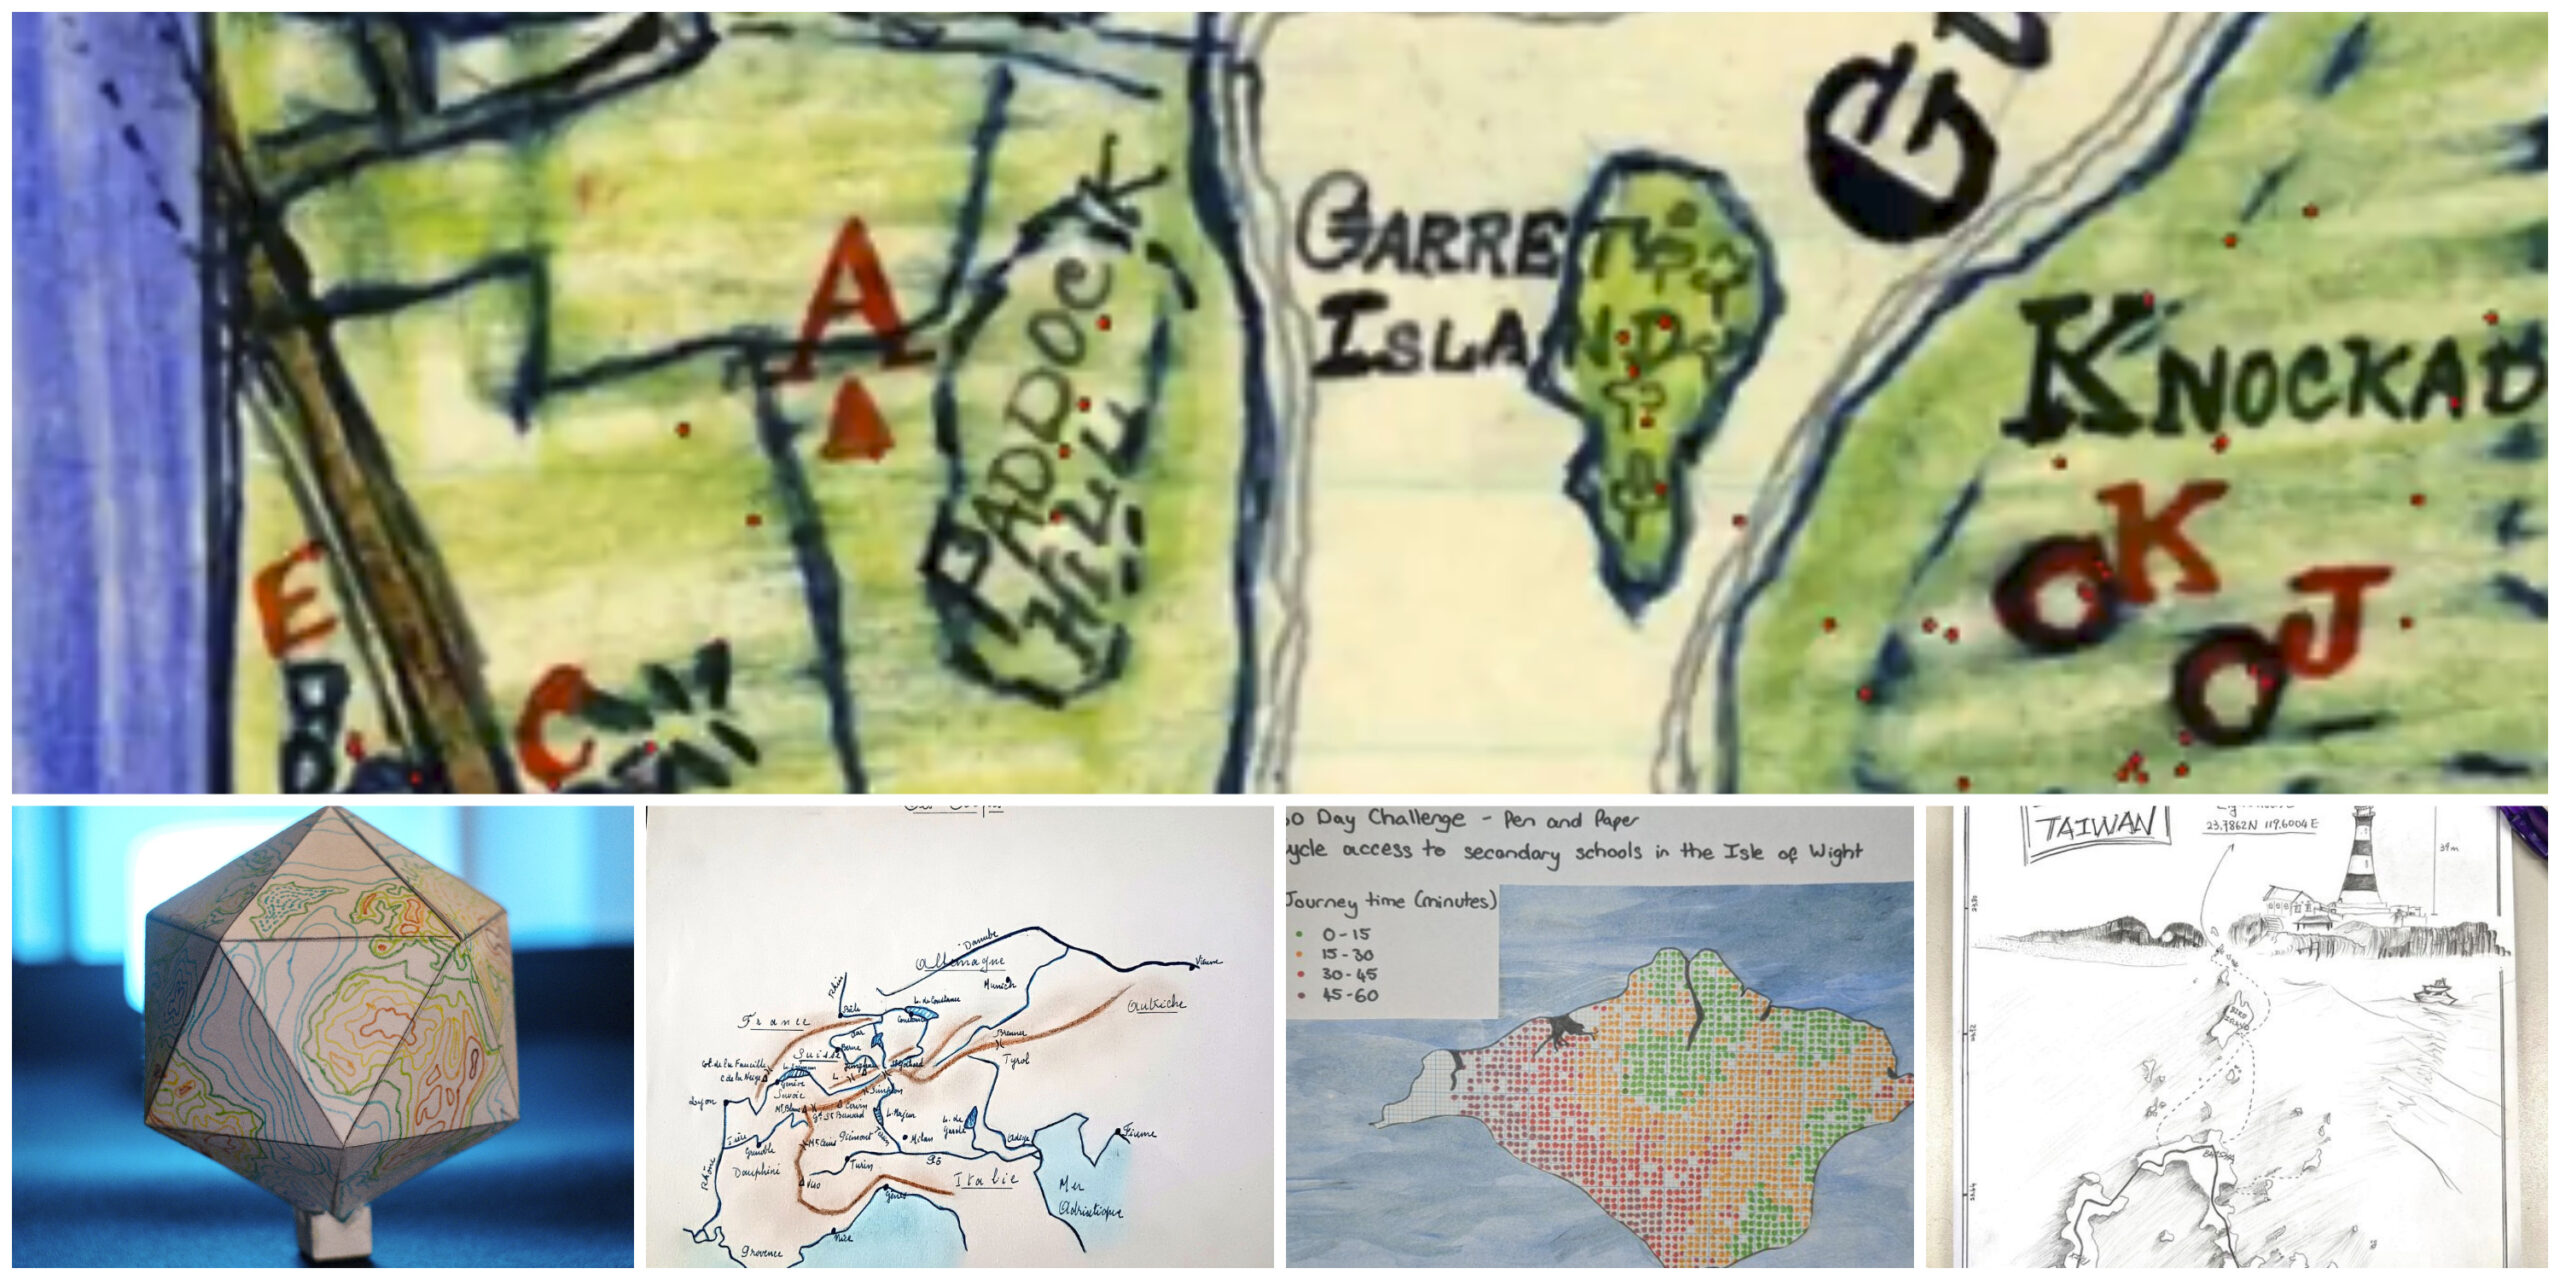
Arctic ❄️?
Maps of the Arctic emphasized critical topics like ice coverage, wildlife habitats, and climate change effects, reminding viewers of the urgent environmental issues affecting polar regions.
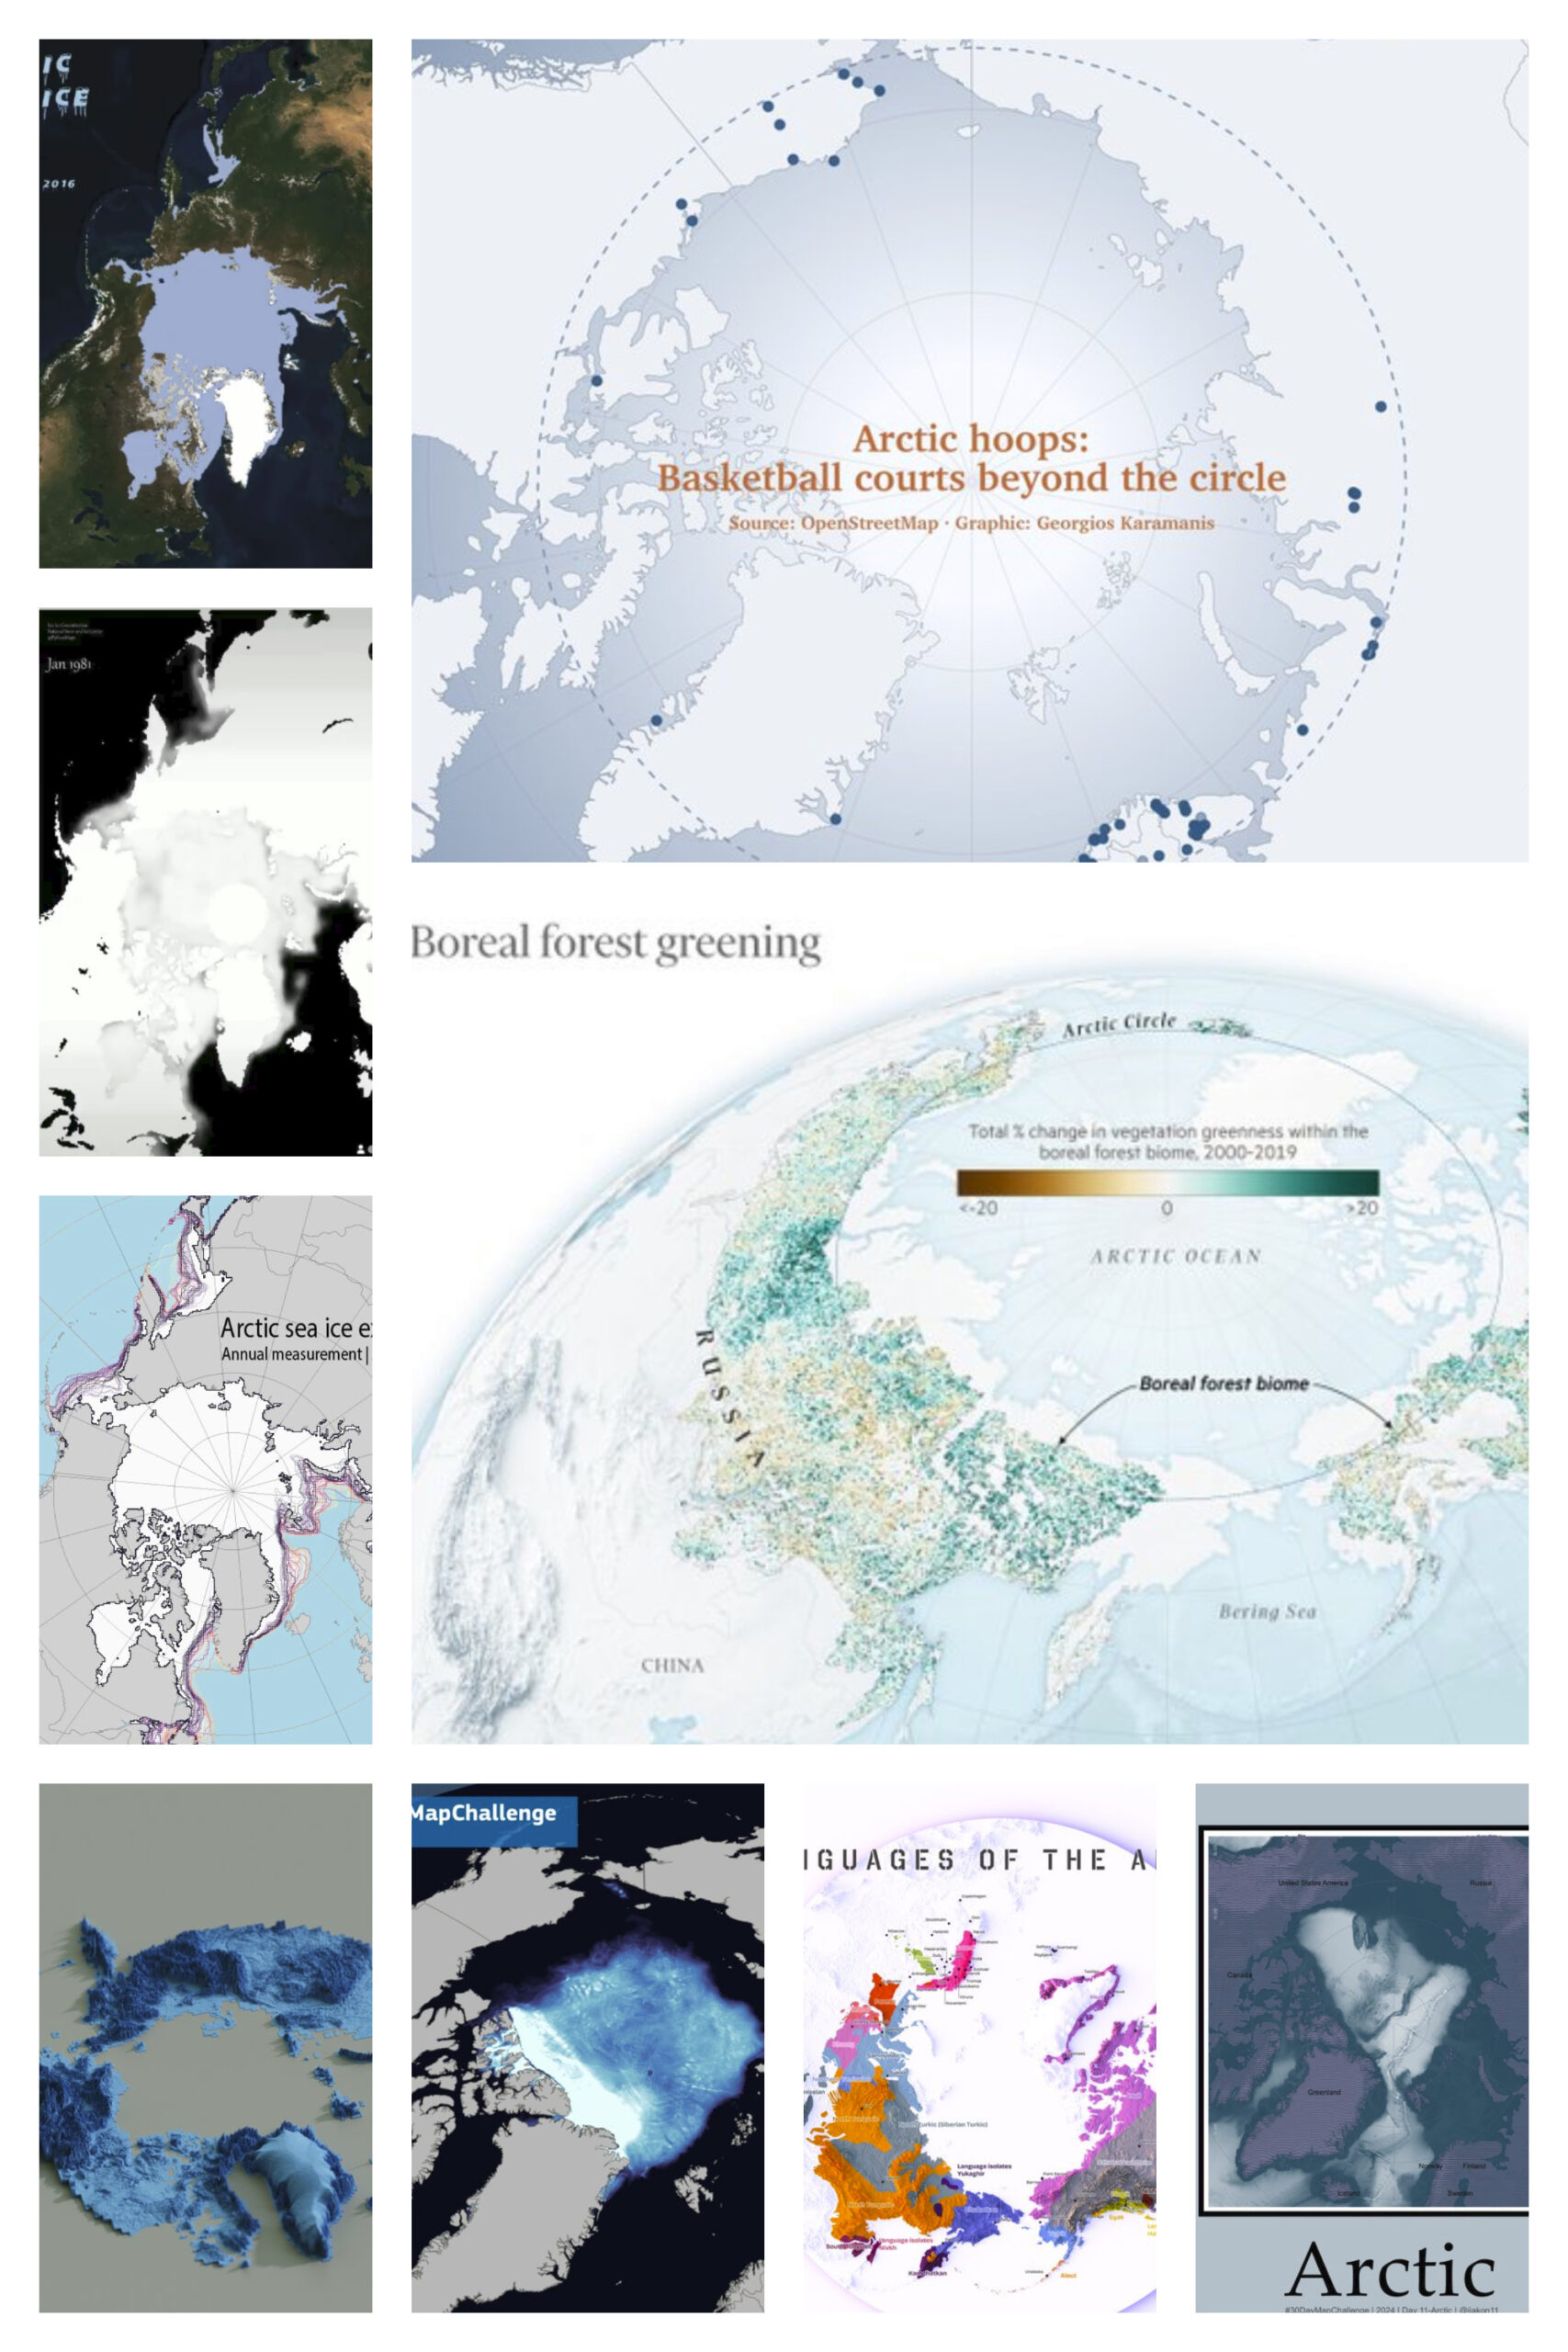
Time and Space ⏳?
Mapping time allowed participants to show change over periods, from urban expansion to wildlife migration. This theme highlighted the relationship between geography and time, bringing dynamics into spatial data.
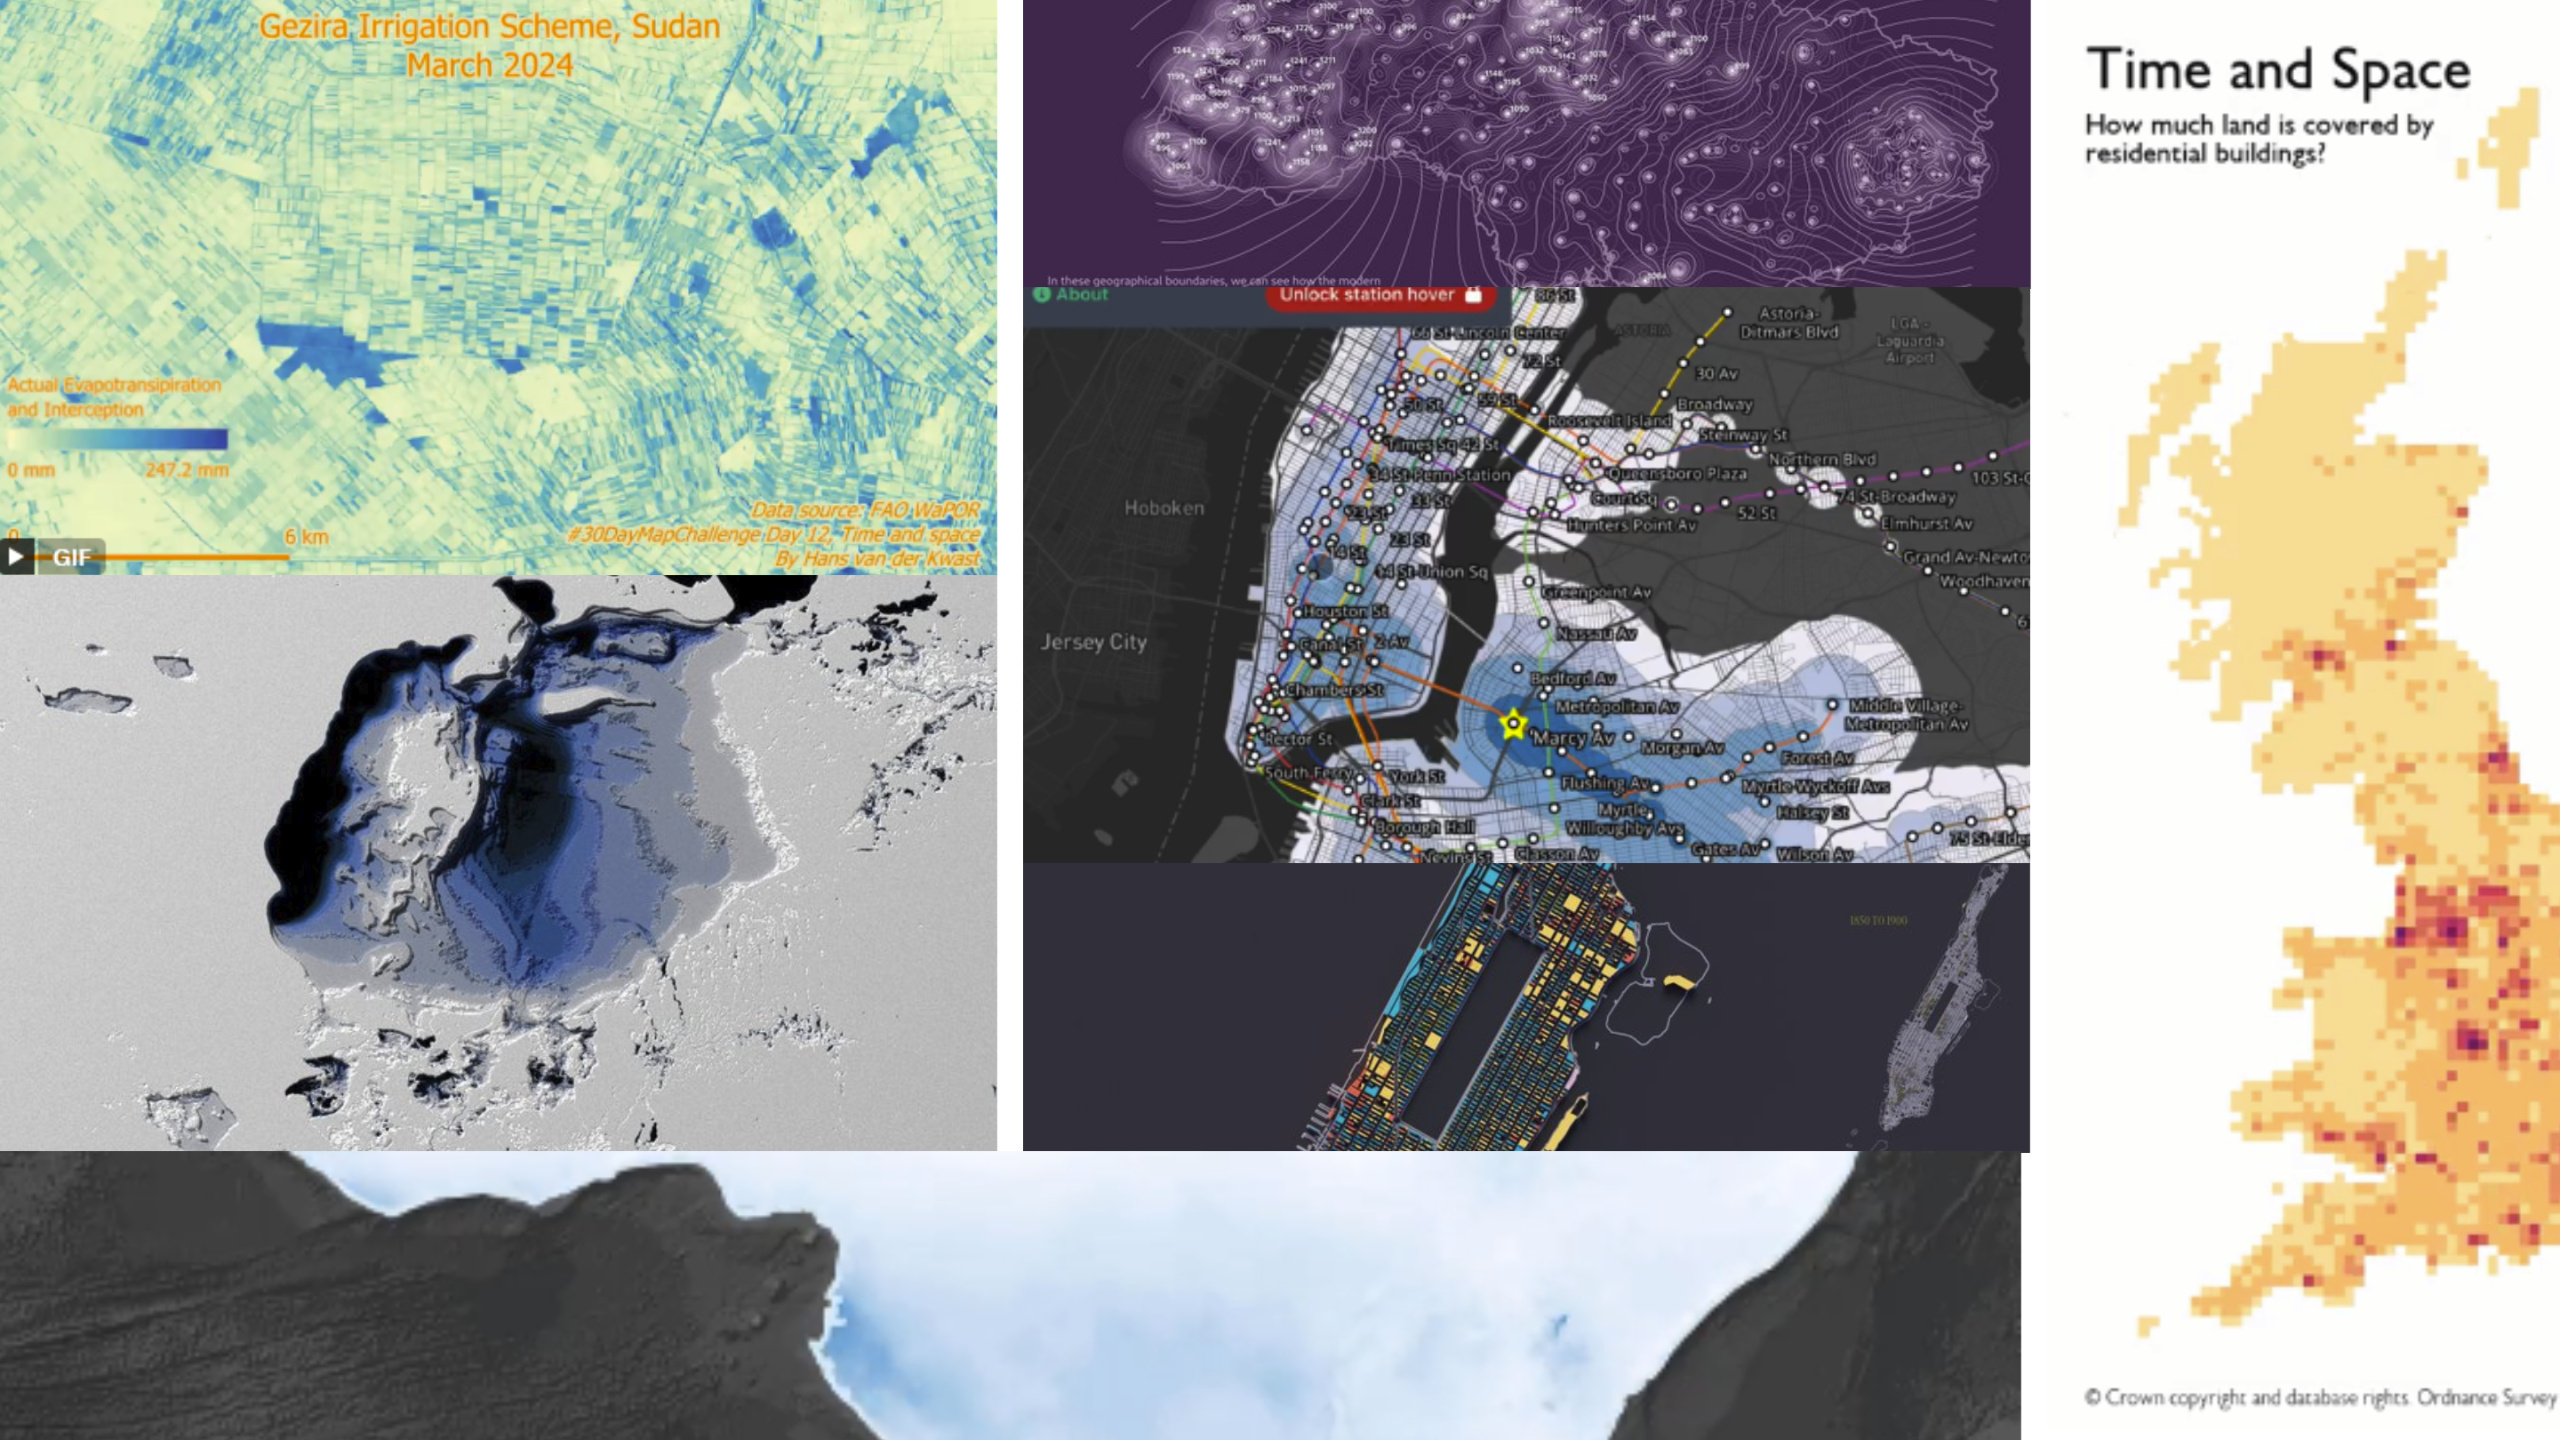
A New Tool ??
On the thirteenth day, participants tried out new tools or techniques, staying true to the challenge’s spirit of experimentation. From 3D visualizations to artistic interpretations, this day showcased the thrill of learning something new.
These first 13 themes of the #30DayMapChallenge illustrate the range and creativity in the cartography community. The challenge continues, promising even more inspiring contributions as mappers try to map the remaining topics.
Sources
https://x.com/fede_gaspari/status/1852251732086018157
https://x.com/oh_sk/status/1852264030984880484
https://x.com/nextgis/status/1852250773809230230
https://x.com/geo_alyaqout/status/1852387513609892150
https://x.com/Kenneth_KHW/status/1852300883142549890
https://x.com/ceren_do/status/1852404159741600252
https://x.com/researchremora/status/1852529323367907540
https://x.com/gontsa/status/1852449613665411450
https://x.com/XenonGT/status/1852384564401811629
https://x.com/jrncarlock/status/1855014892266262771
https://x.com/Julian_H0ffmann/status/1853739665917907307
https://x.com/PythonMaps/status/1853493302995161436
https://x.com/Mapbox/status/1852742670633906680
https://x.com/skopmichal/status/1852838481292116360
https://x.com/fede_gaspari/status/1853389649030402151
https://x.com/BhuvanamitraS/status/1852700162671415522
https://x.com/researchremora/status/1852688224415608957
https://x.com/kyle_e_walker/status/1853089761814327487
https://x.com/IvaBrunec/status/1853232363121053723
https://x.com/ErwanRivault/status/1853062183040569682
https://x.com/evelynuuemaa/status/1852998339869986912
https://x.com/researchremora/status/1853052728320123216
https://x.com/Kenneth_KHW/status/1853069909649195238
https://x.com/geomenke/status/1853025391620862369
https://x.com/gontsa/status/1853205196232380436
https://x.com/tjukanov/status/1852969630307877074
https://x.com/MashfordMahute/status/1853089602988355773
https://x.com/jbrichman/status/1853114809291583834
https://x.com/OrdnanceSurvey/status/1853470336240558239
https://x.com/Mapbox/status/1853482649068720315
https://x.com/felt/status/1853489932331106551
https://x.com/mapchannels/status/1853252649451172222
https://x.com/JackSapoch/status/1853508208045818367
https://x.com/kyle_e_walker/status/1853452143971434698
https://x.com/geokaramanis/status/1853469941833331132
https://x.com/oh_sk/status/1853408025270186140
https://x.com/evelynuuemaa/status/1853363807998902552
https://x.com/IvaBrunec/status/1853589870612021437
https://x.com/sdbernard/status/1854230197714690497
https://x.com/ErwanRivault/status/1853780808781140465
https://x.com/gontsa/status/1853953677683466719
https://x.com/eye_am_the_i/status/1853847795909714159
https://x.com/researchremora/status/1853925623183380674
https://x.com/oh_sk/status/1854136763809141176
https://x.com/SouthCrossMaps/status/1855404253235581181
https://x.com/GWSCatUA/status/1854276614558802062
https://x.com/MapsChartsData/status/1856195295136096735
https://x.com/researchremora/status/1854223275884175649
https://x.com/XenonGT/status/1854216790949105712
https://x.com/PythonMaps/status/1854931890748240190
https://x.com/TimOstler1/status/1854097705049391223
https://x.com/AlcisGeo/status/1854205856713236636
https://x.com/JosArturoJasso/status/1854402013175455867
https://x.com/evelynuuemaa/status/1854443646554132520
https://x.com/MapsChartsData/status/1856196104921944345
https://x.com/c_yatteau/status/1856373524128026731
https://x.com/jacobmac02/status/1855977905458675932
https://x.com/hansakwast/status/1854425001270653185
https://x.com/gontsa/status/1854650482066870291
https://x.com/GeoSurveyNI/status/1854432662380843203
https://x.com/TheYuanLiao/status/1855188041318461721
https://x.com/geodatascience/status/1854856399471165518
https://x.com/researchremora/status/1854864795649933497
https://x.com/gontsa/status/1855063834387513806
https://x.com/oh_sk/status/1854852346422911285
https://x.com/jacobmac02/status/1855979732497473845
https://x.com/evelynuuemaa/status/1854807823156494401
https://x.com/geo_alyaqout/status/1854915271758123408
https://x.com/nextgis/status/1854785401648472142
https://x.com/jmviglino/status/1855145842178449430
https://x.com/Mapologies_com/status/1855185175421874244
https://x.com/evelynuuemaa/status/1855250324086235466
https://x.com/athnfrnclr/status/1856439926620836058
https://x.com/mildthing99/status/1855037220677124518
https://x.com/hansakwast/status/1855186588986184155
https://x.com/AlcisGeo/status/1855293020112925079
https://x.com/OrdnanceSurvey/status/1855218952525251033
https://x.com/GastonEchenique/status/1855454120489951296
https://x.com/renorosgon/status/1855645758252290194
https://x.com/MaiGhalyGazzar/status/1855290002432790536
https://x.com/undertheraedar/status/1855196452009464241
https://x.com/AlandcoC/status/1855546846359286079
https://x.com/nextgis/status/1855562886631887080
https://x.com/mildthing99/status/1855408669636116598
https://x.com/basemap/status/1855566069978542528
https://x.com/jjakon11/status/1855754593889927215
https://x.com/geokaramanis/status/1855954998925897886
https://x.com/hansakwast/status/1855859502442008661
https://x.com/sdbernard/status/1856275572235587766
https://x.com/PythonMaps/status/1856446245054681520
https://x.com/eye_am_the_i/status/1856448896777498656
https://x.com/kai_sonder/status/1855989027951833198
https://x.com/CMEMS_EU/status/1855890712467751411
https://x.com/researchremora/status/1856025139655086347
https://x.com/jjakon11/status/1856159442498400604
https://x.com/gontsa/status/1856474790825017775
https://x.com/IvaBrunec/status/1856337606297952313
https://x.com/Mapbox/status/1856381452843393340
https://x.com/OrdnanceSurvey/status/1856376315110133923
https://x.com/researchremora/status/1856350965915426948
https://x.com/nextgis/status/1856241145224802471
https://x.com/hansakwast/status/1856246957691257118
https://x.com/maaamet/status/1856651606374203459
https://x.com/researchremora/status/1856797227504865742
https://x.com/GeoWithJustin/status/1856789887569059955
https://x.com/IvaBrunec/status/1856709487563813077
https://x.com/laMartu30/status/1856653972460757405
https://x.com/geomenke/status/1856725882531979675
https://x.com/joseph_barbier/status/1856609596430860572
How do you like #30DayMapChallenge initiative? Read more and subscribe to our monthly newsletter!
