

ICEYE built its reputation by making synthetic aperture radar imagery faster, cheaper and more operationally useful. Now it wants to own something much heavier: access to orbit.
On 17 November, the Finnish Earth observation company announced an all-cash offer for Italian rocket and propulsion manufacturer Avio. The offer values Avio’s equity at approximately €2.05 billion, or €41 per share. That represents a 21.3% premium to Avio’s previous closing price and a 34.8% premium to its three-month volume-weighted average price.
If completed, the deal would combine one of Europe’s most important commercial SAR operators with the company behind the Vega C launcher, the future Vega E and major solid-propulsion components used by Ariane 6.
That is a much bigger strategic move than a conventional supplier acquisition.
From satellite operator to integrated space group
ICEYE currently controls a growing constellation, radar payload technology, ground systems and an intelligence-delivery platform. Avio would add launch vehicles, propulsion engineering, manufacturing infrastructure and deep relationships with European institutions.
The pitch is easy to understand. Europe wants more sovereign control over critical space infrastructure, while governments increasingly buy intelligence capabilities as complete systems rather than as individual images or satellites. A group able to provide radar spacecraft, data, analytics and launch services could bid for much larger national programs.
ICEYE has the financial momentum to attempt it. In June, the company announced a funding round exceeding €1 billion, including €450 million of new primary capital led by General Atlantic. It said 2025 revenue exceeded €250 million, EBITDA topped €100 million and its contracted backlog was above €1.5 billion. Those figures are company-reported, but they help explain how a private satellite company can contemplate buying a listed industrial group.
Avio brings a different kind of scale. Its 2025 backlog reached €2.17 billion, supported by European institutional launch programs and defense propulsion work.
The industrial logic is not automatic
Vertical integration sounds attractive, but ICEYE does not need a dedicated Vega launch for every radar satellite. Small SAR spacecraft are well suited to rideshare missions, and launch economics depend on cadence, reliability and customer mix, not simply common ownership.
Avio’s value also extends far beyond ICEYE’s constellation. Its future depends on European Space Agency programs, national defense customers and demand from third-party satellite operators. The combined company would therefore need to preserve Avio as a credible supplier to the wider market, including customers that may compete with ICEYE.
Competition is also intensifying. ArianeGroup remains central to Europe’s heavy-launch ecosystem, while Isar Aerospace, Rocket Factory Augsburg, PLD Space and MaiaSpace are pursuing new launch architectures. Brussels and ESA are actively funding a more competitive launcher market. ICEYE would be buying an incumbent platform at precisely the moment Europe is trying to diversify beyond incumbents.
Italy will decide what sovereignty means
The largest obstacle may be political rather than financial. Avio is a strategic Italian asset, and the transaction is subject to Italy’s golden-power review as well as approvals in France, the United Kingdom, the United States and under the EU Foreign Subsidies Regulation. The offer also requires acceptances representing at least 66.67% of Avio’s share capital.
Reuters reported that Rome is seeking security guarantees, continued Italian operations and a meaningful role for Leonardo, which is currently a major Avio shareholder. ICEYE has tried to anticipate that debate by pledging an additional €1 billion of investment in Italy over five years and up to 400 skilled jobs.
Those promises are strategically necessary, but they are not the same as binding long-term industrial outcomes. Governments will want clarity on intellectual property, sensitive defense programs, board control, production locations and priority access during a crisis.
The proposed acquisition captures Europe’s space dilemma in one transaction. The continent needs companies with enough scale to compete globally, but consolidation can also concentrate strategic capabilities in ways that make national governments nervous.
If ICEYE succeeds, it will no longer be best described as an Earth observation company. It will be attempting to become a European space prime, built around radar intelligence rather than around the traditional launcher or satellite-manufacturing model. Whether Europe is ready for that new center of gravity is the real question behind the €2.05 billion price tag.



#Business
Next article
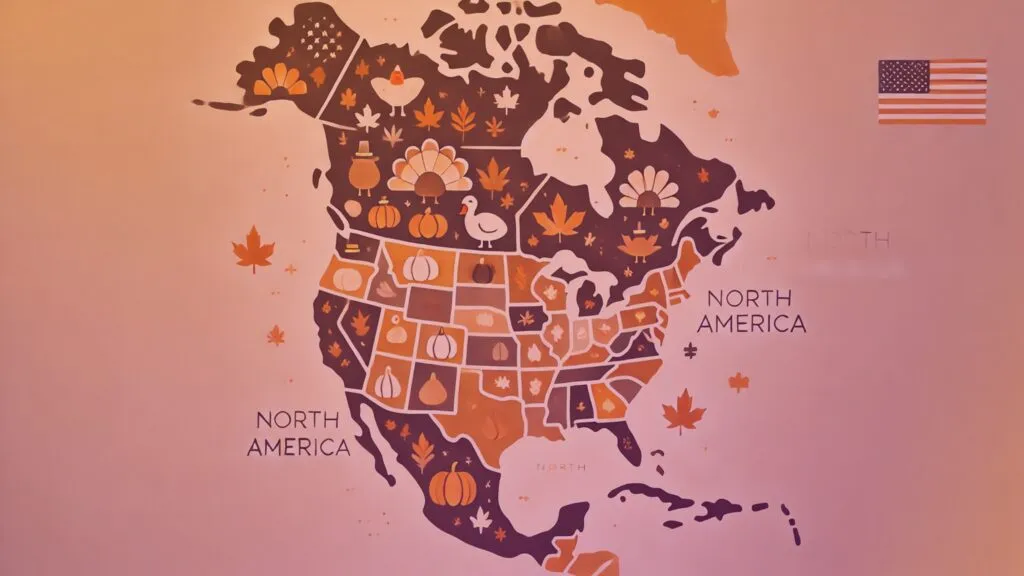
A Thanksgiving plate may look like a family tradition, but it is also a map. It connects Wampanoag homeland with turkey farms, cranberry bogs, pumpkin fields, regional food loyalties, airport networks, highways, and weather patterns. Even the last-minute search for a pie has its own geography.
The maps and charts in this collection reveal how Thanksgiving is produced, priced, cooked, moved, and remembered across the United States. They trace where the food comes from, what different states put on the table, how millions of people get home, and what happens when plans meet traffic, weather, and grocery-store reality.
Together, they show that there is no single map of Thanksgiving. The picture changes with the data, the method, and the question being asked.
1. The origin map, with a caveat
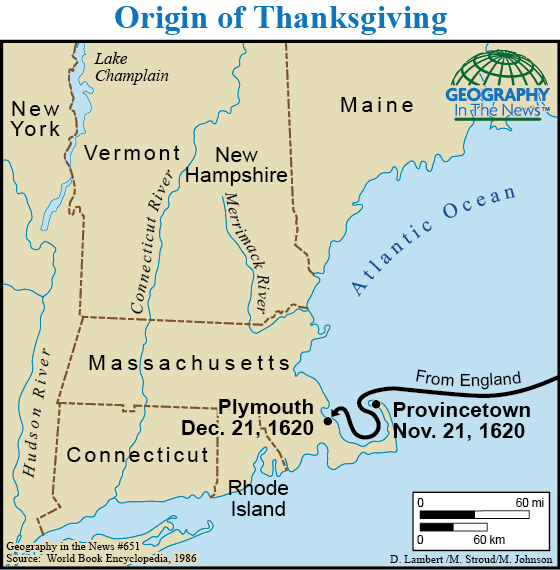
The original collection opened with this compact origin map, and it remains useful if handled carefully. It places Plymouth within a much larger Wampanoag geography rather than treating the coast as empty land. Its boundary is illustrative, however, and the underlying cartography dates to the 1990s. Historic homelands do not fit neatly into modern administrative lines, and Wampanoag communities remain living sovereign nations. Treat the graphic as a historical artifact from the earlier article, not as an authoritative modern territorial map, and pair it with current tribal sources in the caption and surrounding text.
Source: Geography in the News
2. Family, food and football in 2012
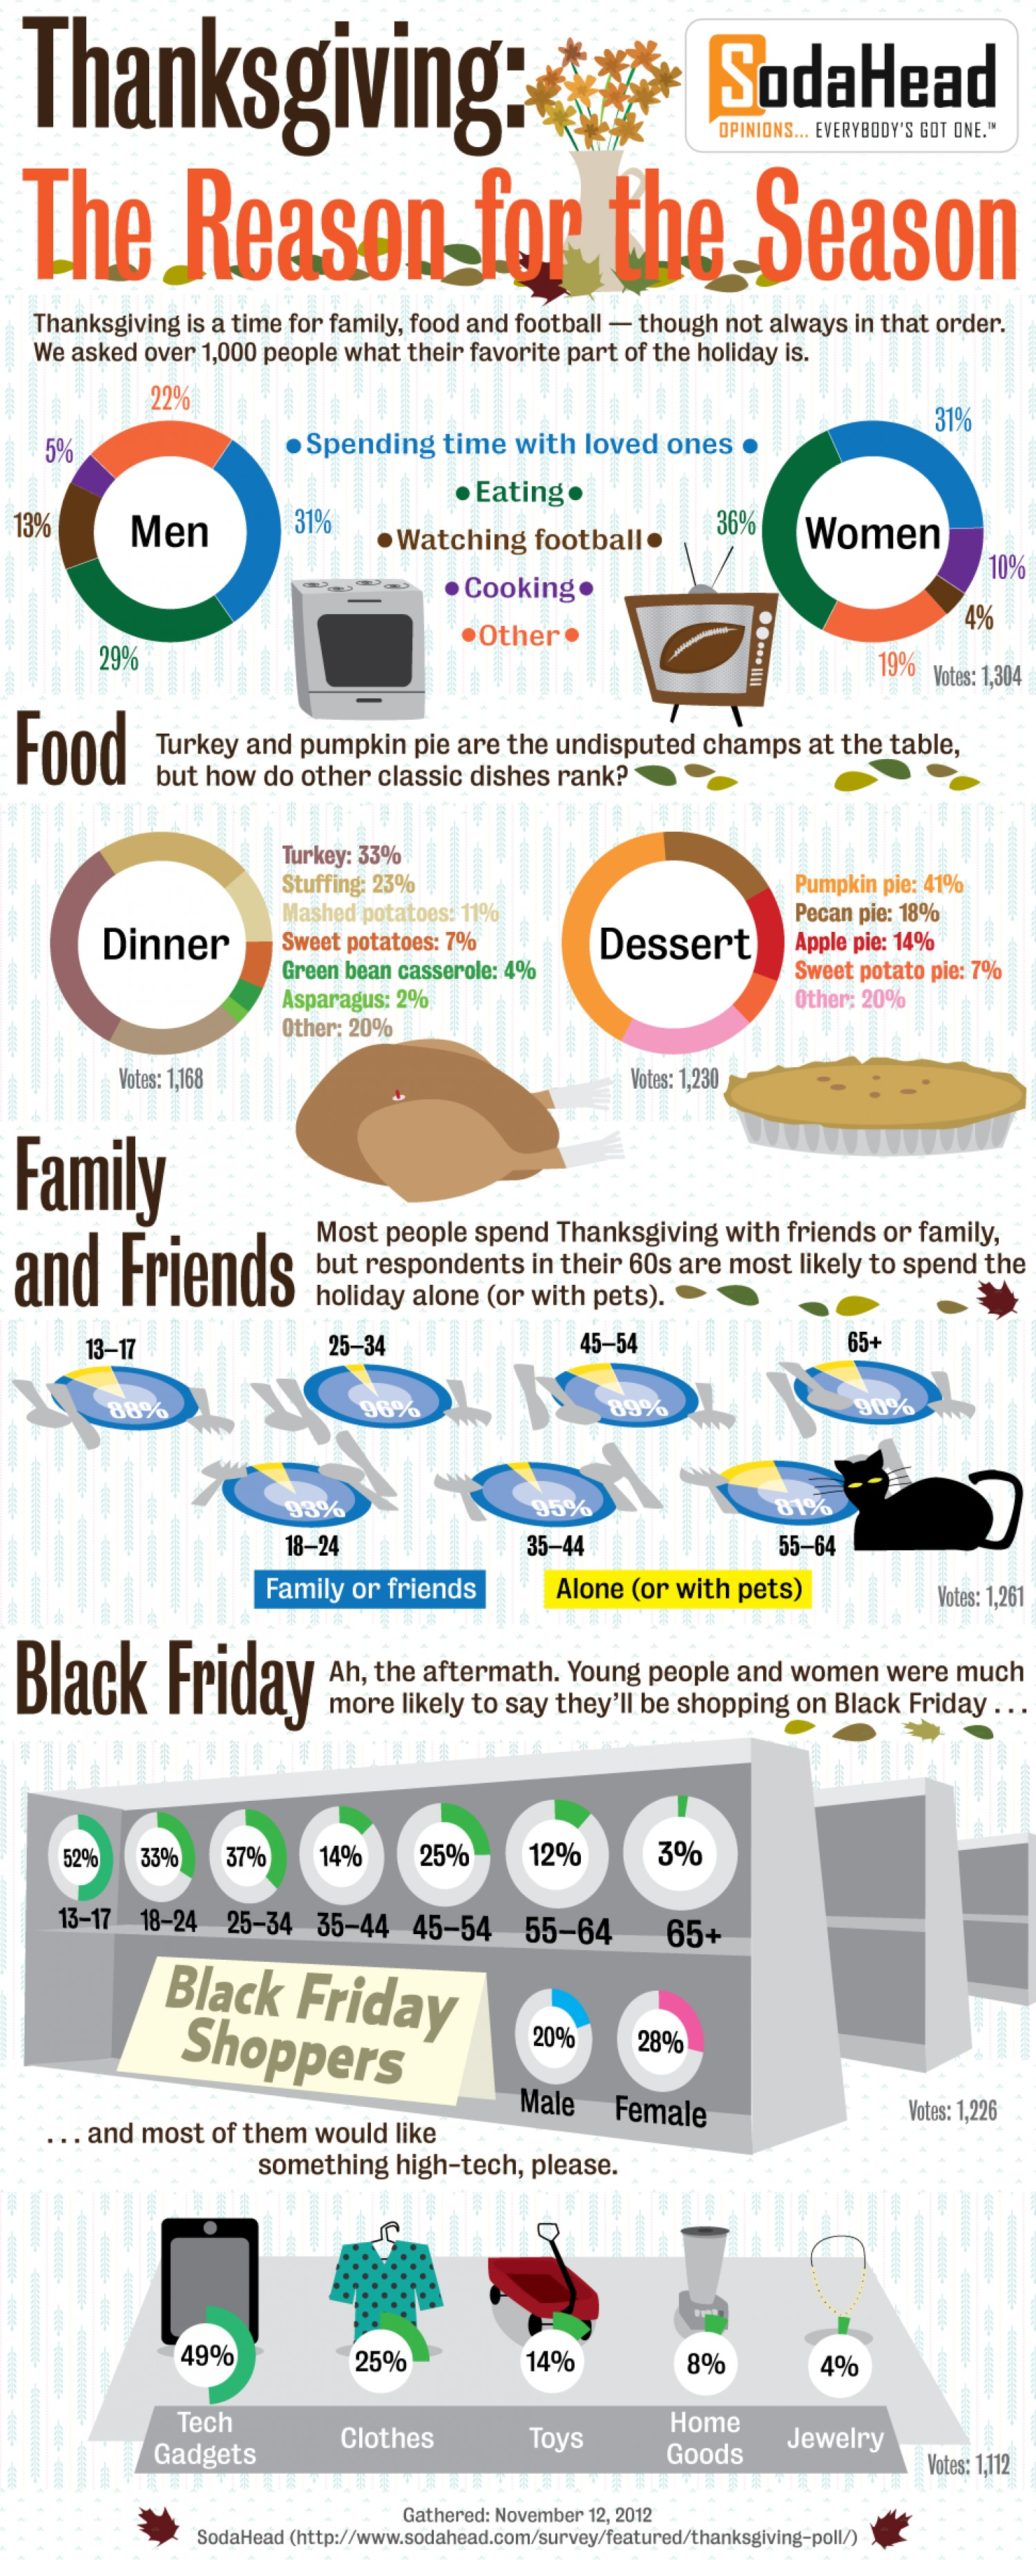
This tall SodaHead infographic is not current evidence; it is a wonderfully specific snapshot of Thanksgiving culture in 2012. More than 1,000 respondents ranked time with loved ones, eating, football, and cooking, while separate panels covered favorite dishes, who spent the holiday with family, and Black Friday plans. The design captures the internet-infographic era almost as clearly as the survey captures the holiday. Its samples were opt-in platform polls rather than nationally representative research, so the percentages should stay inside their original frame. Keep the visual for historical color, not for claims about Americans in 2026.
Source: SodaHead / Visually
3. The tiny continent of Thanksgiving dinner
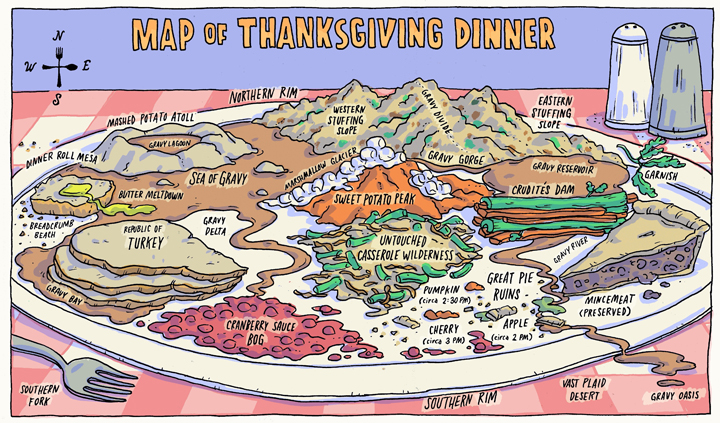
Grant Snider’s Map of Thanksgiving Dinner remains the most naturally Geoawesome visual in the collection. The plate becomes a continent with the Gulf of Gravy, Turkey Island, and a suspiciously remote cranberry coast. It works because every family meal has borders, chokepoints, and disputed territories. First published in 2011, the artwork turns the familiar chaos of serving dinner into informal cartography. The safest route may be around the mashed-potato range, while the cranberries remain gloriously isolated on the far edge of the plate.
Source: Incidental Comics
4. What the 2026 basket actually costs
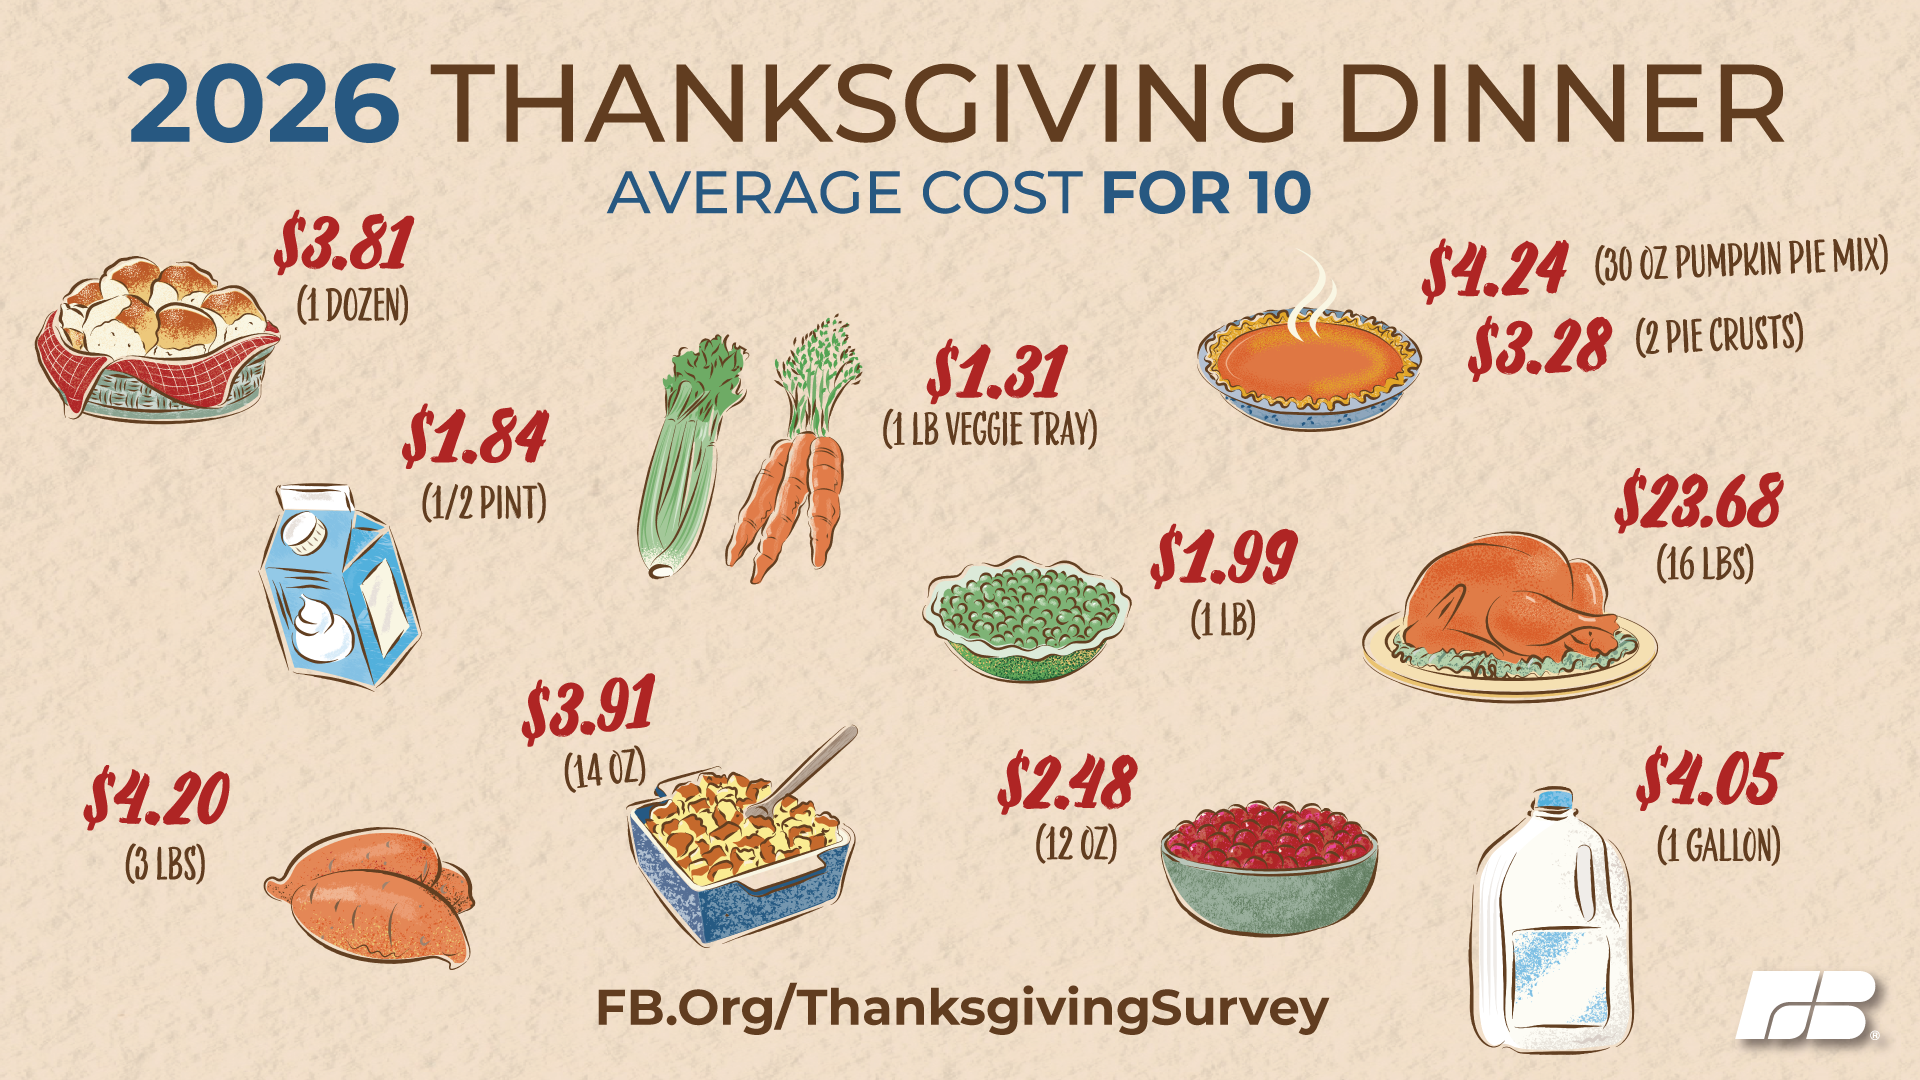
Farm Bureau’s published basket graphic puts the 2026 total into grocery-aisle detail. The classic dinner for 10 costs $58.63, or $5.86 per person. A 16-pound turkey averages $23.68, while the chart also prices stuffing, sweet potatoes, rolls, cranberries, peas, milk, pie ingredients, and whipping cream. The basket rose 6% from 2025, led by turkey and several staples. This is a standardized survey basket, not a universal household receipt, but its consistent menu makes year-to-year comparisons unusually useful. Treat the total as a national benchmark rather than a promise about any specific shopping cart.
Source: American Farm Bureau Federation
5. Two decades of Thanksgiving inflation
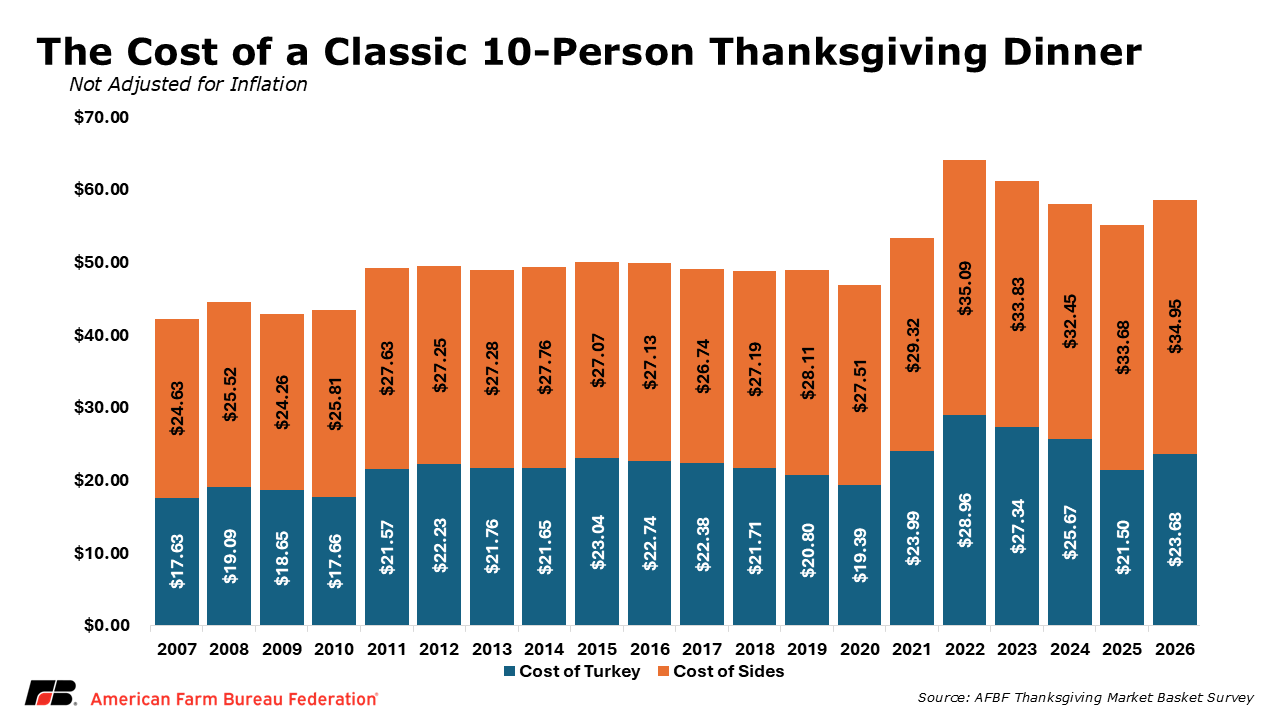
The companion Farm Bureau chart shows how the same basket changed from 2007 through 2026. The total climbed from $42.26 in 2007 to a nominal record of $64.05 in 2022, then eased for three years before rising again to $58.63. Splitting each bar into turkey and side dishes makes the recent story easier to see: the bird remains the single largest component, but everything around it matters too. These are nominal dollars, so the graphic describes checkout prices rather than inflation-adjusted purchasing power. The result is a compact visual history of how Thanksgiving inflation reached the table.
Source: American Farm Bureau Federation
6. Stuffing wins 39 states
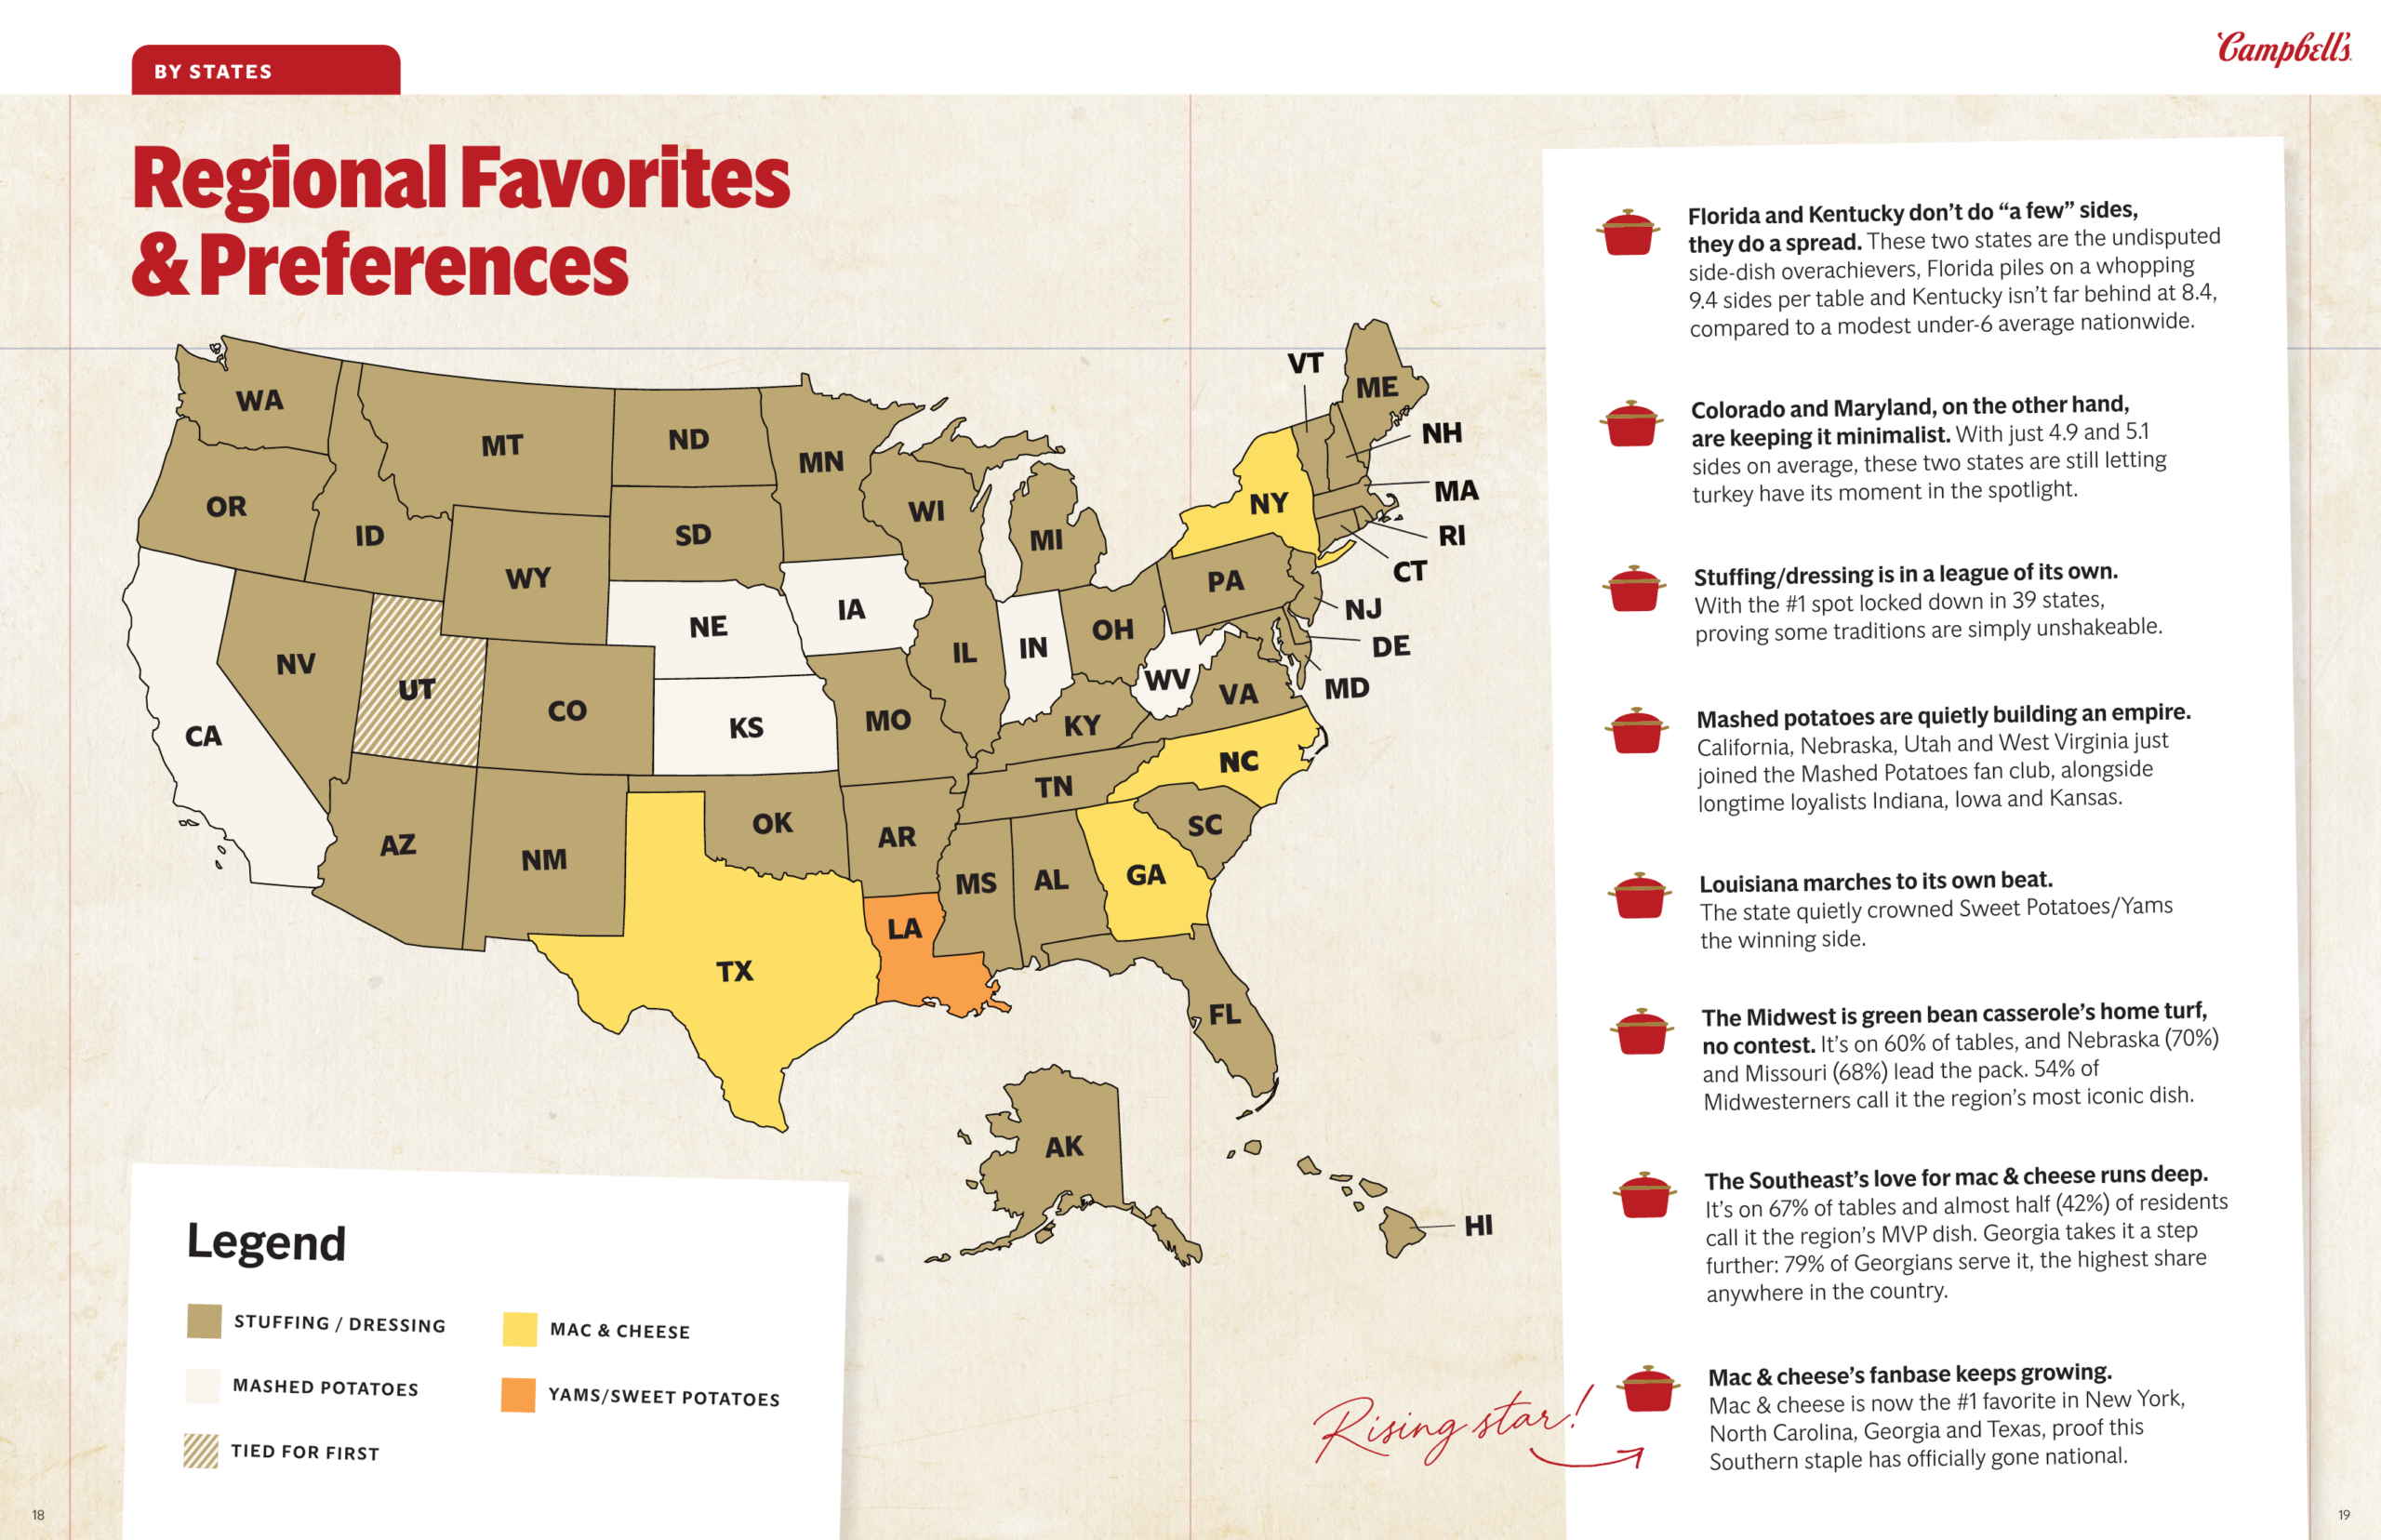
Campbell’s 2026 map gives stuffing—or dressing—one of the most decisive victories in American food geography: it leads in 39 states. Mashed potatoes hold California and several Plains and Midwestern states. Mac and cheese wins New York, Texas, North Carolina, and Georgia, while Louisiana chooses yams and sweet potatoes and Utah records a tie. The survey covered 5,017 adults who celebrate Thanksgiving, with about 100 respondents per state. That makes the national picture much sturdier than any single state result, whose margin of error is roughly plus or minus 9.8 percentage points.
Source: Campbell’s Company
7. What shoppers actually ordered
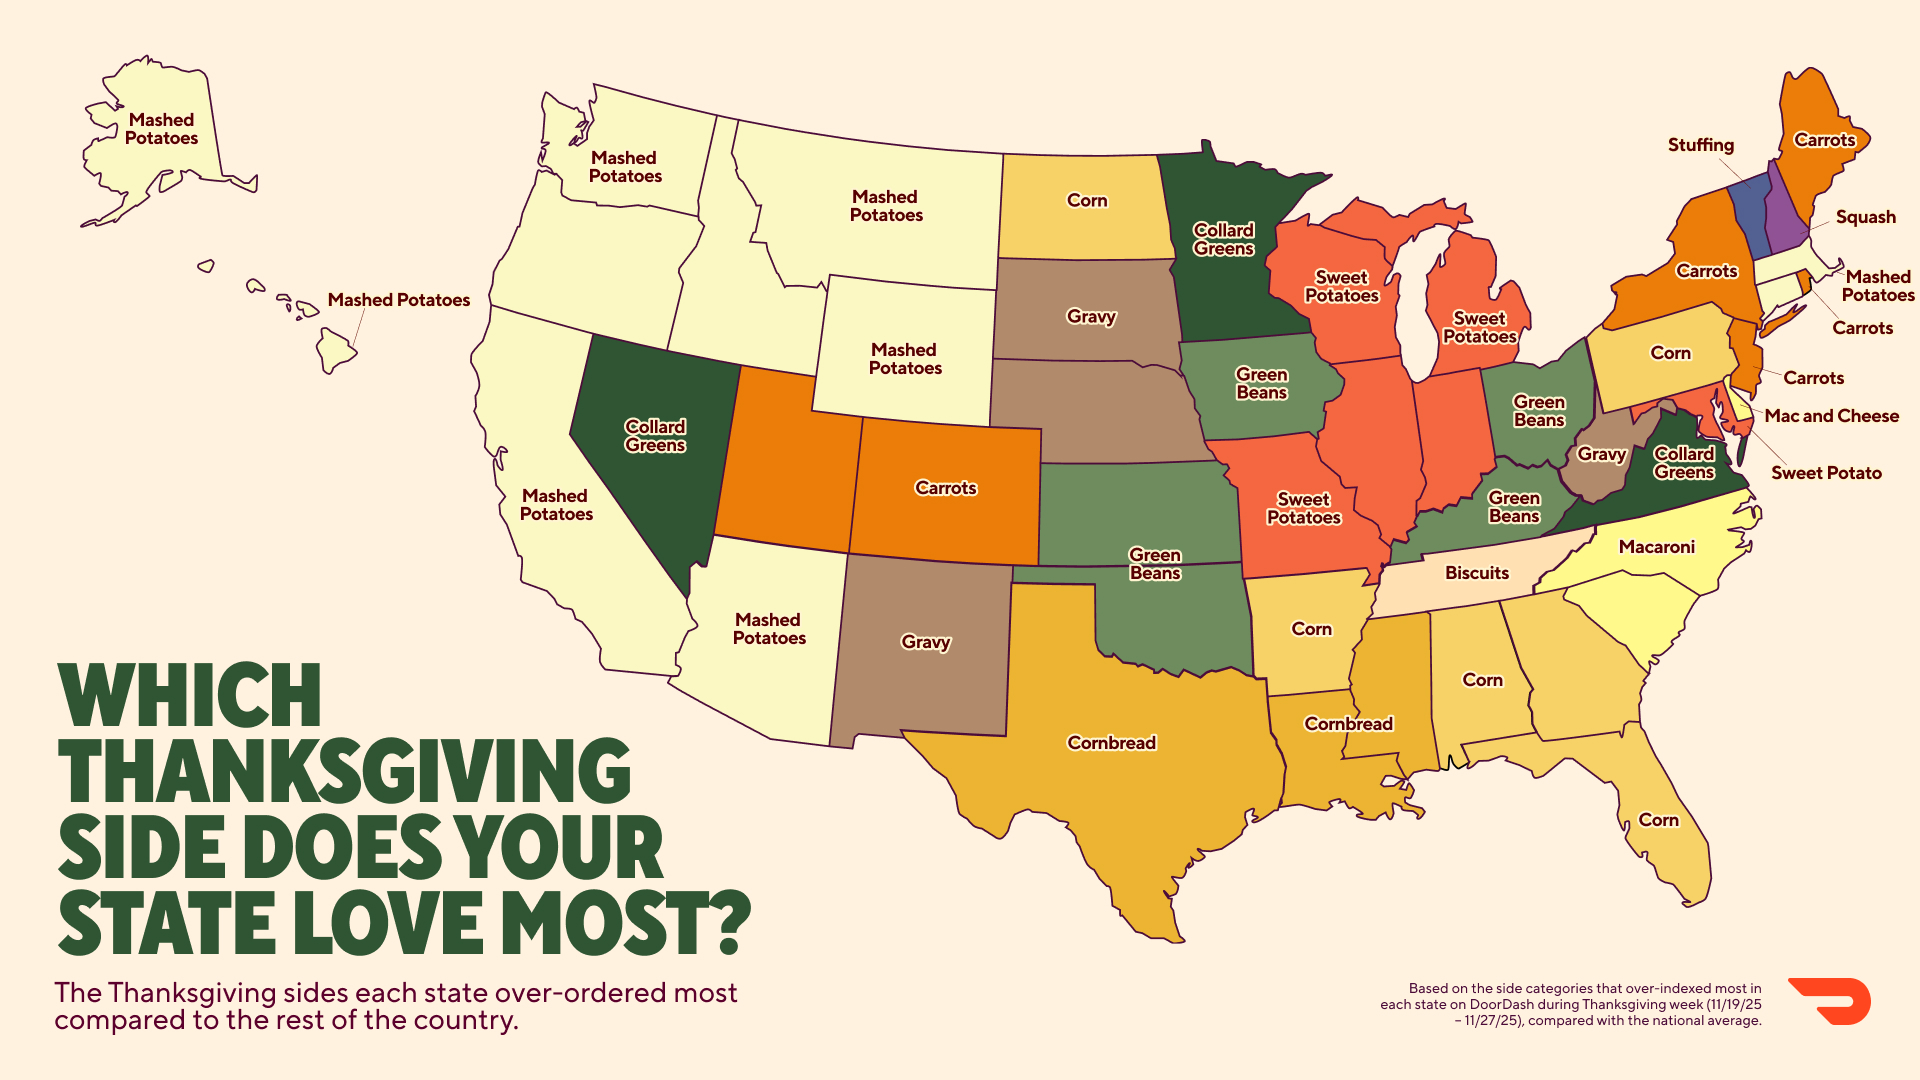
Survey answers and shopping carts tell different stories. DoorDash’s published map uses Thanksgiving grocery orders from November 19–27, 2025 to identify the side that over-indexed in each state relative to the national average. Mashed potatoes form a western bloc and lead nationally, while corn, sweet potatoes, green beans, gravy, carrots, collards, cornbread, and mac and cheese create smaller regional pockets. Over-indexing does not mean “most ordered.” It means a state bought that item at an unusually high rate compared with the country—an essential distinction when reading any state-preference map.
Source: DoorDash
8. Where the organic ingredients grow
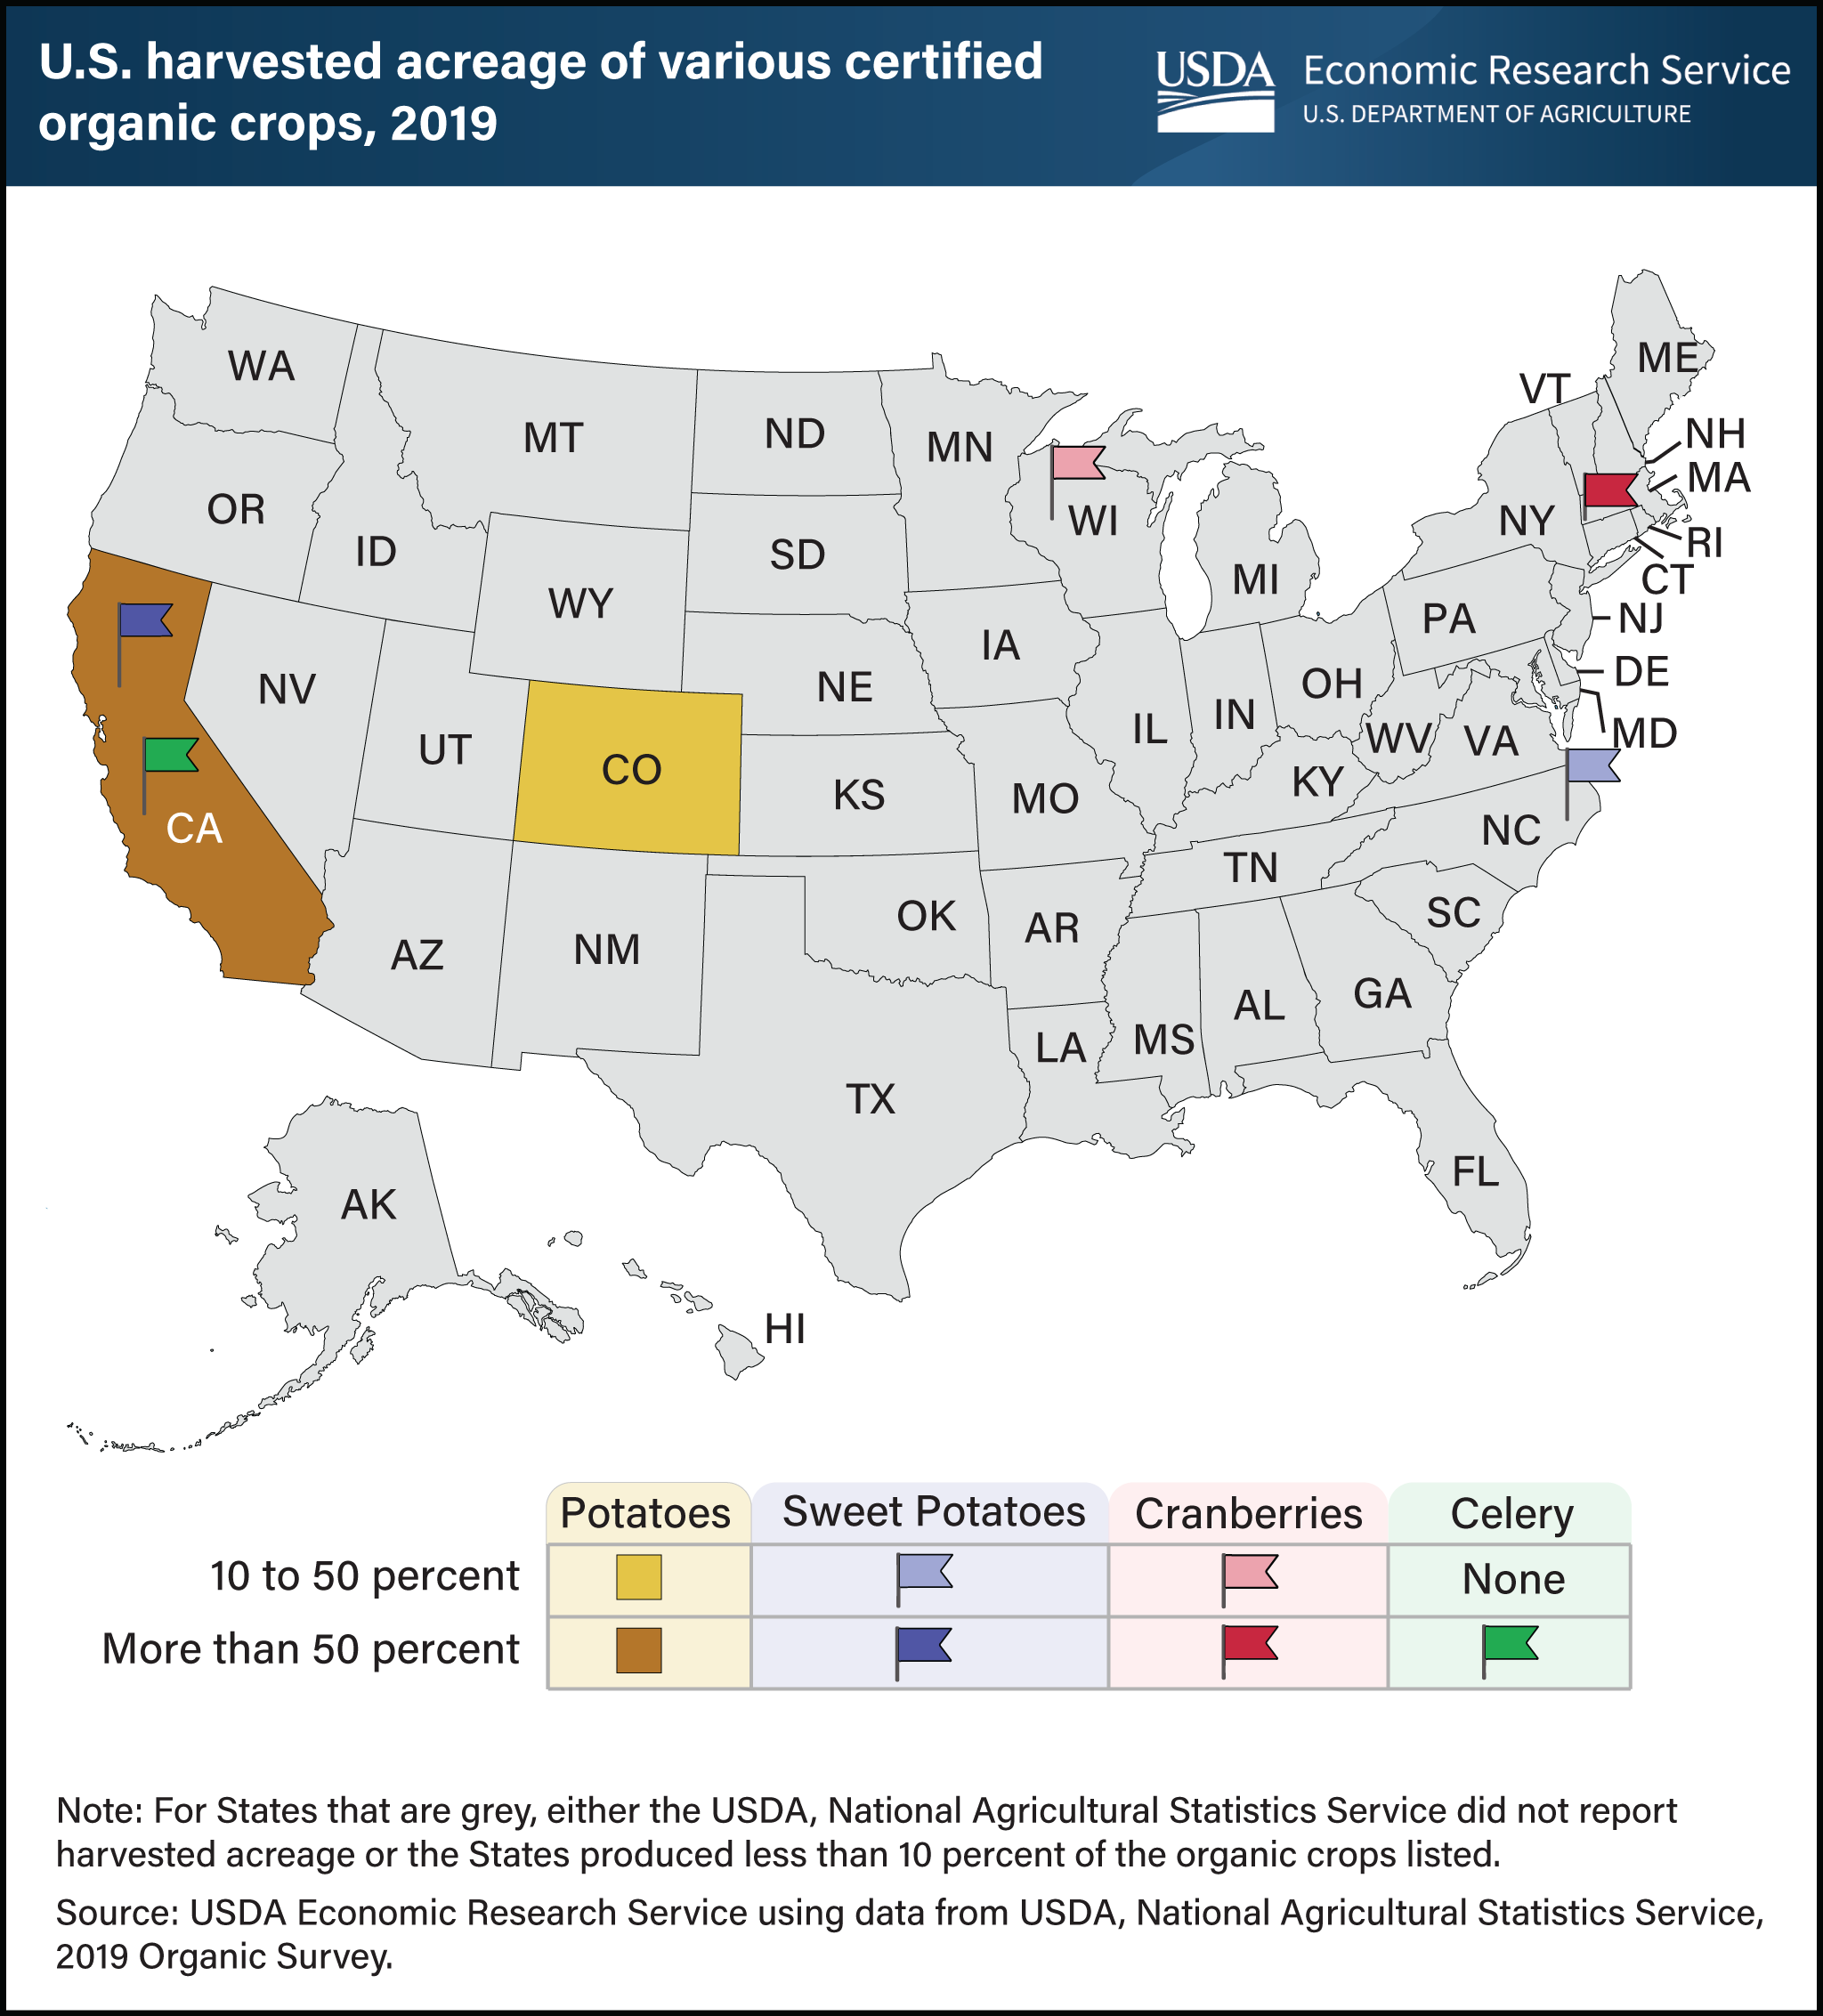
USDA’s map offers a clean geographical answer to “where does dinner grow?”—with an organic twist. California supplied 57% of certified organic potato acreage and 91% of organic celery acreage in 2019. California and North Carolina together held 91% of organic sweet-potato acreage, while Massachusetts produced 66% of organic cranberries, followed by Wisconsin. The map shows states with at least a 10% share, not every source in the supply chain. Its data are older than the surrounding 2026 graphics, but the spatial concentration remains the story, and the federal chart is public domain.
Source: USDA
9. The dessert map breaks the pumpkin-pie myth
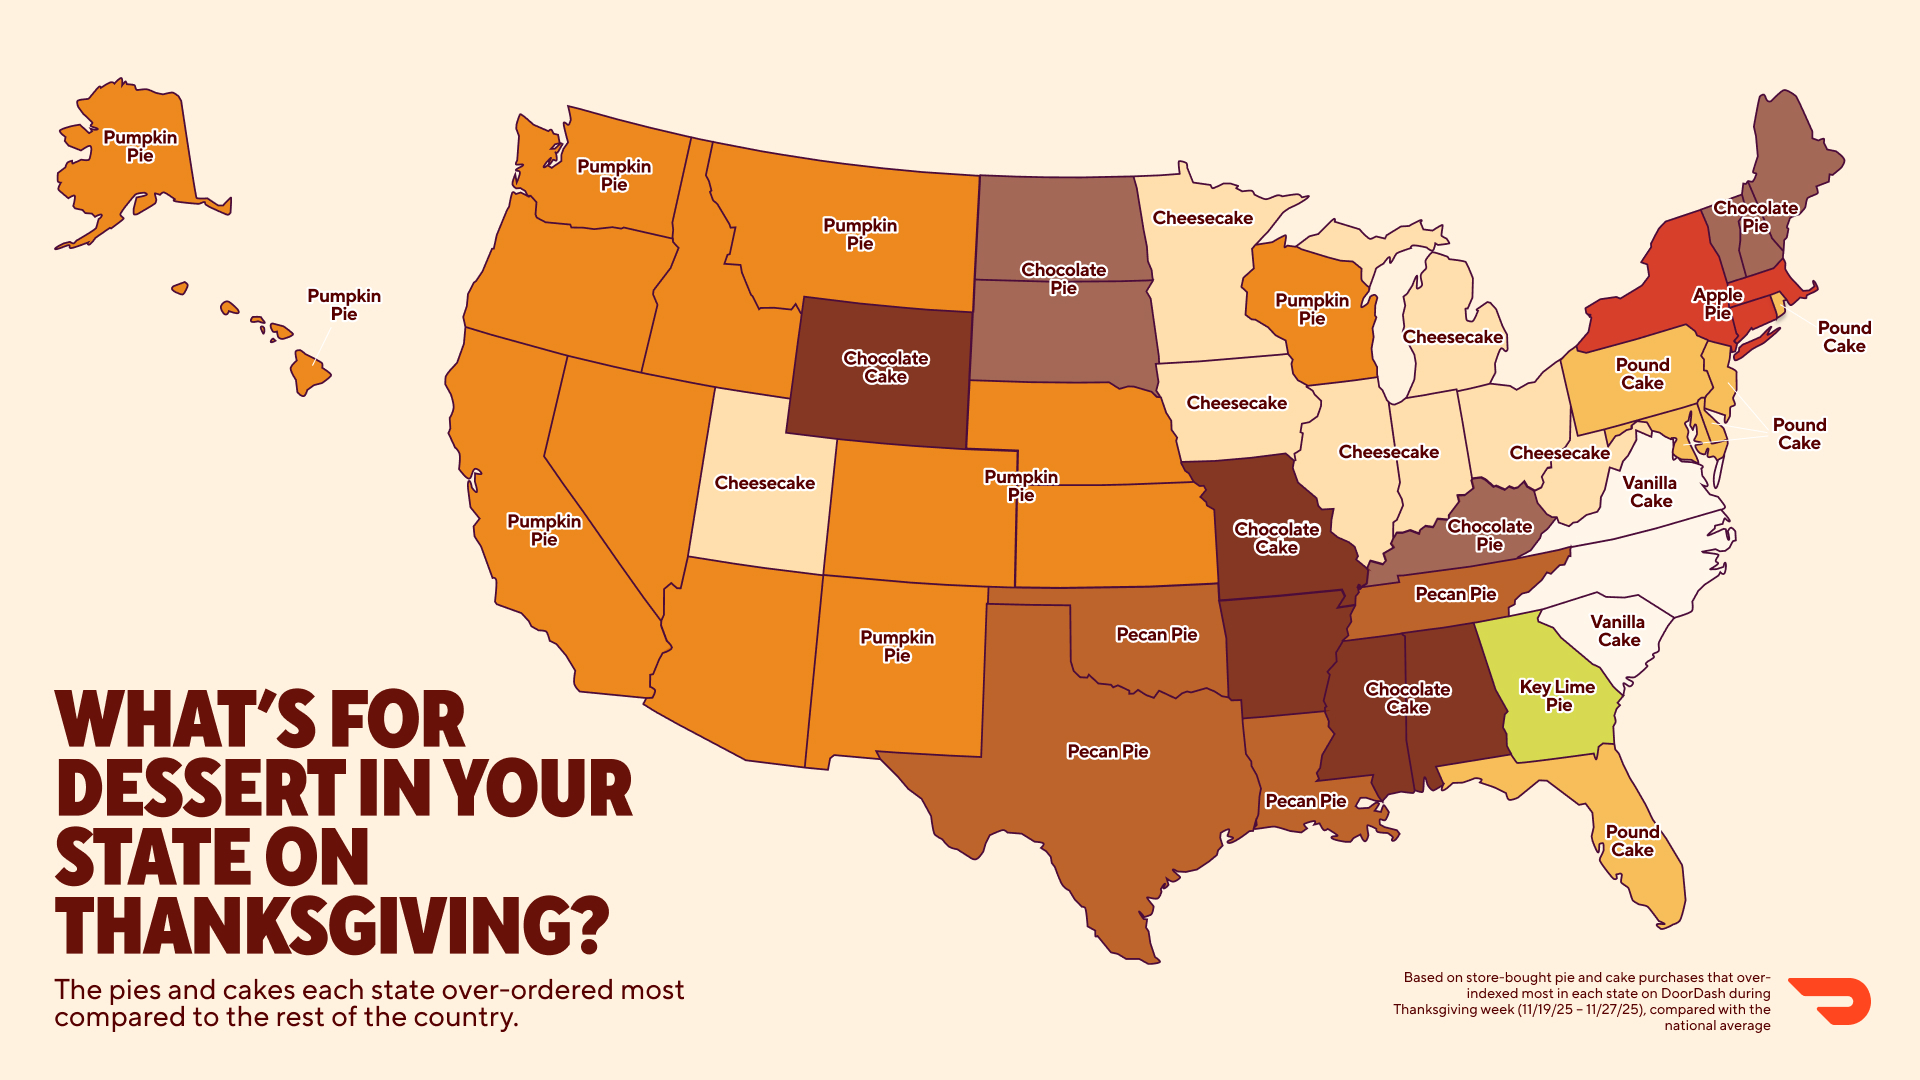
Pumpkin pie has the widest state footprint, over-indexing in 14 mostly western and central states. Yet DoorDash’s companion ranking says chocolate cake—not pumpkin pie—was the most-ordered Thanksgiving dessert nationally. Cheesecake forms a Midwest belt, pound cake appears across parts of the East and Florida, and pecan pie runs through Oklahoma, Texas, Louisiana, and Tennessee. Georgia’s key lime pie result is the delightful outlier. The map and national ranking measure different things, so they can both be true: local distinctiveness does not automatically translate into the largest total number of orders.
Source: DoorDash
10. Turkey country is concentrated
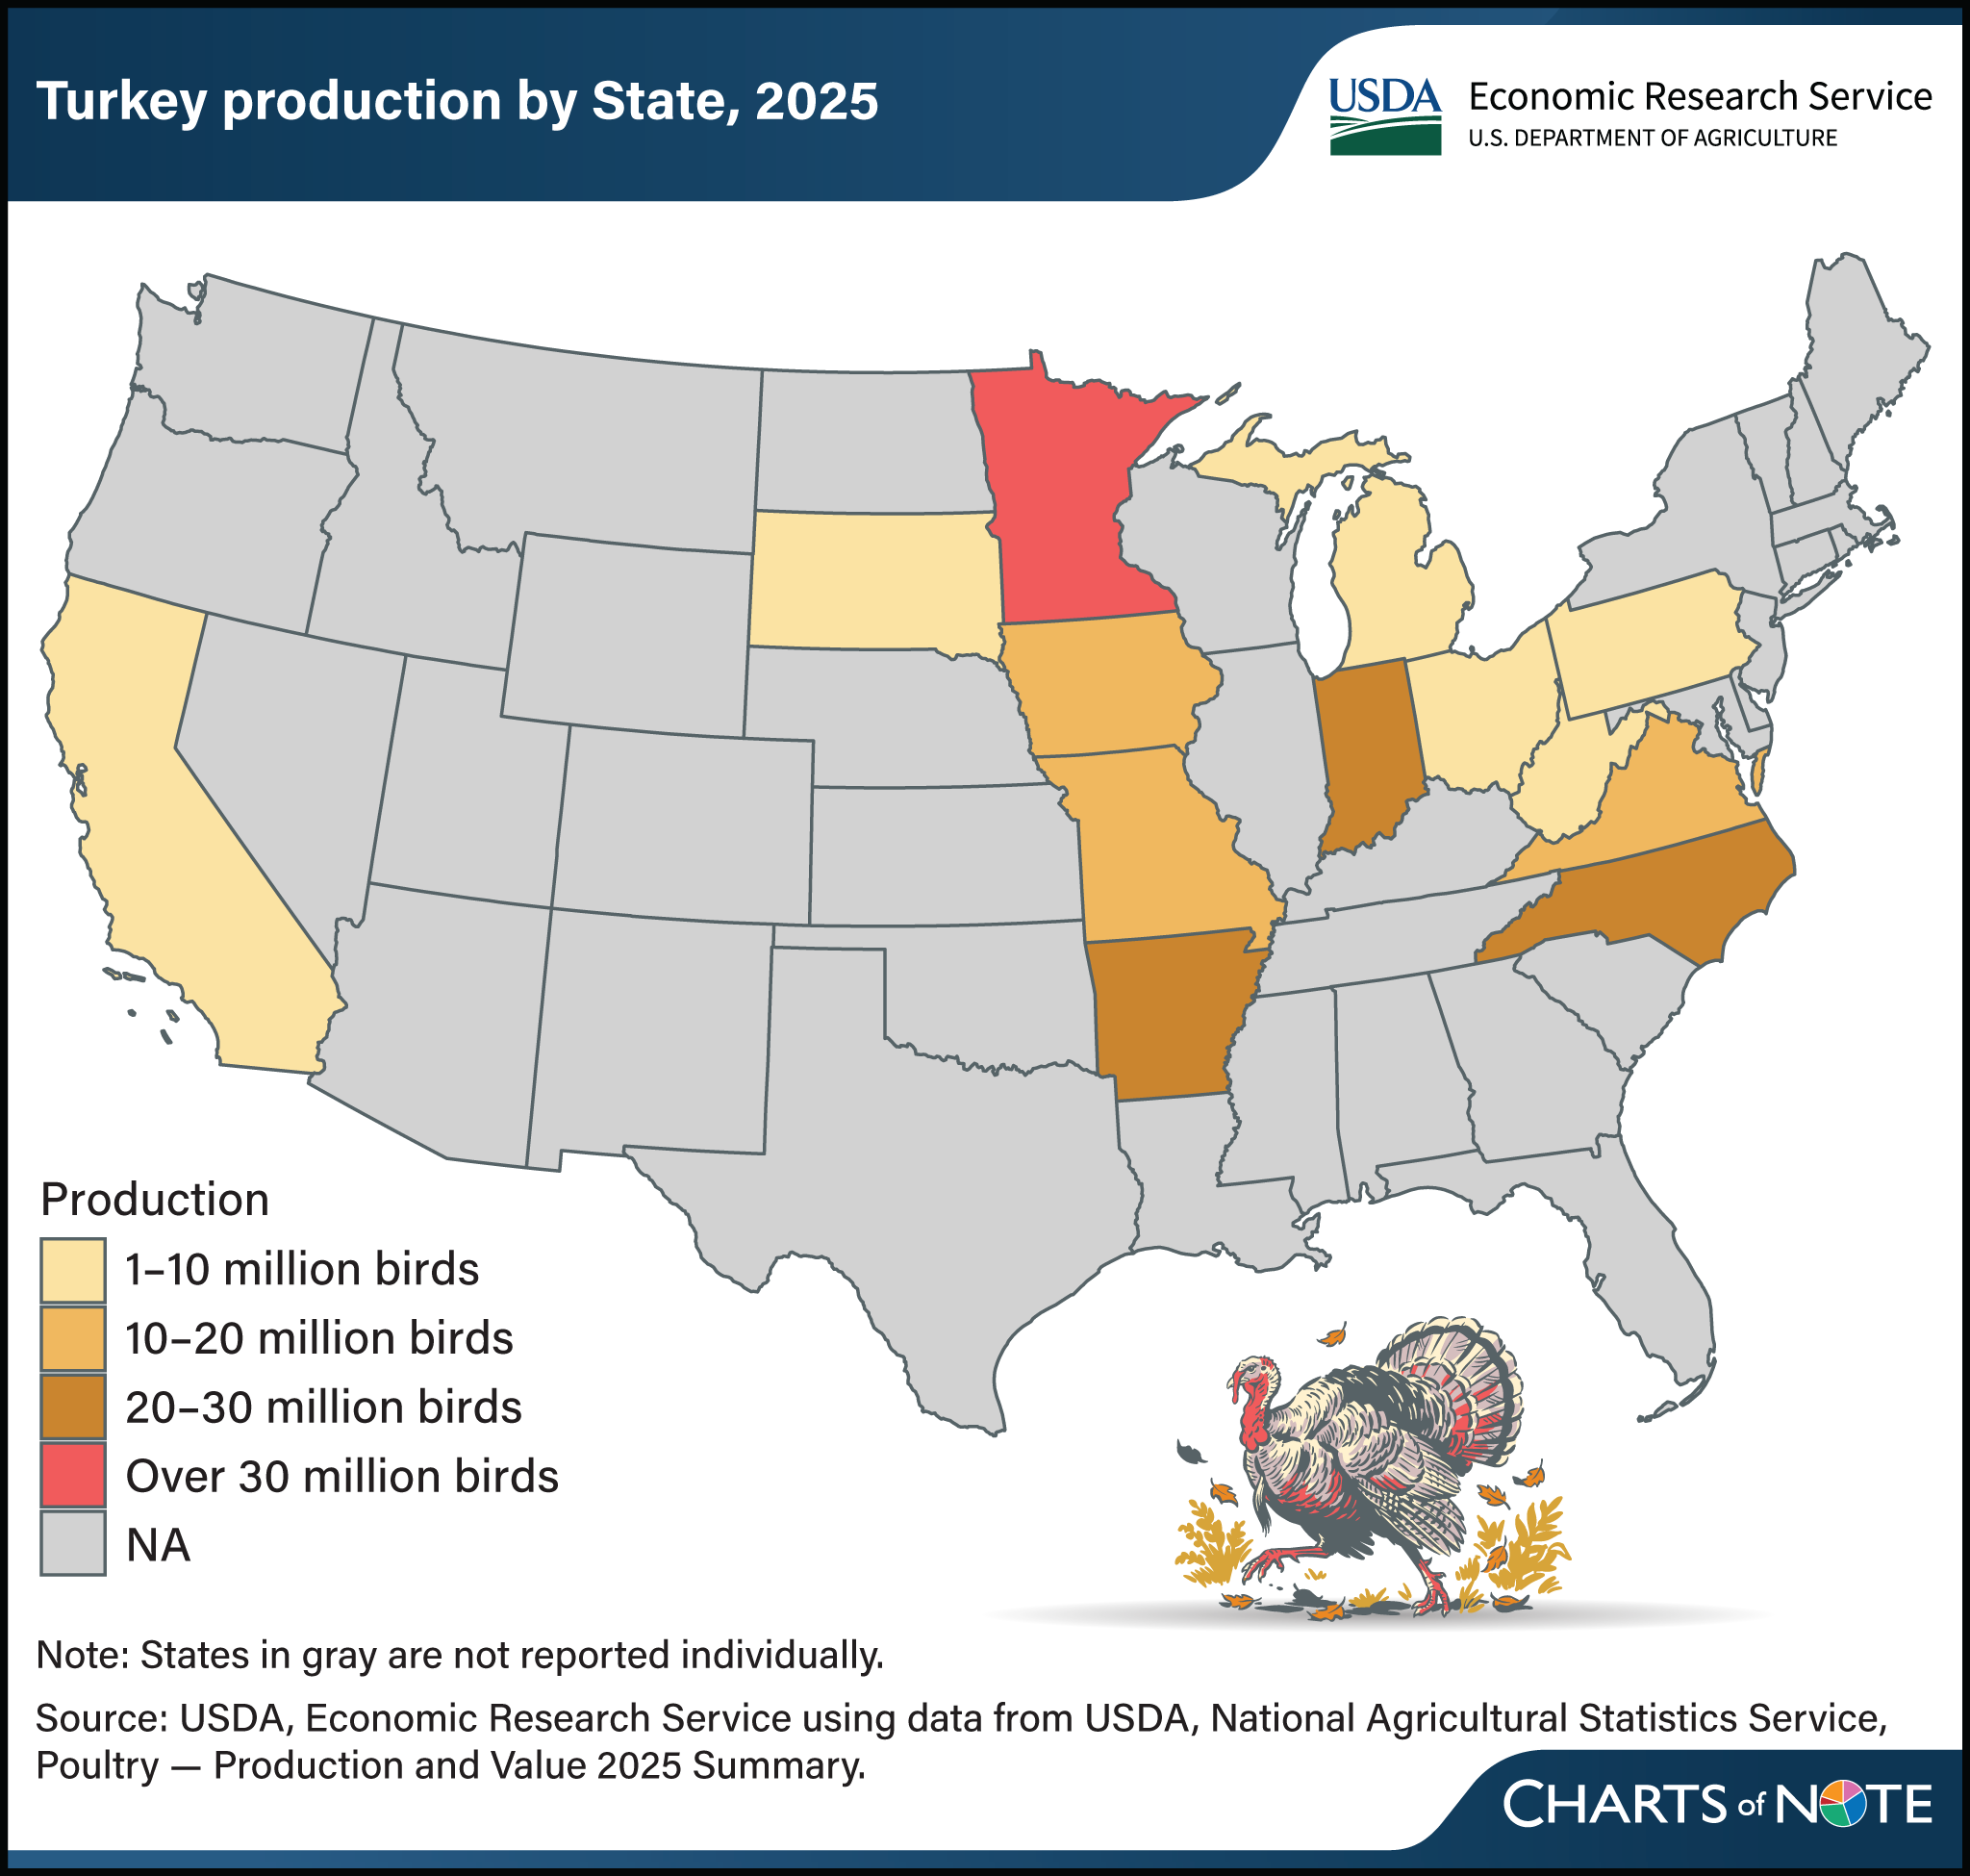
America’s turkey industry is geographically compact. Thirteen states produced 89% of the 193.5 million turkeys raised in 2025. Minnesota led with 33.5 million birds, about 17% of the national total, followed by North Carolina at 28 million, Arkansas at 21.5 million, and Indiana at 20 million. The map explains why local shocks can become national price stories: disease outbreaks, feed costs, processing capacity, and weather in a small group of states ripple into supermarket cases everywhere. USDA projects 5.183 billion pounds of turkey meat production in 2026.
Source: USDA
11. The classic first-turkey guide
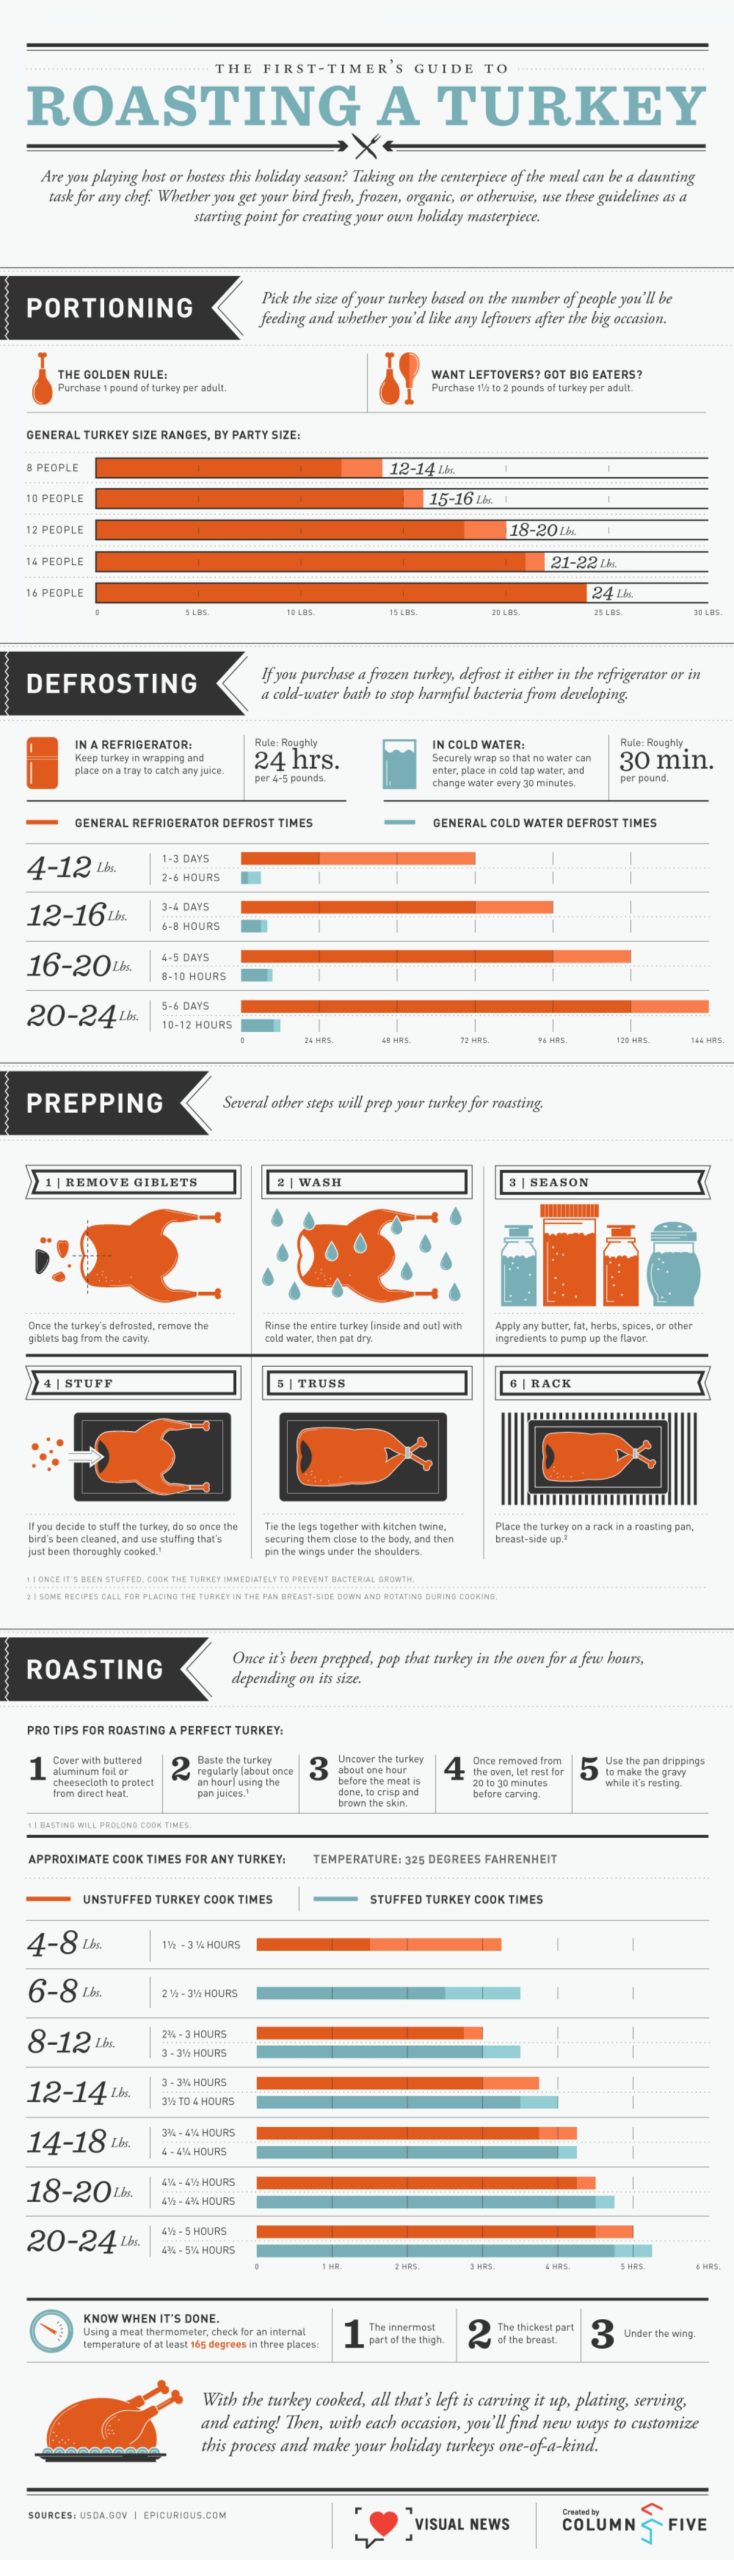
The original article’s roasting infographic earns its place through sheer usefulness. It walks a nervous first-time cook through thawing, seasoning, timing, thermometer checks, resting, and carving in one long visual. The practical principle still holds: cooking time is an estimate, while internal temperature decides safety. Current FoodSafety.gov guidance calls for at least 165°F in the thickest breast, innermost thigh, and innermost wing, with stuffing also reaching 165°F. Use the infographic for the cooking sequence and current official temperature guidance for food safety.
Source: Visually
12. Cranberry yields keep climbing
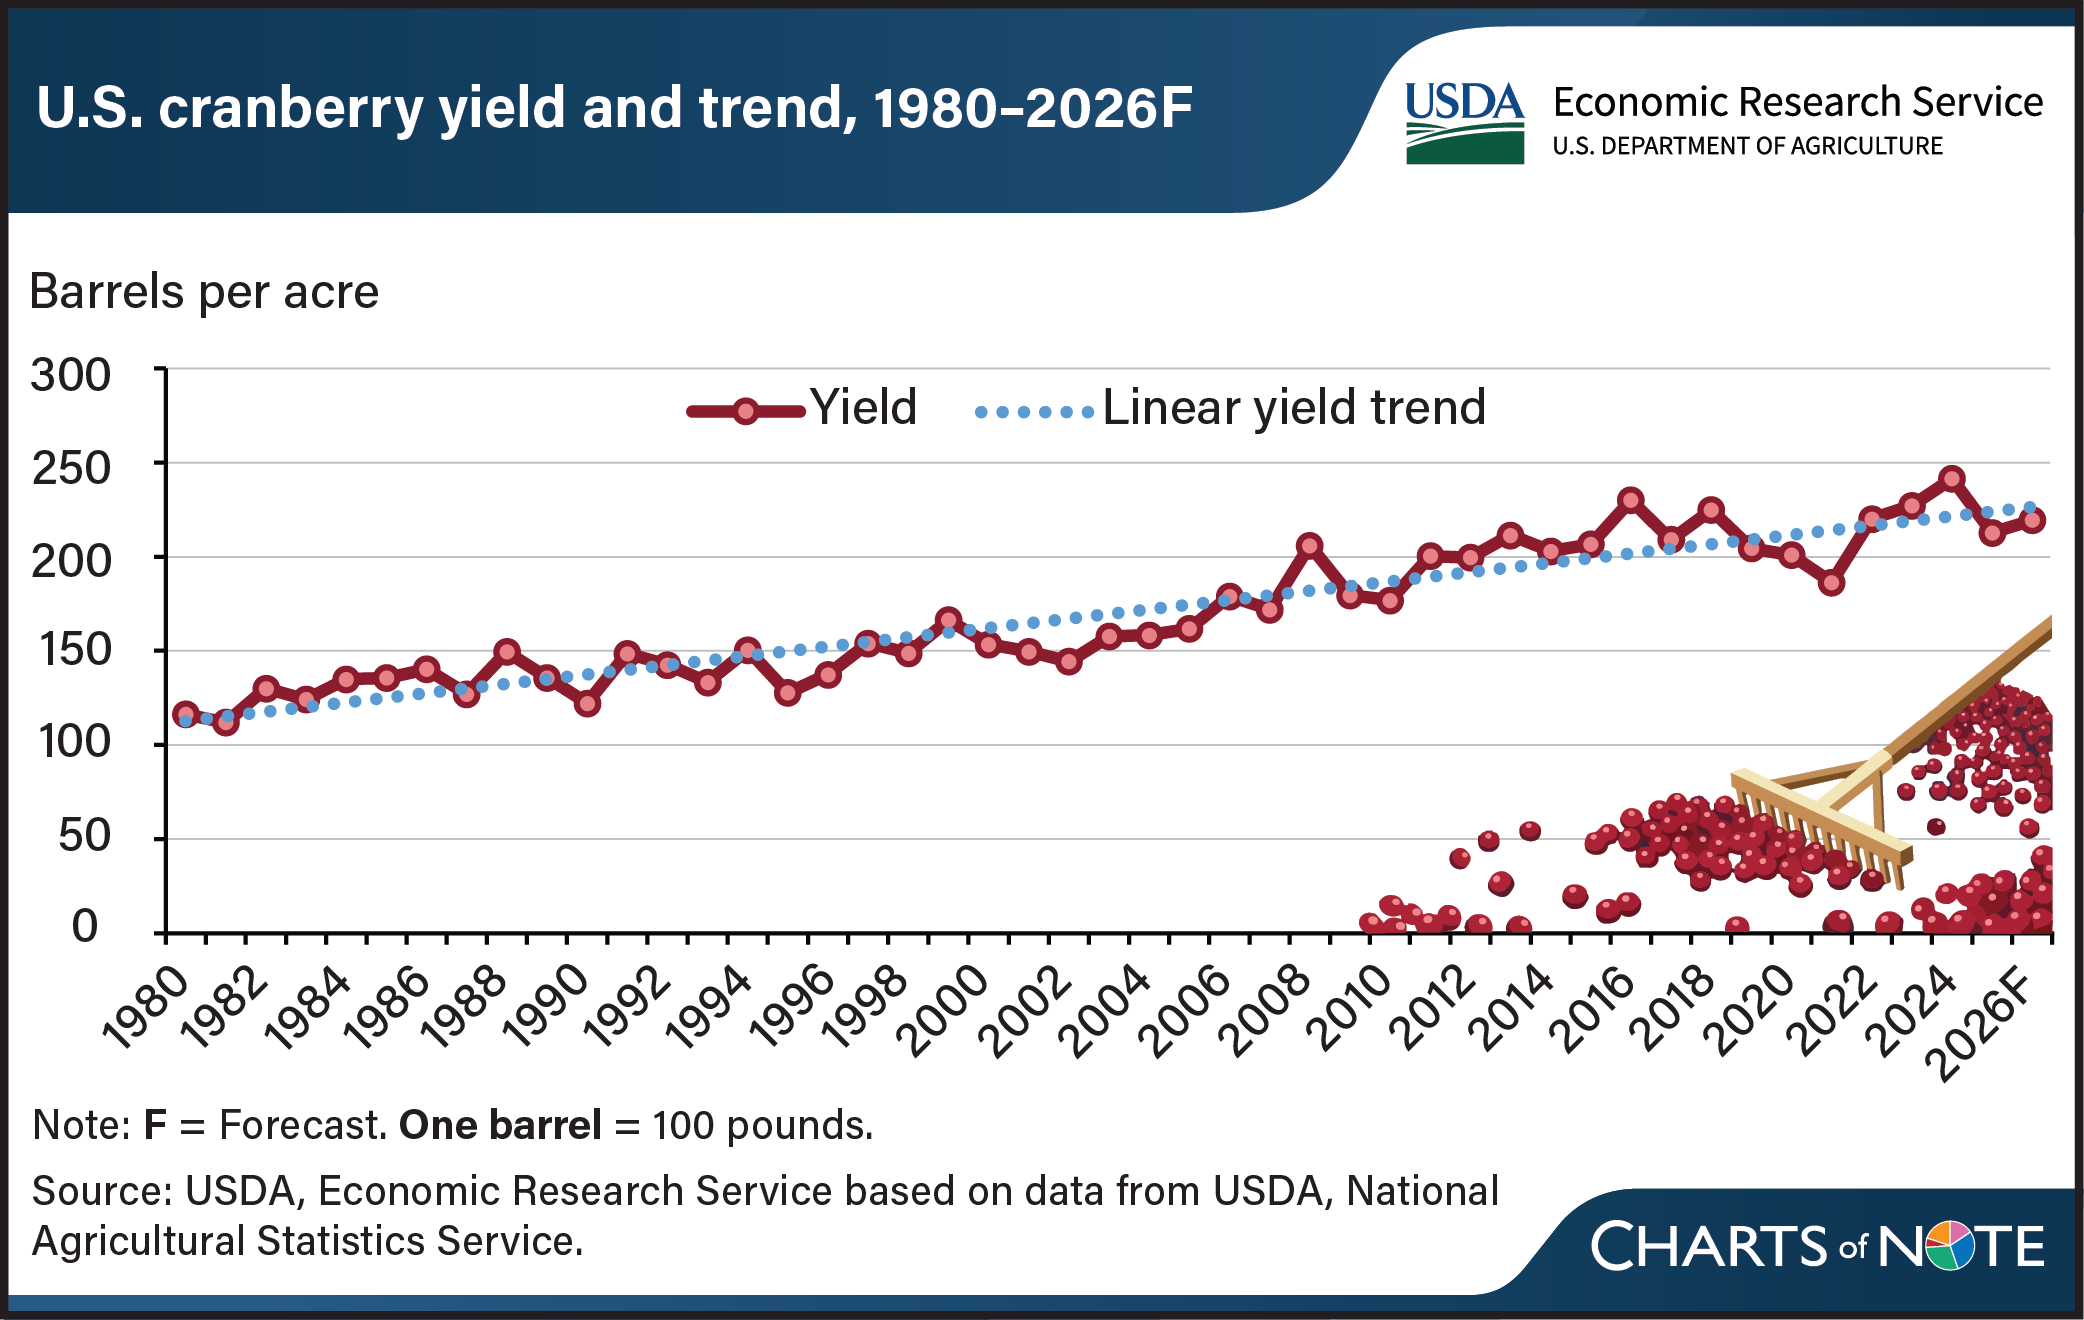
Cranberries are geographically concentrated, but this USDA chart tells a second story: farms are producing more from each acre. U.S. yield rises from roughly 100 barrels per acre in 1980 to more than 200 in many recent years, with a clear upward trend despite annual swings. The 2026 point is a forecast, and one barrel equals 100 pounds. Yield is not the same thing as total production; weather and harvested acreage still matter. For the holiday table, the striking fact is that a sauce associated with millions of households depends on a specialized crop grown in just a few regions.
Source: USDA
13. Pumpkins grow everywhere, but not evenly
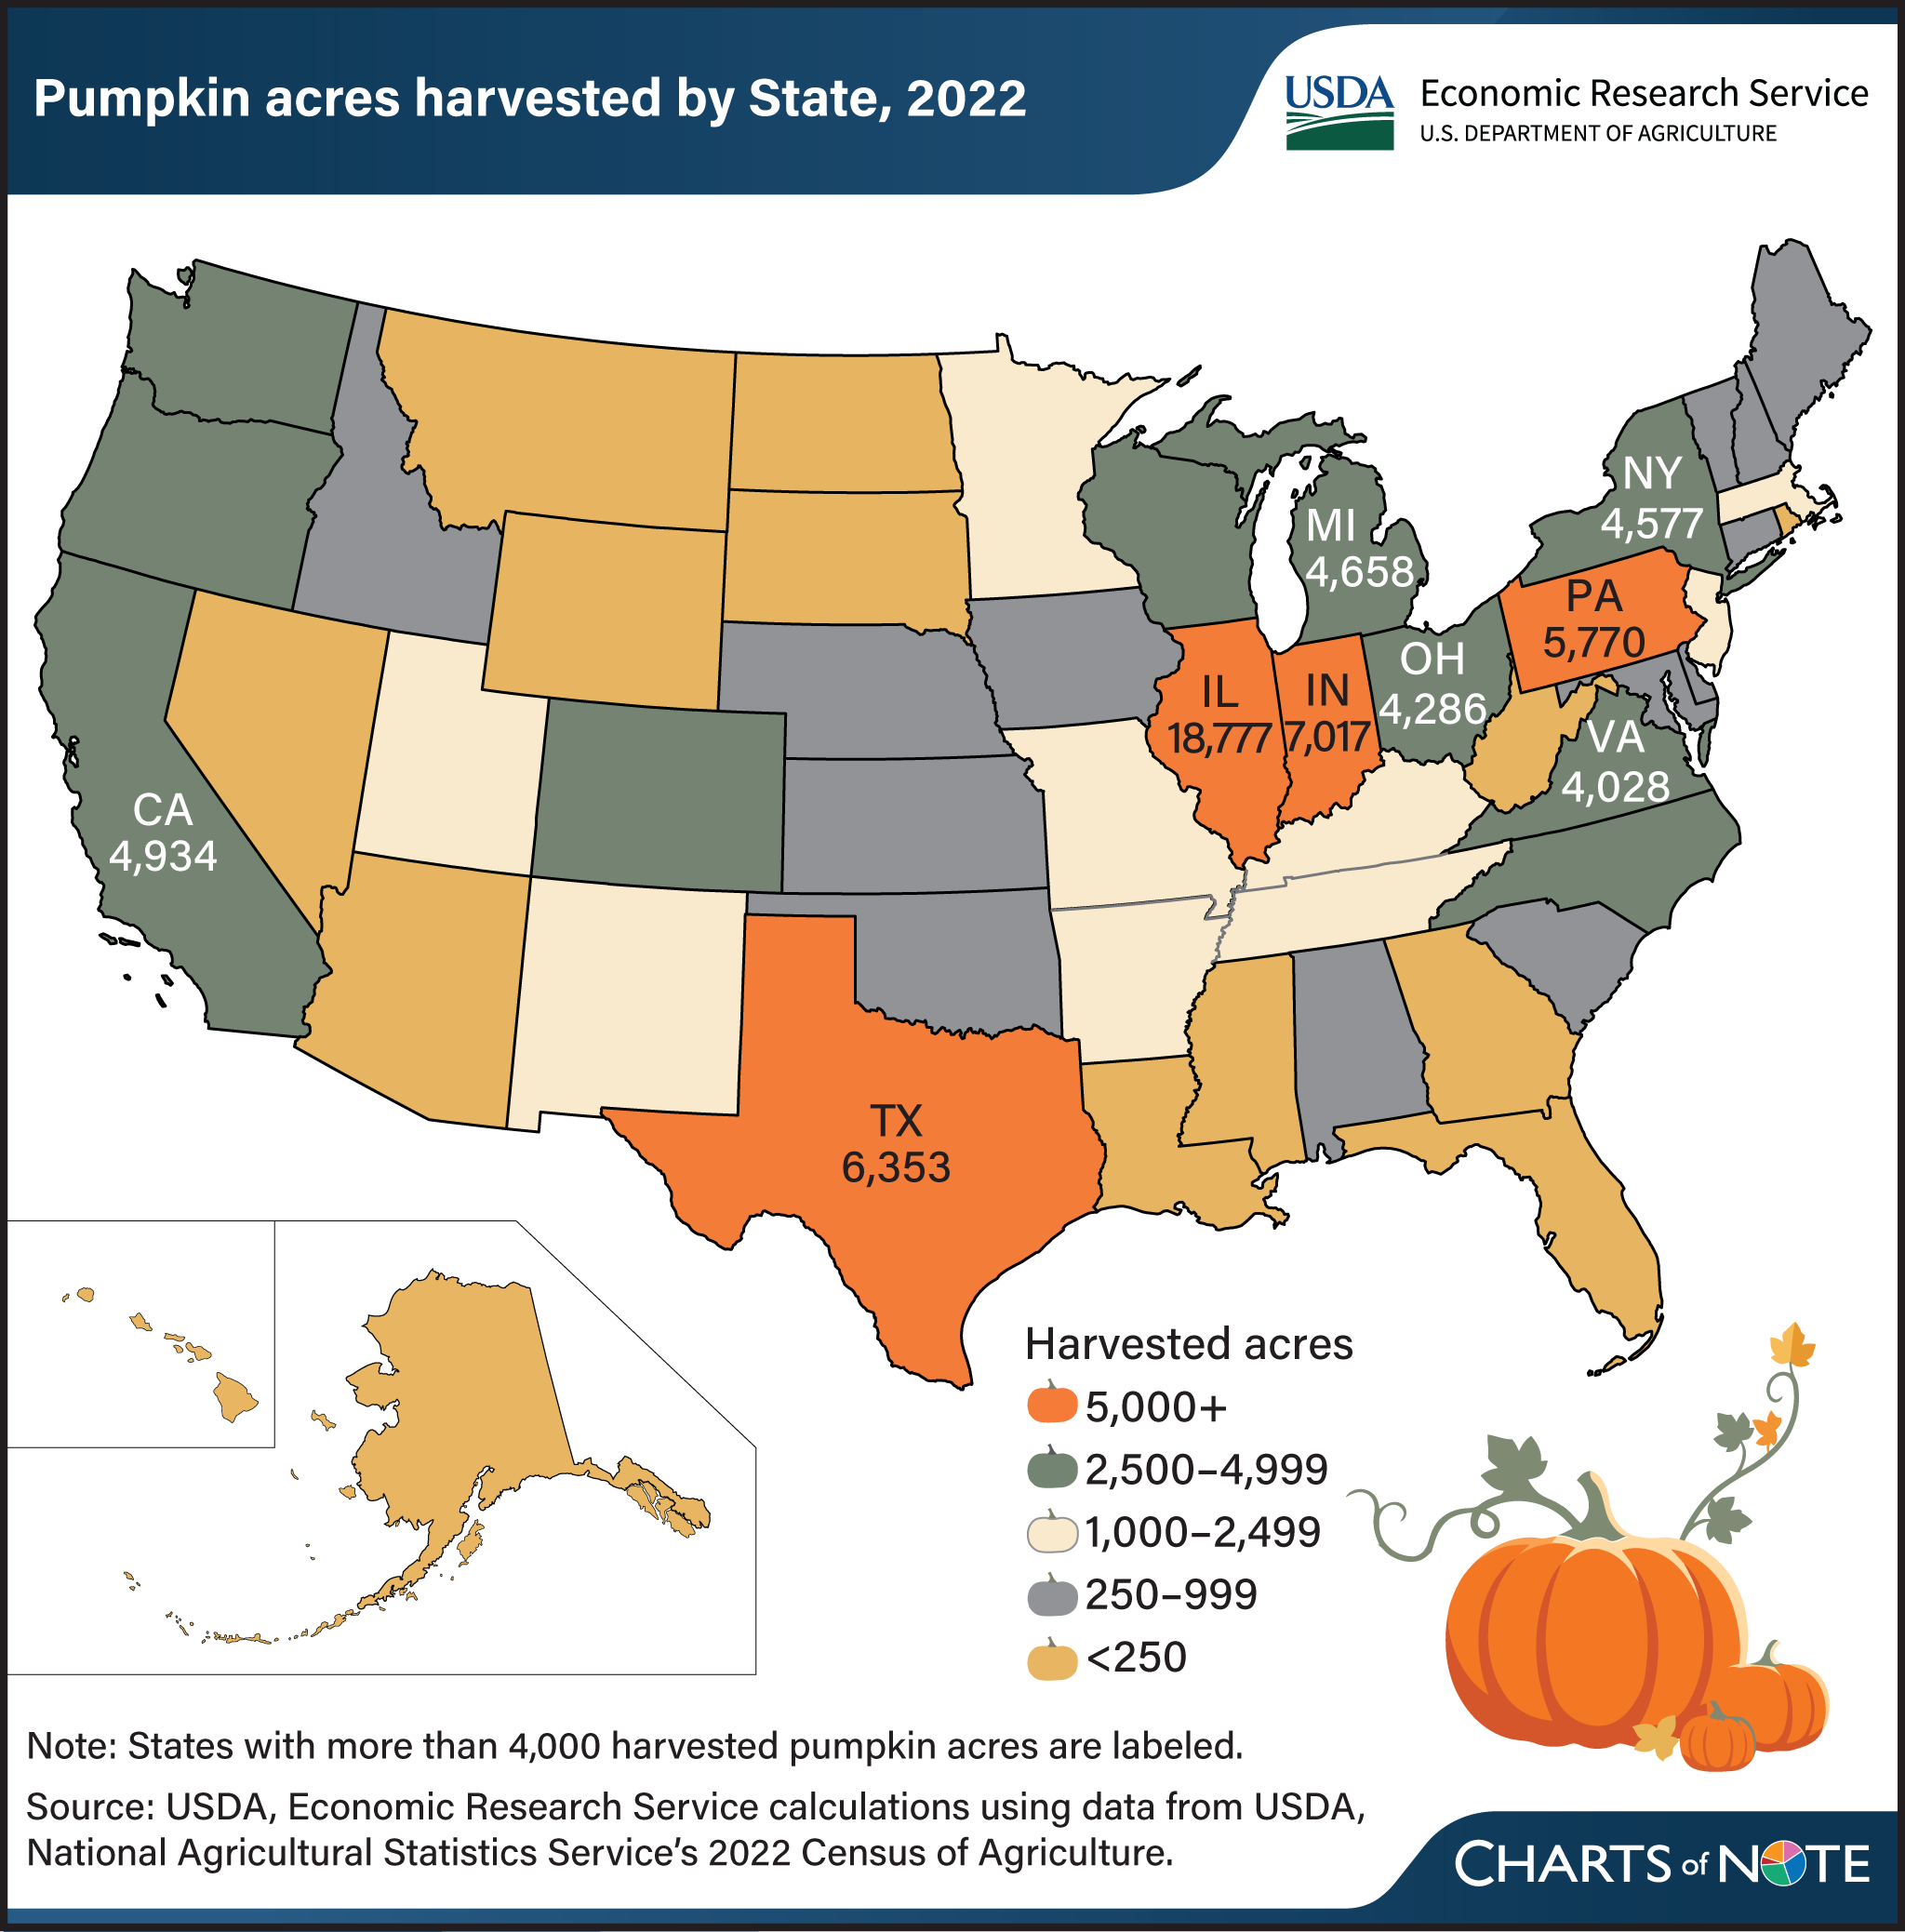
Pumpkins are grown in every state, yet the acreage map is anything but even. The 2022 Census of Agriculture counted more than 99,000 harvested acres on about 15,000 farms. Illinois led with nearly 18,800 acres, or 19% of the national total, followed by Indiana at about 7,000 and Texas at roughly 6,400. Most U.S. pumpkin acreage serves fresh and ornamental markets; processing production is much more concentrated near canning facilities, especially in Illinois. The graphic was published in 2026, but its comprehensive state data come from the 2022 agricultural census.
Source: USDA
14. Thanksgiving travel returns to a plateau
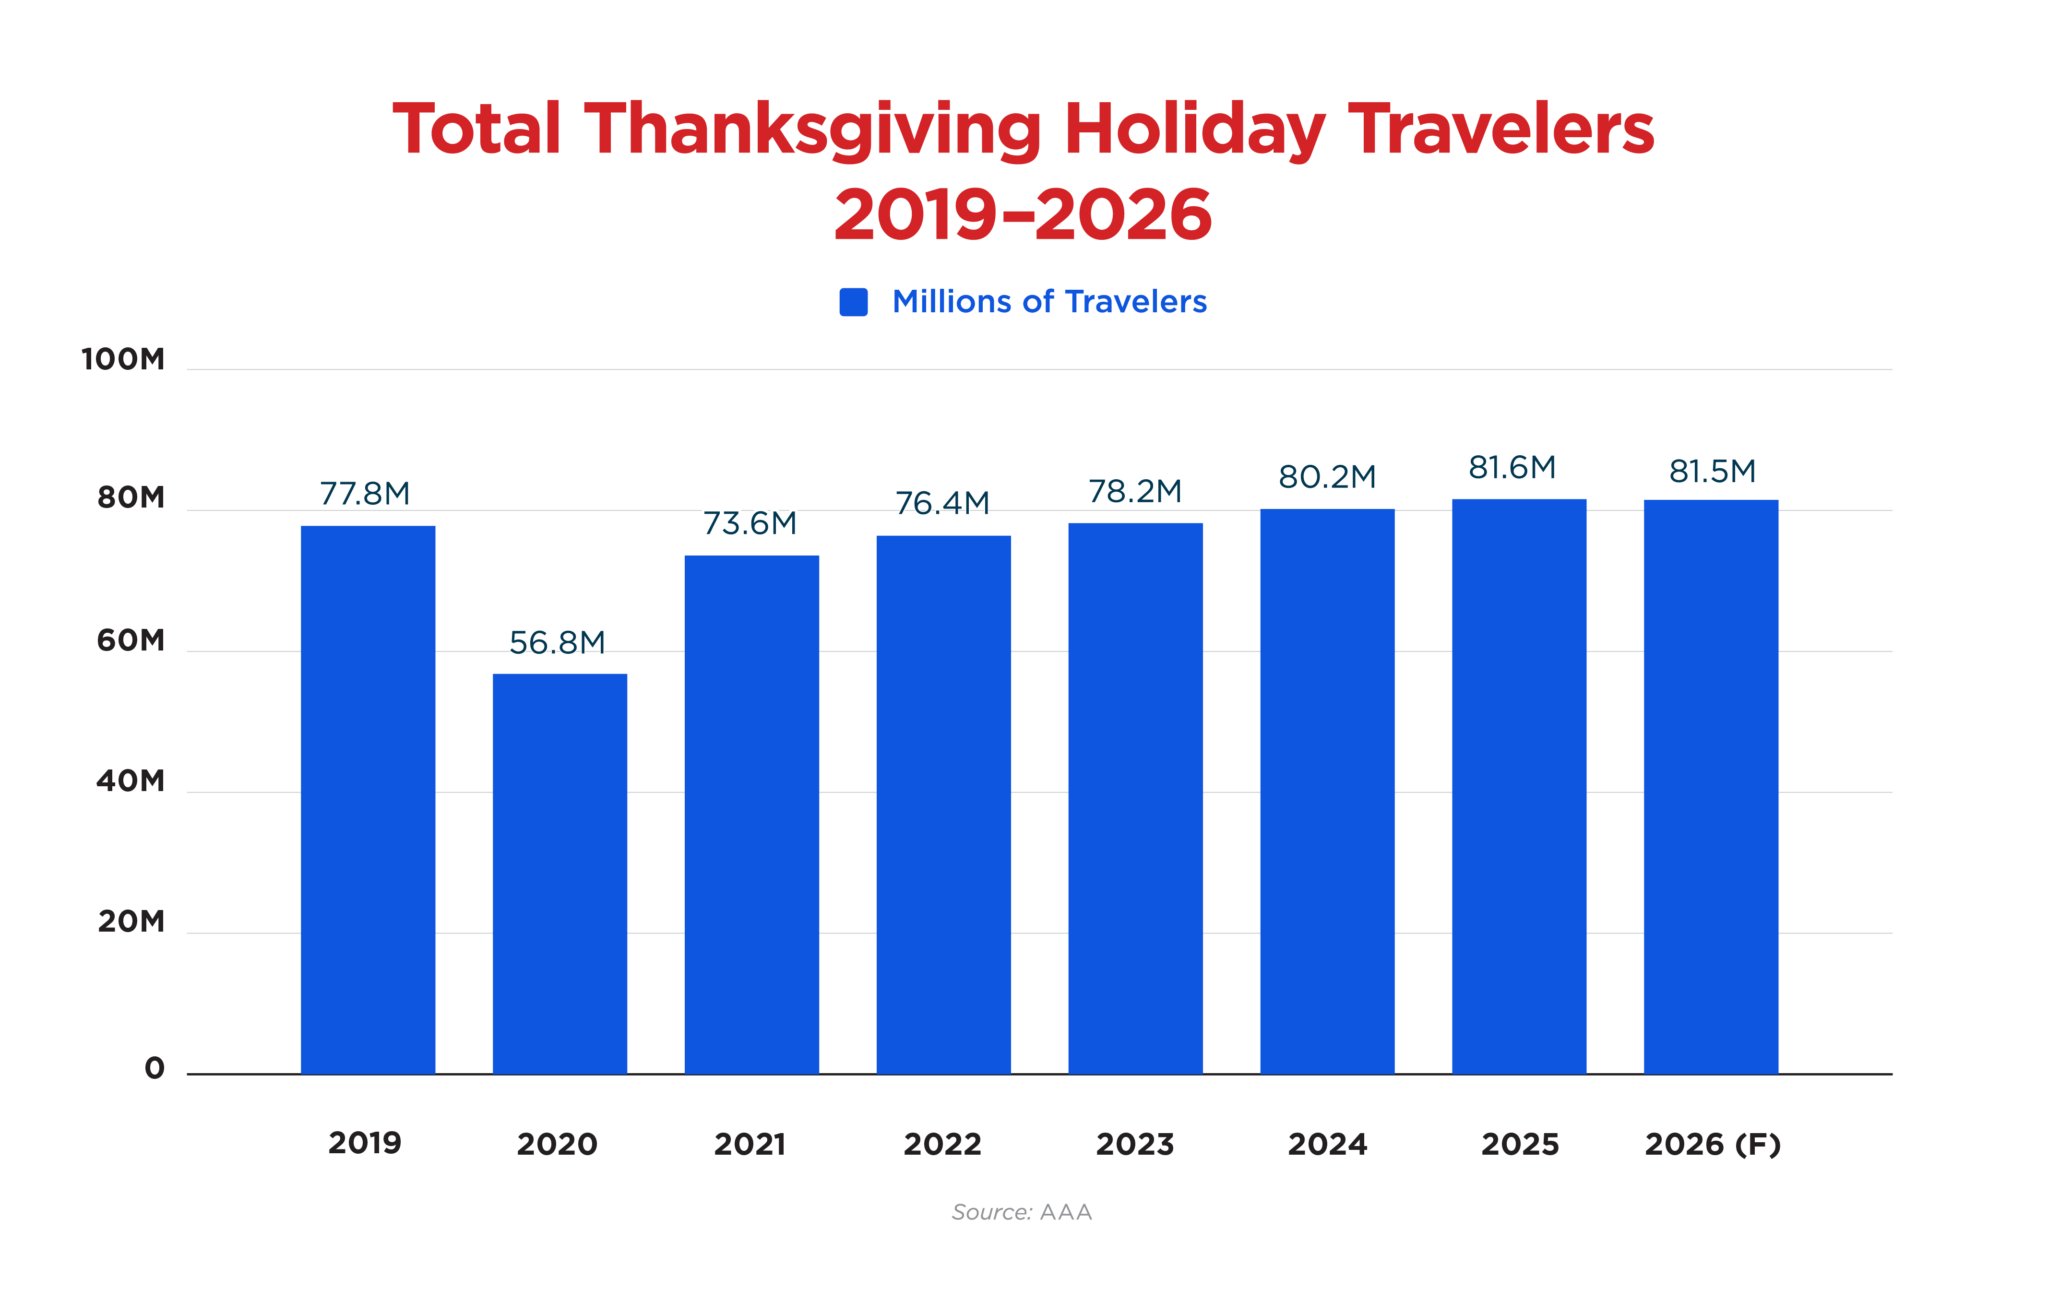
AAA forecasts 81.5 million Americans will travel at least 50 miles from home between November 24 and 30. The total is 121,000 below 2025—essentially flat at this scale—and ends a three-year run of records. The historical bars also show how far the holiday has moved beyond 2019’s 77.8 million travelers. This is a pre-holiday forecast prepared in October, not a count of completed trips. Its value is consistency: AAA applies the same broad traveler definition across years, making the plateau visible even before traffic counters and airline manifests provide the final post-holiday picture.
Source: AAA Newsroom
15. Nearly nine in ten travelers drive
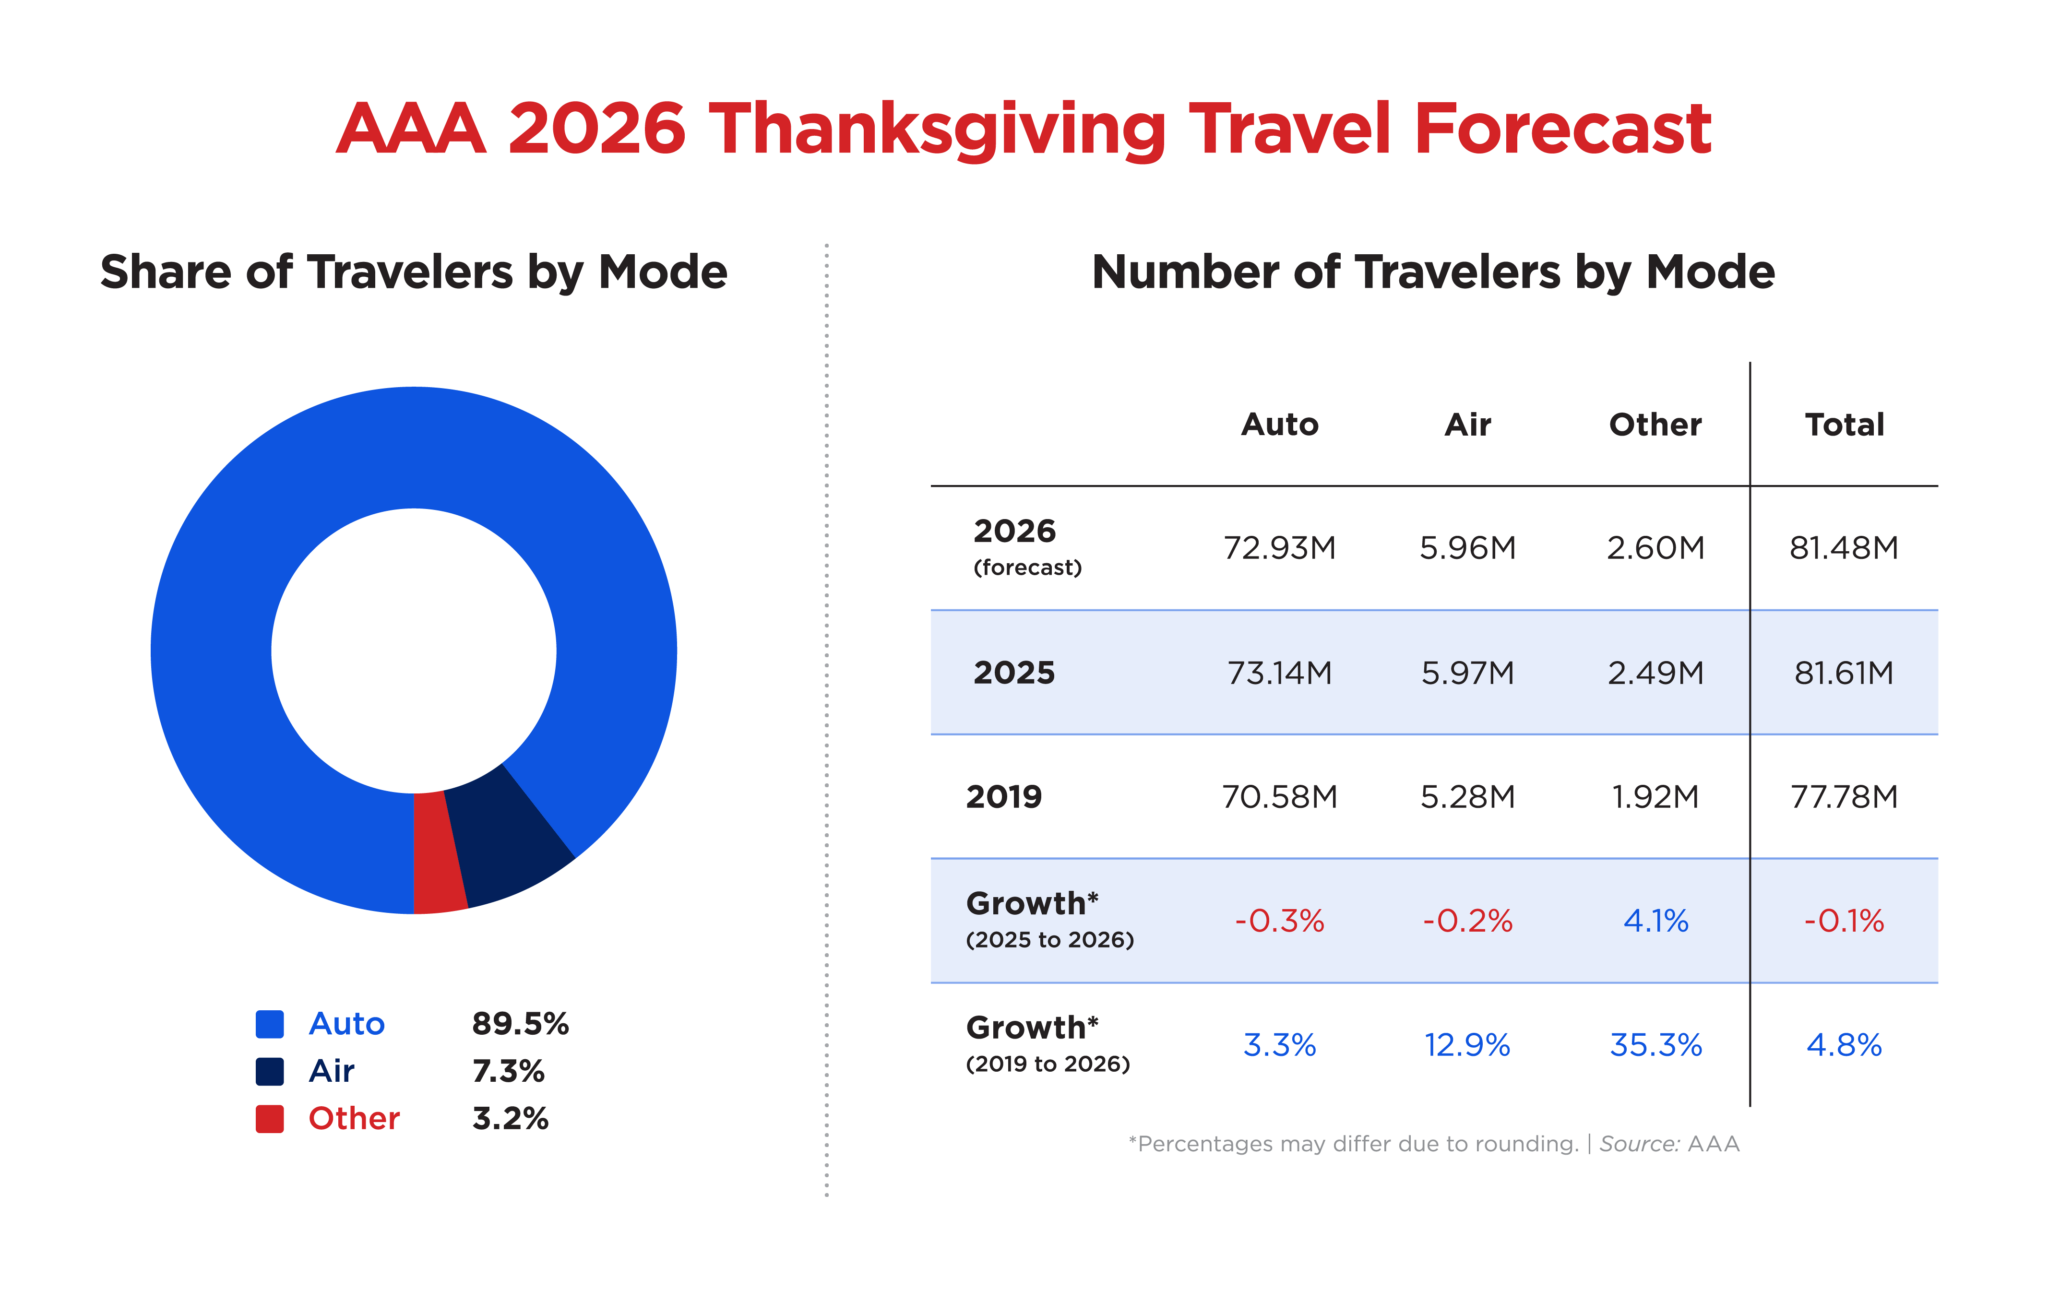
The mode chart makes Thanksgiving’s dependence on the road impossible to miss. AAA expects 72.9 million travelers by car, about 89% of its total. Air accounts for 5.96 million people, while buses, trains, and cruises together reach roughly 2.6 million. The “other” category is the only one forecast to grow strongly, up 4.1% from 2025. These figures count people traveling at least 50 miles, so they are not directly comparable with airline passenger boardings or daily airport screenings. Different travel datasets can describe the same holiday without sharing the same denominator.
Source: AAA Newsroom
16. The check-in map that still looks futuristic
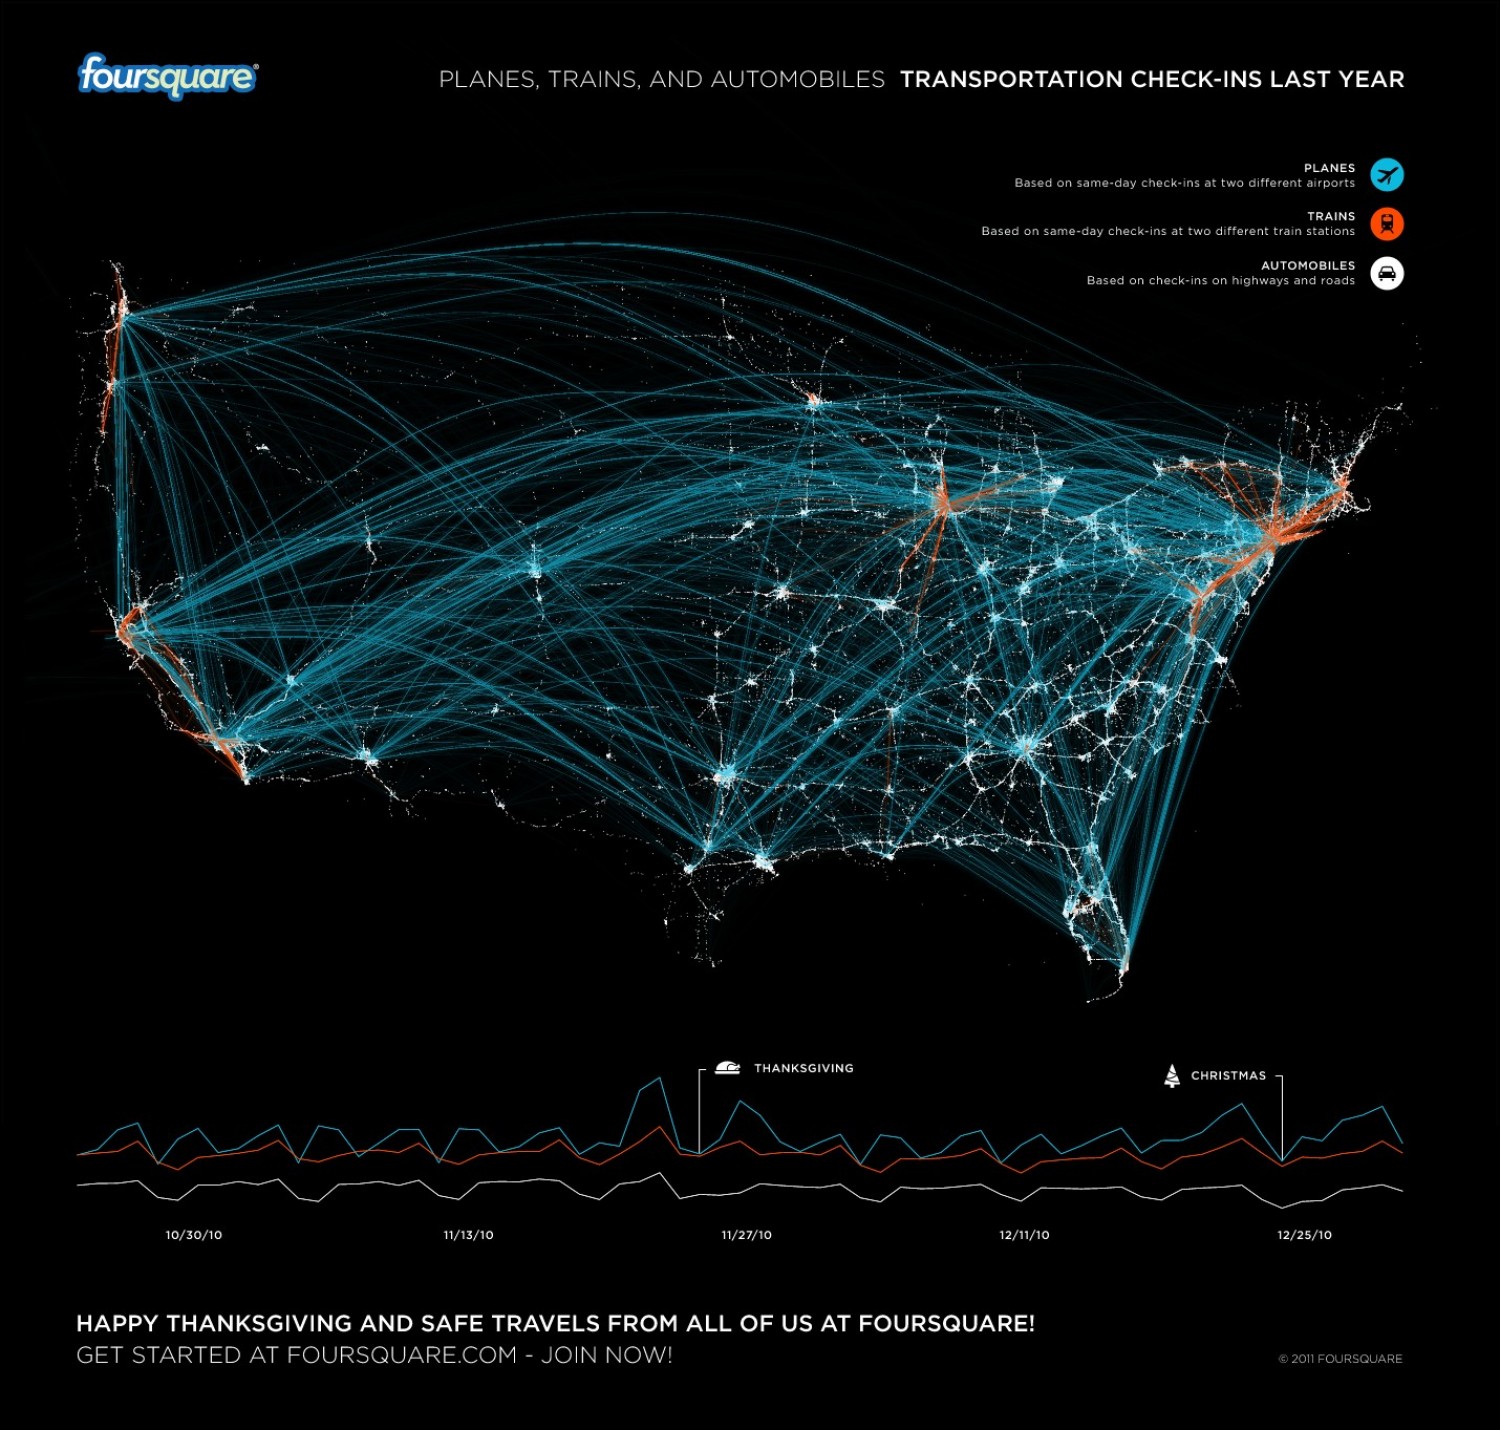
This Foursquare map remains spectacular even though its data belong to 2010. Same-day airport and rail-station check-ins create long arcs between metropolitan hubs, while road check-ins trace denser regional movement. A time series underneath shows the Thanksgiving spike and the larger Christmas pattern. The image predates today’s location-intelligence industry, but the spatial signal is instantly recognizable: coastal gateways, national hub cities, and regional road networks all appear through behavior rather than official schedules. It should be presented strictly as a historical visualization, not as evidence of 2026 travel volume or platform usage.
Source: Foursquare
17. Thanksgiving, brought to you by farmers
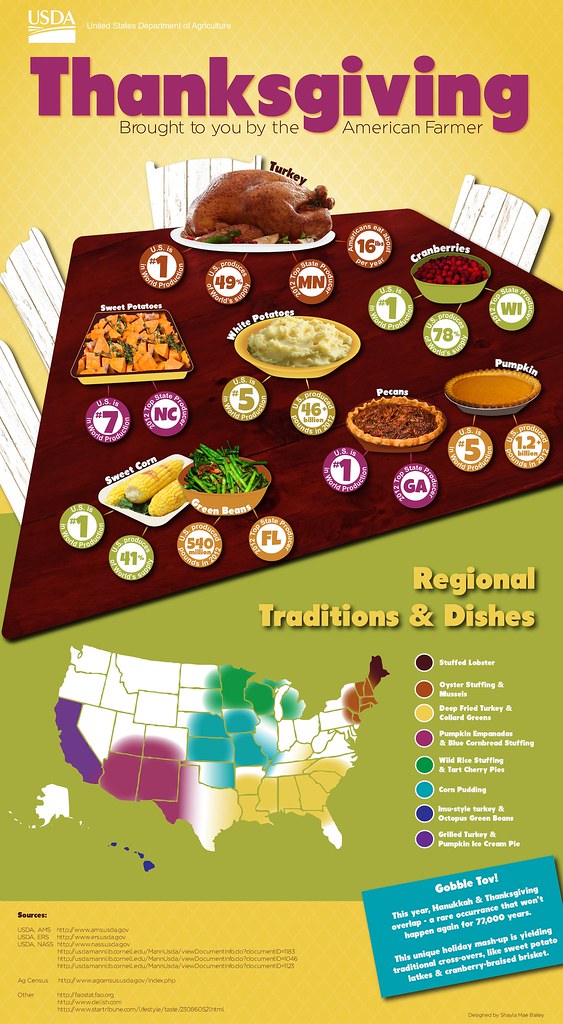
This USDA infographic is older, but it earns a place by turning the table into an agricultural atlas. Minnesota leads the turkey badge, North Carolina the sweet potatoes, Wisconsin the cranberries, and Illinois the pumpkin slice, while a second map adds regional dishes—from oyster stuffing and mussels in the Northeast to tamales in the Southwest. The production figures date to 2012–13 and should not be quoted as current. The geographical structure is the lasting point: a national ritual depends on highly specialized farm regions and a much more diverse set of local traditions than the standard turkey-and-pie menu suggests.
Source: USDA Agricultural Marketing Service
18. Facebook’s wonderfully weird gratitude map
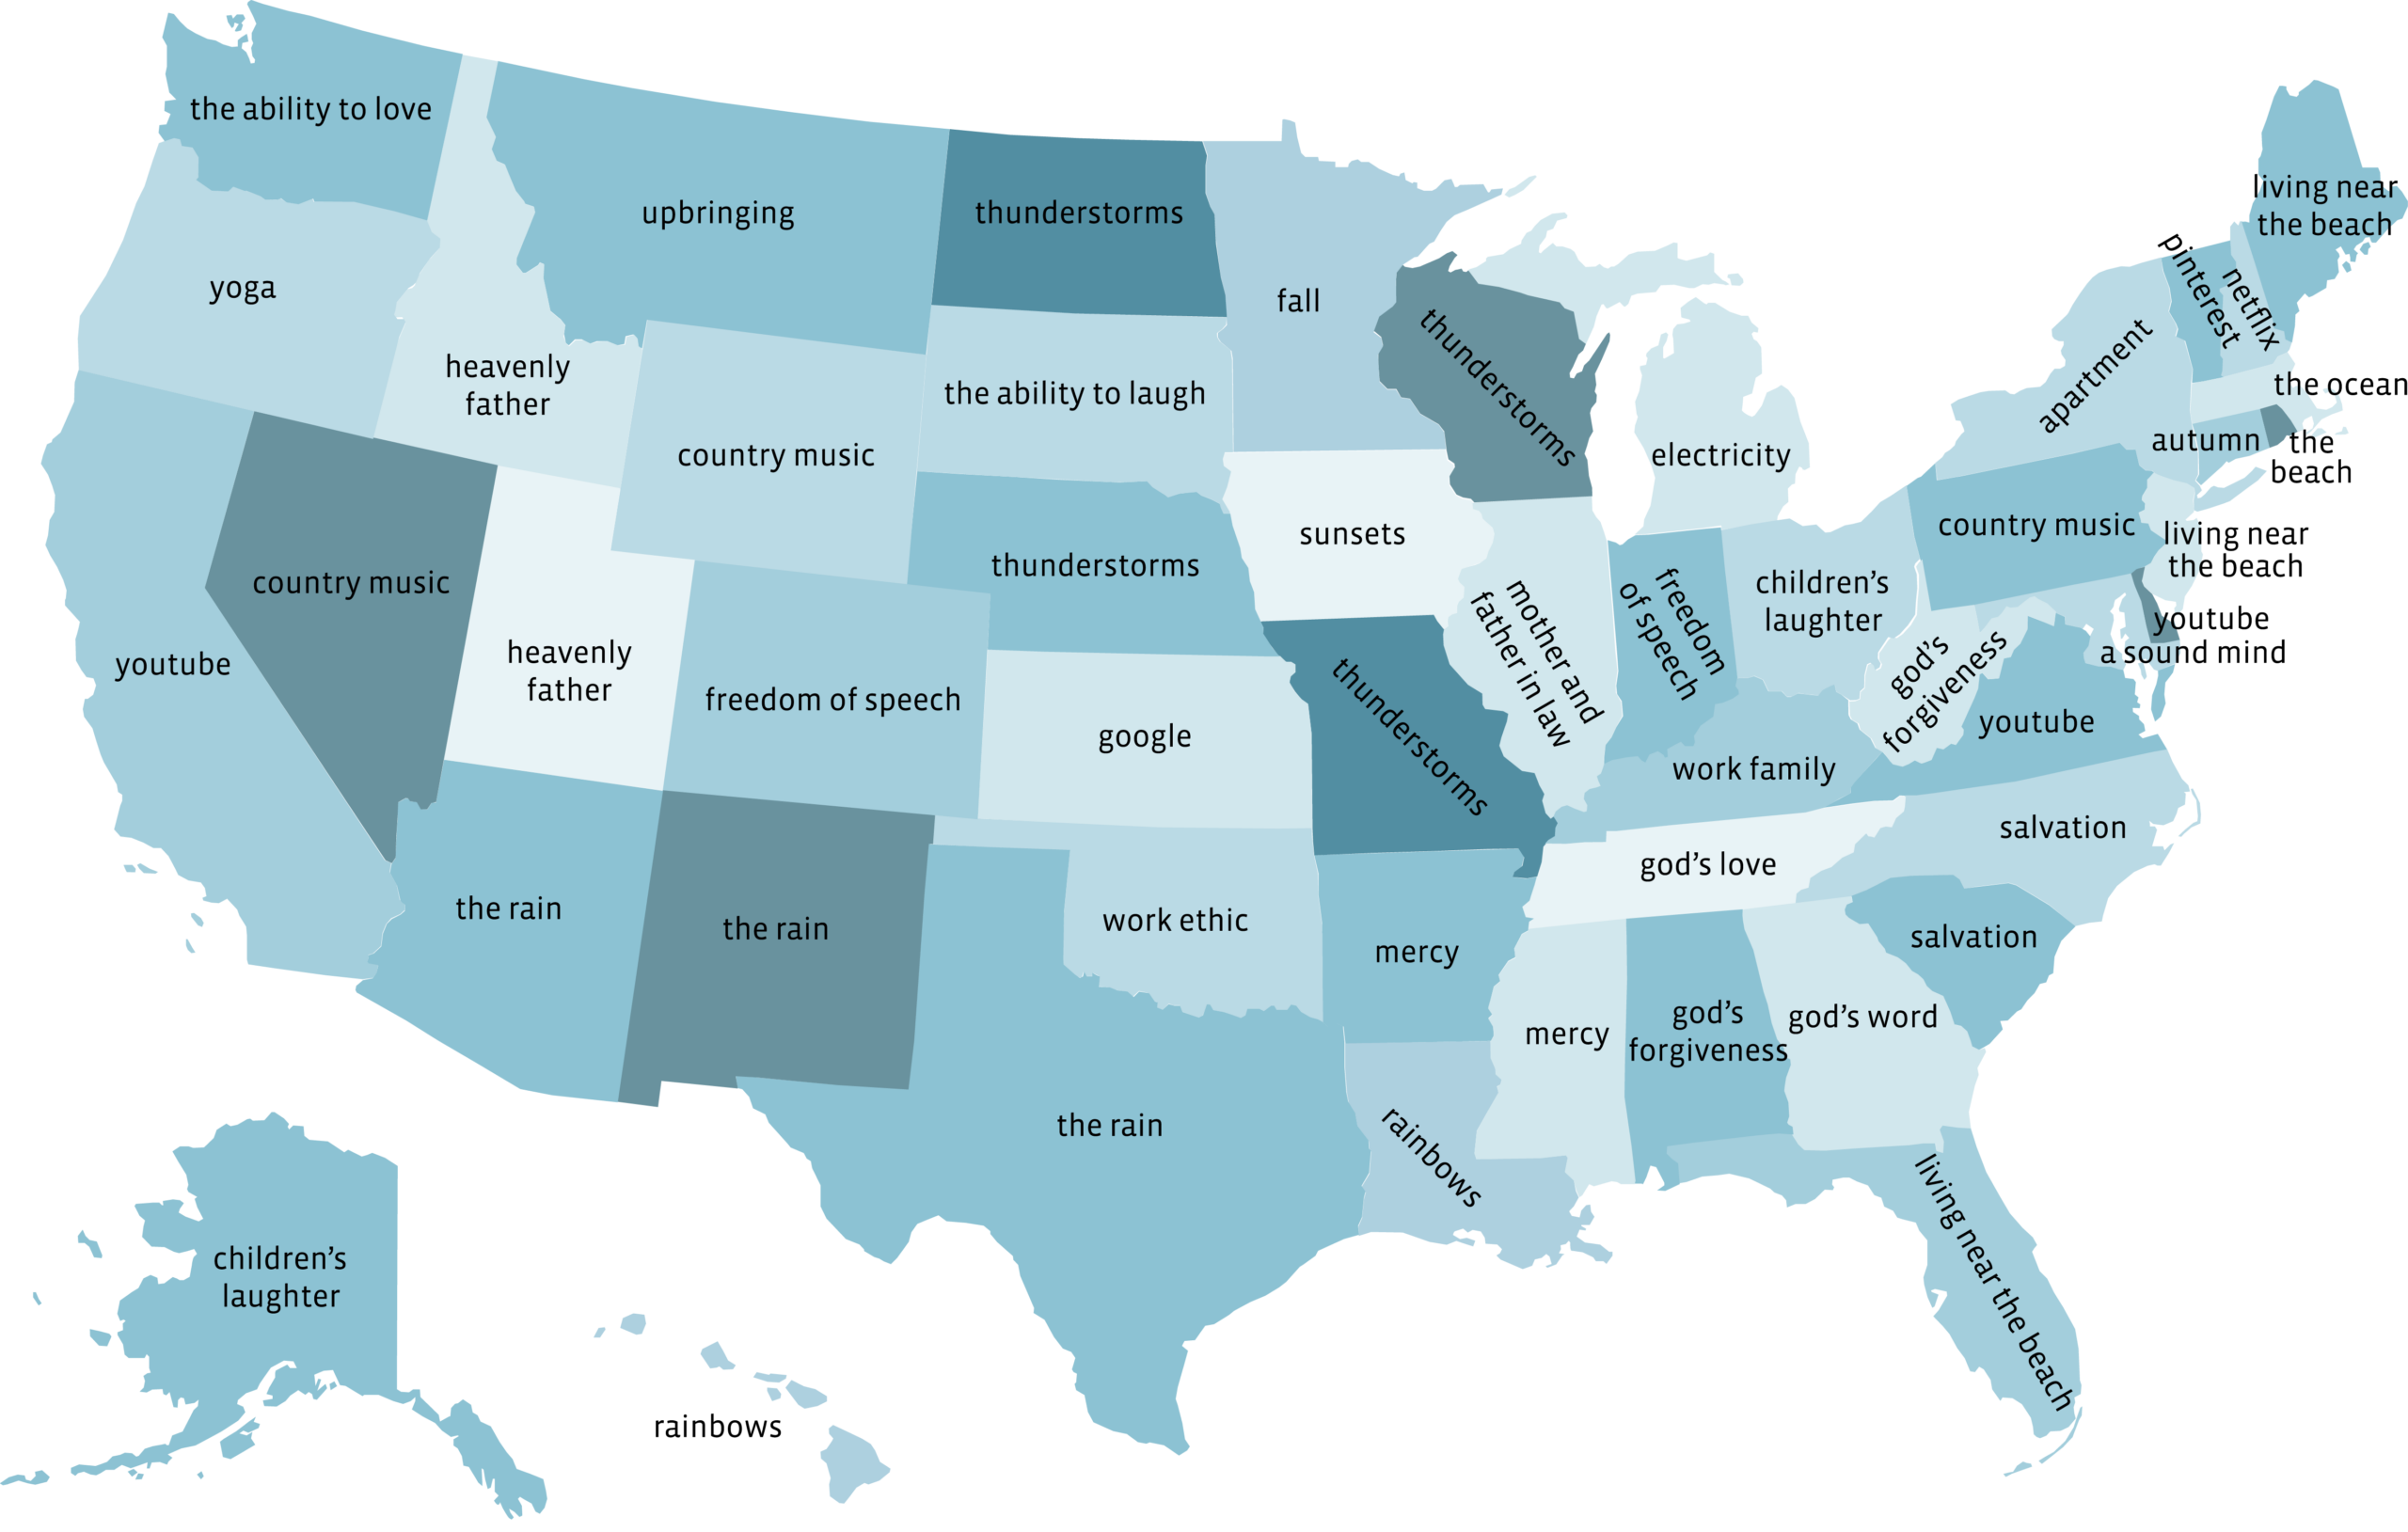
This is the collection’s best social-media time capsule. Facebook Data Science’s 2014 map surfaced unusually distinctive gratitude phrases by state: YouTube in California, Virginia, and Maryland; Google in Kansas; electricity in Michigan; thunderstorms across parts of the Plains and Midwest; and living near the beach in several coastal states. The original methodology page is no longer available, so the visualization cannot support a fresh claim about what Americans value today. Keep the date visible and treat the map as a historical portrait of one platform’s users, not a representative national survey.
Source: Facebook
19. A white Thanksgiving in Washington?
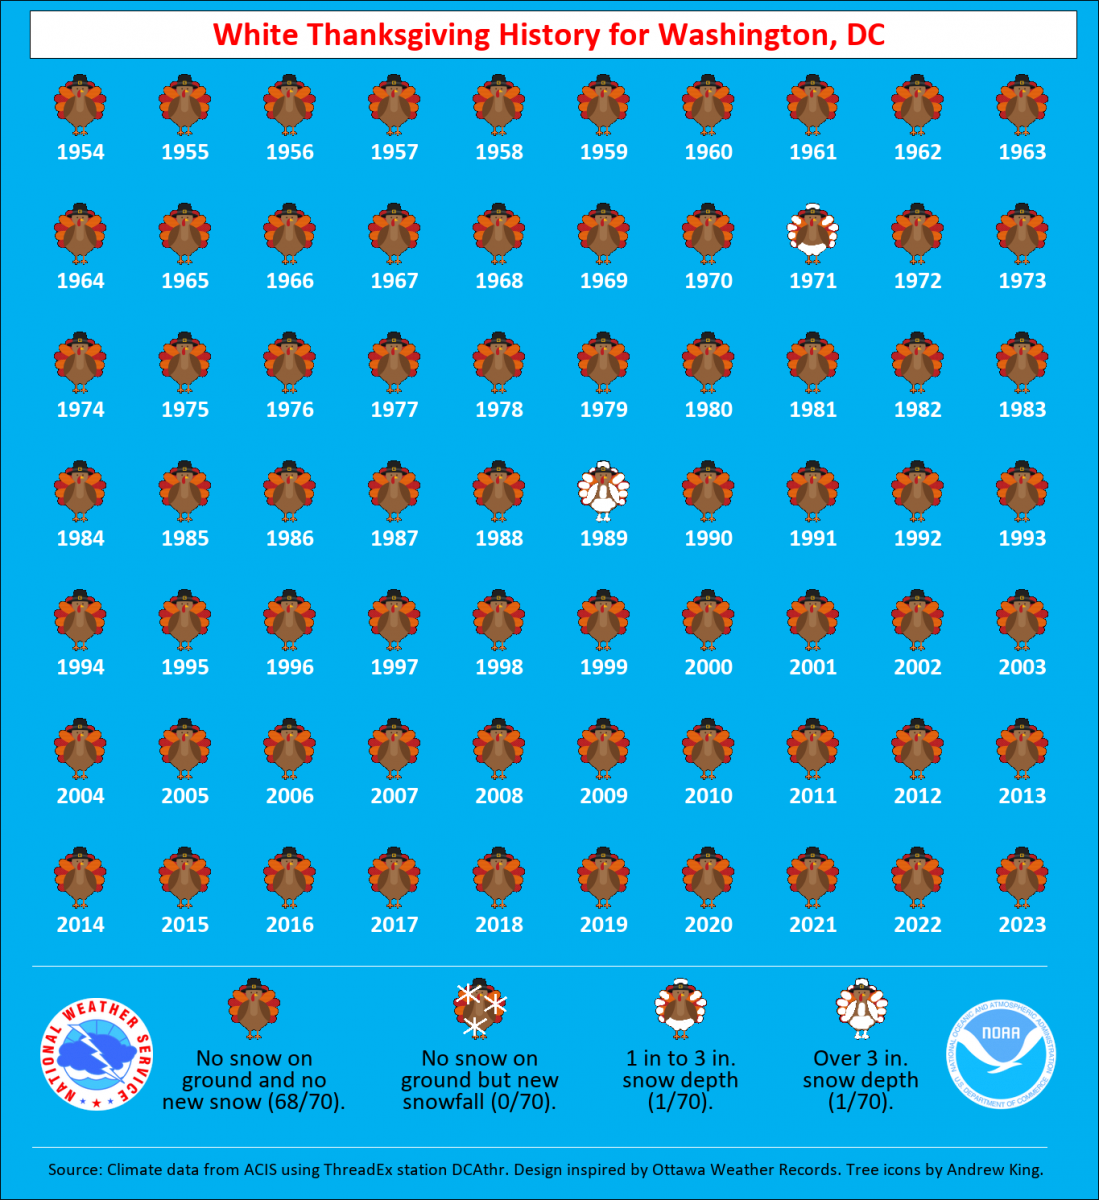
Washington’s white-Thanksgiving record is a lesson in how memorable weather can be statistically rare. The National Weather Service graphic tracks every holiday from 1954 through 2023: most icons show no snow, a small handful mark flurries, and just one indicates at least an inch on the ground. That is local climatology, not a 2026 forecast and not a national snowfall map. Its value is the long record: the picture makes rarity easier to grasp than a single percentage. For publication, pair it with the current forecast only at the last possible editorial update.
Source: National Weather Service
20. The grocery panic peaks before dinner
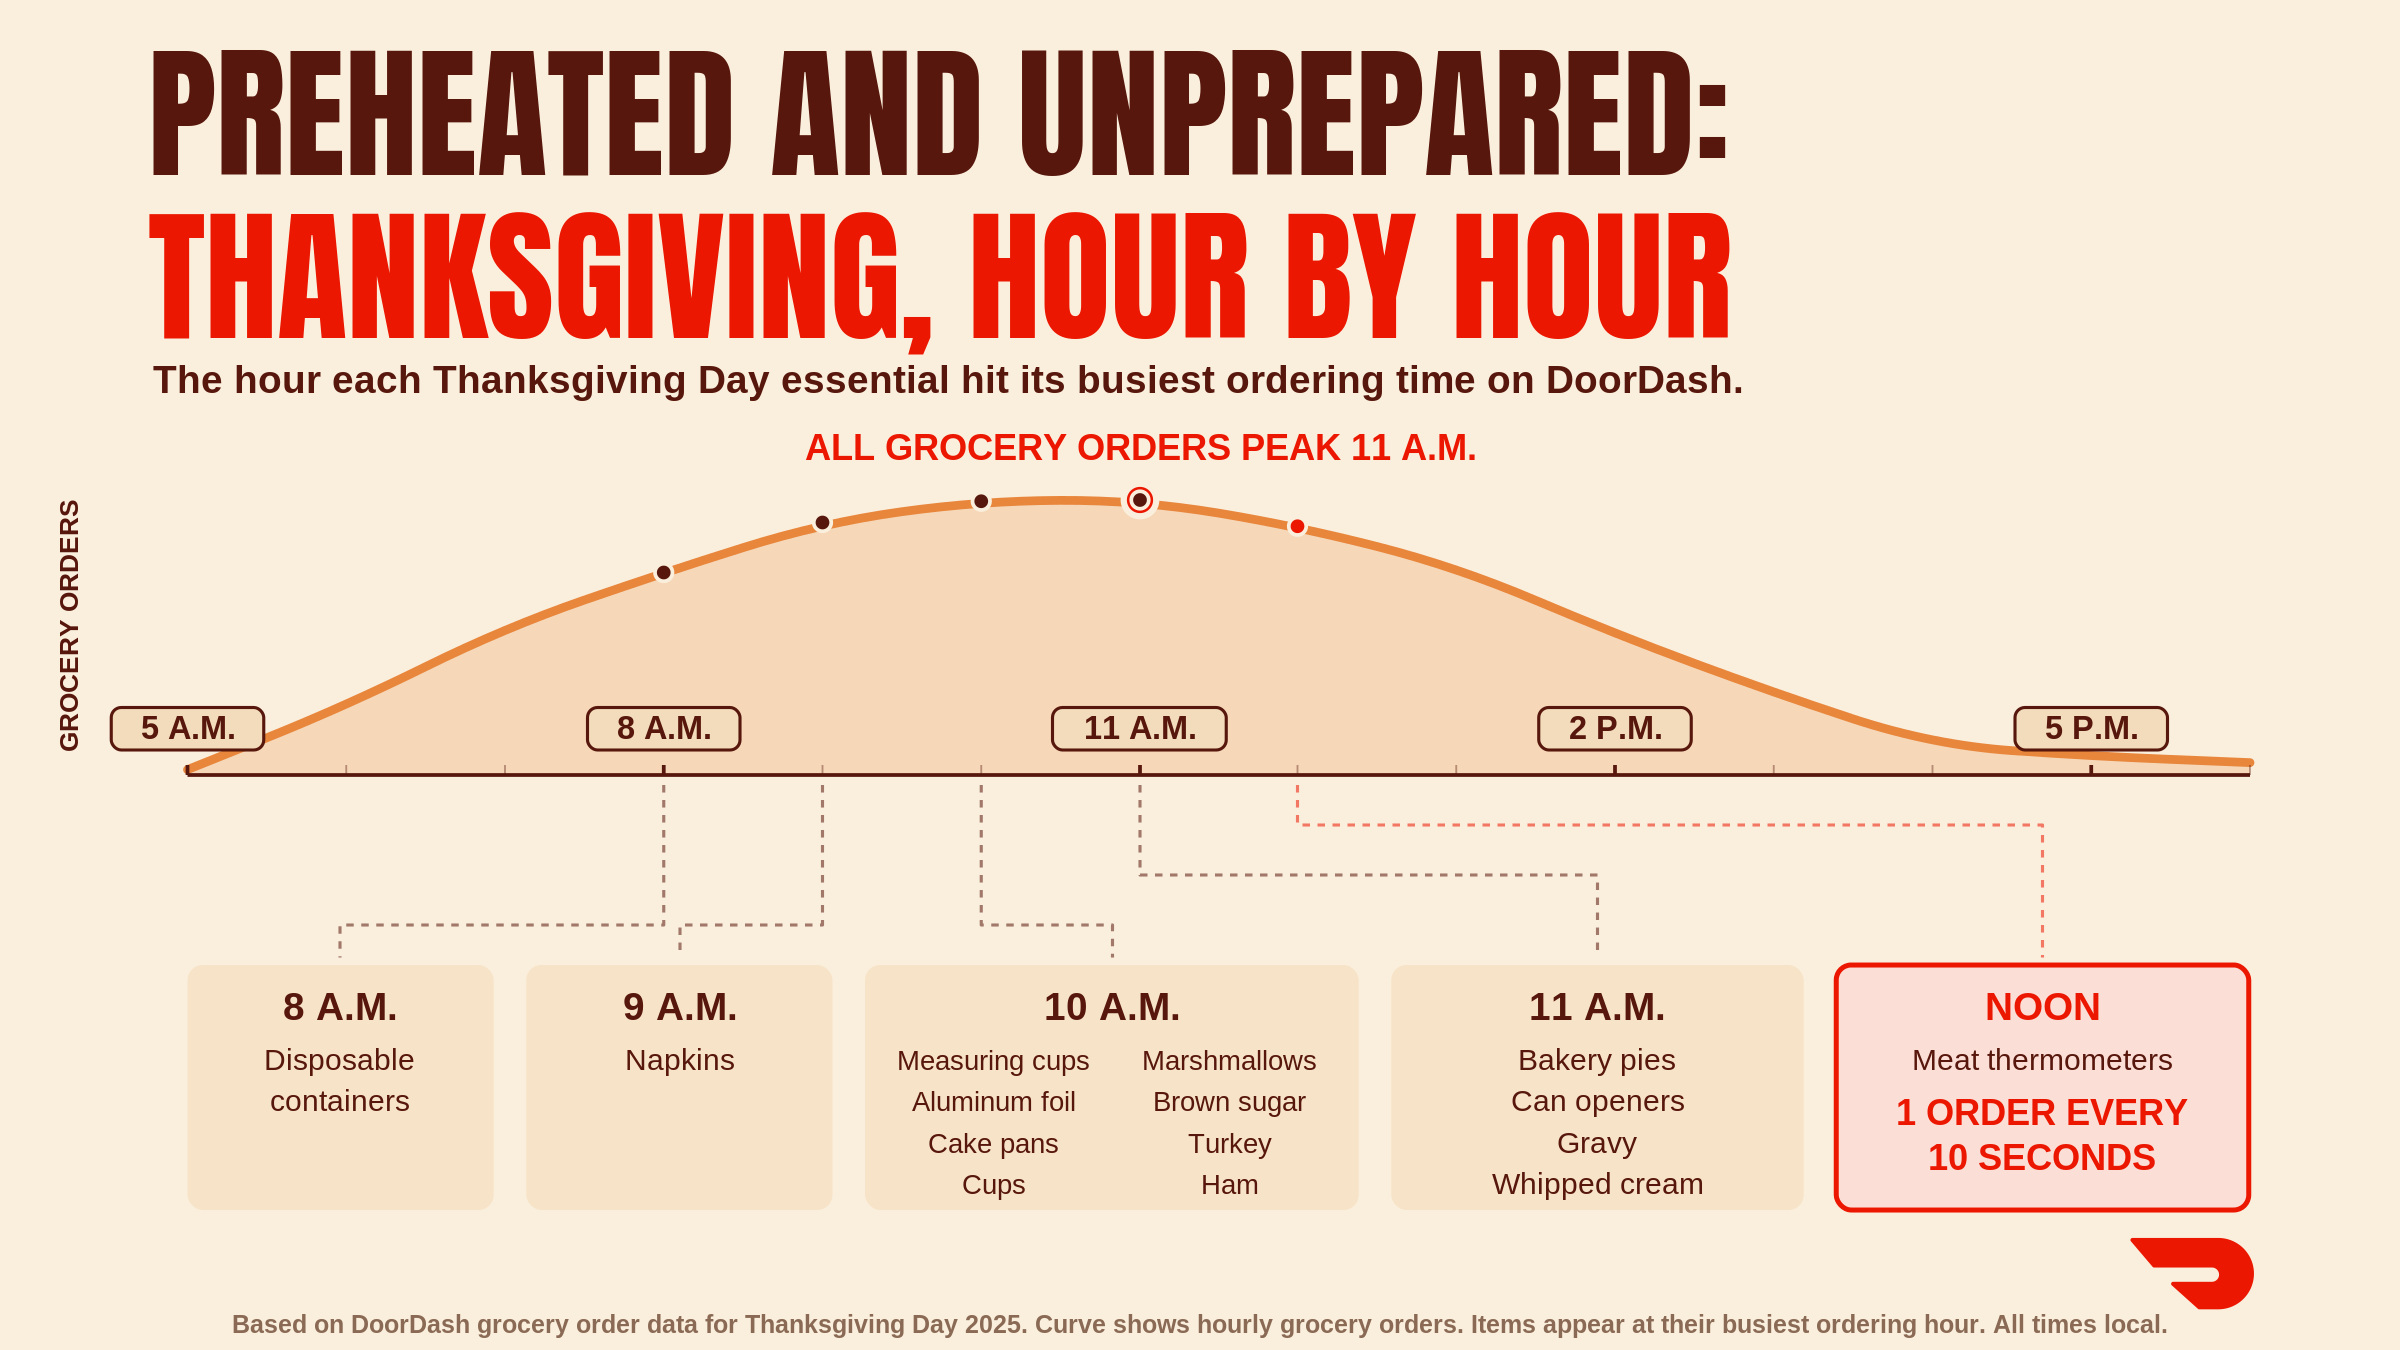
The final graphic follows the holiday hour by hour. DoorDash reports that Thanksgiving Eve was the busiest grocery day of the 2025 period, peaking around 5 p.m. On Thanksgiving Day, grocery demand peaked near 11 a.m.; meat-thermometer orders surged around noon to roughly one every 10 seconds. The pattern is instantly relatable: planning gives way to emergency improvisation. This is platform behavior, not a census of U.S. households, and the percentages use DoorDash’s comparison baseline. Still, few visuals capture the real choreography of the kitchen better than the moment everyone suddenly remembers food safety.
Source: DoorDash
One last slice
Thanksgiving still makes the most sense when it is mapped. Its ingredients come from specialized farm regions, its tastes change across state lines, and its travelers move through national networks that briefly become visible at holiday scale. The older graphics also show how data culture has changed—from check-ins and Facebook posts to transaction-level orders and carefully labeled forecasts. The geography stays compelling; the methods and dates must stay attached.
Originally published November 24, 2016. Updated November 2026 with new maps, charts, and data.


