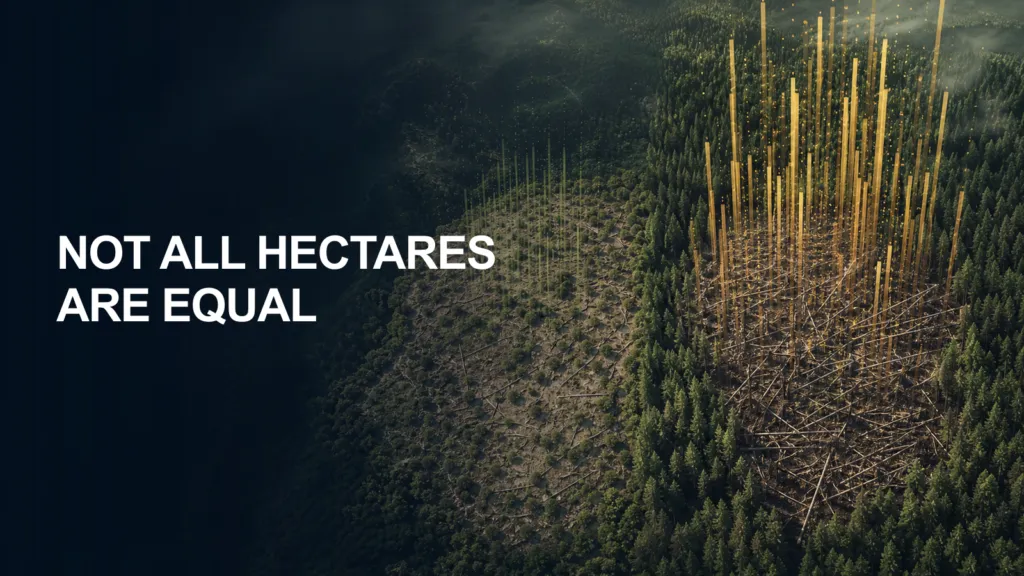

Satellite monitoring usually describes forest loss in hectares. But a hectare disturbed in open Mediterranean woodland does not carry the same carbon consequences as a hectare of mature spruce forest destroyed by wind or bark beetles.
A new Nature Geoscience study measures that difference across 216 million hectares of European forest. It estimates that high-severity natural disturbances and stand-replacing harvests removed 6.5 ± 0.8 petagrams of above-ground biomass between 1985 and 2023—equivalent to roughly 3.2 ± 0.4 petagrams of carbon before regrowth and other carbon flows are considered.
The important finding is not simply that disturbance increased. Since 2018, losses have grown disproportionately because more damage has reached some of Europe’s most biomass-rich forests.
Adding weight to the disturbance map
The researchers combined the Landsat-based European Forest Disturbance Atlas, which maps annual high-severity canopy loss at 30-metre resolution, with a 2019 biomass-density map derived partly from PlanetScope-based canopy heights. They estimated how much biomass different disturbance types removed in each region, then applied those relationships to the 1985–2023 record.
The average event removed 73.5 megagrams of biomass per disturbed hectare, but geography made a large difference. Temperate forests lost 86.9 megagrams per hectare, compared with 60.5 in boreal forests and 26.8 in Mediterranean forests.
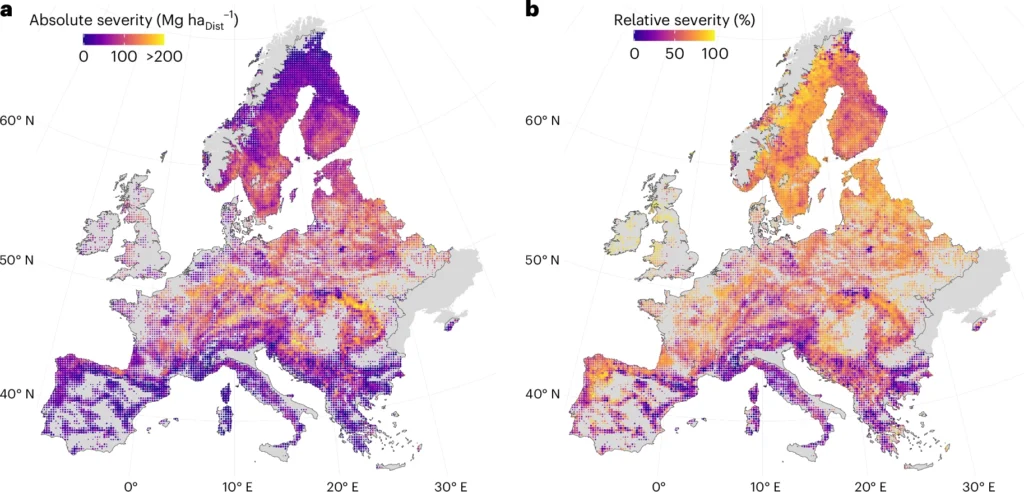
Average severity of AGBD losses due to tree cover loss from natural disturbances and harvests across Europe.
Germany, Czechia, Poland and Slovakia recorded some of the highest absolute losses, reaching 117 megagrams per hectare. These productive forests contain large biomass stocks and extensive Norway spruce stands that became vulnerable to wind and bark beetles after severe drought.
Northern European forests sometimes lost a greater percentage of their standing biomass because of intensive harvesting, but their lower starting stocks often meant fewer tonnes removed per hectare. An area-only indicator cannot show this distinction.
The shift after 2018
The study estimates that annual gross biomass loss rose about 46% from 2018 onward, reaching levels not seen during the previous four decades. Natural-disturbance losses in temperate forests increased 47.6% relative to 1985–2017.
The timing coincides with Central Europe’s 2018–2022 droughts. Water stress weakened trees and enabled multi-year bark beetle outbreaks in mature, biomass-rich forests. Consequently, relatively modest increases in disturbed area produced much larger biomass losses.
This does not make Mediterranean fires unimportant. Fire affects ecosystems, communities and infrastructure in ways biomass alone cannot capture. It does mean that a hectare burned in a lower-biomass landscape cannot be treated as carbon-equivalent to a hectare lost in a dense temperate forest.
Harvest still dominates
Natural events explain much of the recent acceleration, but stand-replacing harvest accounted for 82% of total gross biomass loss over the full study period: 5.3 ± 0.7 petagrams. Natural disturbances represented 18%, or 1.2 ± 0.1 petagrams.
Harvest-related loss was also 28.7% higher during 2018–2023 than in the earlier period. That does not mean all harvested carbon immediately entered the atmosphere. Some remains in wood products and forests can regrow. The result measures biomass removed from living forests, not its complete life cycle.
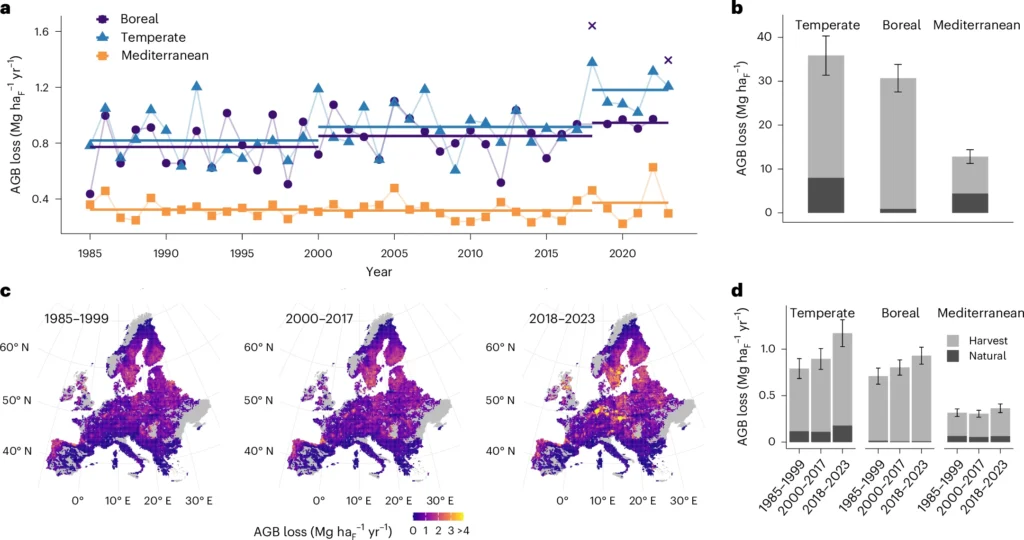
AGB losses from natural disturbances and harvests from 1985 to 2023.
Not a net carbon budget
The 3.2-petagram carbon estimate should not be reported as net emissions. The analysis excludes regrowth, soil carbon, deadwood, harvested wood products and the timing of emissions. It detects high-severity canopy openings, so thinning and lower-severity damage are also missing.
The reconstruction carries additional uncertainty. Biomass maps can underestimate very dense forests, disturbance attribution is imperfect, and the method applies severity relationships observed mainly during 2014–2023 to earlier decades.
These caveats define the study rather than overturn it. This is a spatial estimate of gross biomass removal, not a full European forest-carbon account.
From loss maps to carbon ledgers
The policy implication is straightforward. Forest area alone is a poor proxy for carbon performance. Monitoring systems need to combine disturbed area with biomass density, severity, disturbance agent and recovery.
Landsat provides the historical record, while higher-resolution optical data, radar and lidar can improve estimates of forest structure and biomass. National inventories and carbon models are still needed to track regrowth, wood products and emissions.
Europe’s problem is therefore not only that more forest is being disturbed. Increasingly, disturbance is reaching places where each affected hectare holds more biomass. Forest dashboards need to show that weight, not just the shape of the loss on a map.


#Environment

Next article
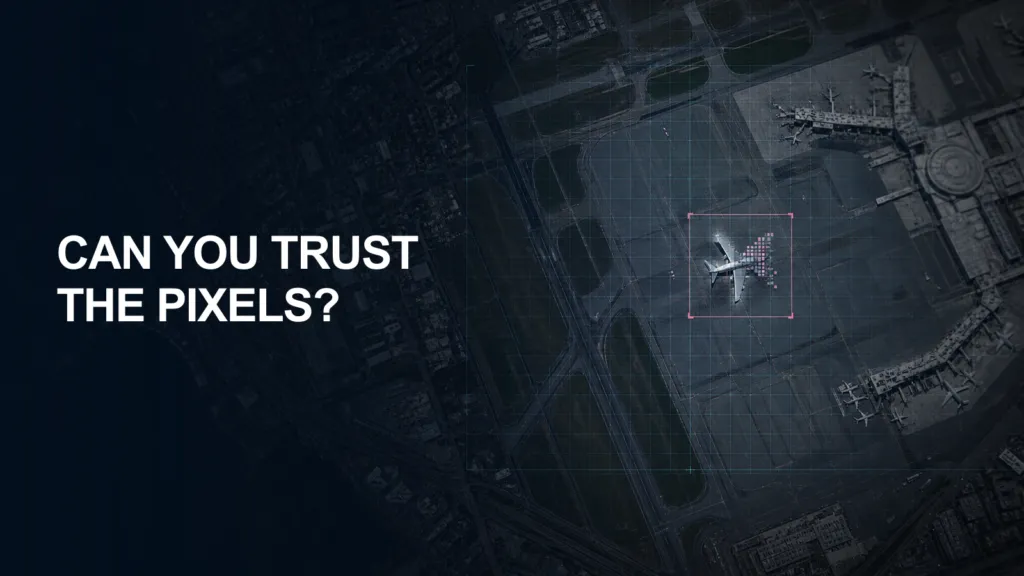
The most dangerous satellite deepfake may not be a completely fabricated landscape. It may be a mostly authentic image in which one small but consequential feature has been added, removed or moved: an aircraft on a runway, a new building, a damaged bridge or a vehicle near a border.
That is the problem addressed by a new prototype benchmark from researchers at Oak Ridge National Laboratory. Their preprint, published on 5 August 2026, introduces a dataset designed not only to classify satellite images as authentic or manipulated, but to identify the exact pixels that were changed.
The timing is striking—and Geoawesome has already documented how quickly the issue moved. On 30 July, we introduced the feature in “Nano Banana Lands in Google Earth and It’s Totally #Geoawesome”, focusing on its potential for planning concepts, historical reconstructions and place-based creative work. Within a day, Google rolled it back after users produced plausible-looking scenes of attacks, disasters and sensitive infrastructure, as we explained in “Google Shuts Down Nano Banana in Google Earth After Misuse Concerns”. The short-lived experiment showed how quickly synthetic content can borrow the visual authority of an established geospatial platform. The Oak Ridge work addresses a narrower technical problem, but one likely to become essential: how should forensic systems evaluate a realistic alteration embedded within genuine remote-sensing data?
Why localization matters
Most deepfake detection is framed as a binary decision. A model receives an image and returns a probability that it is real or synthetic. That may be useful for fully generated pictures, but it is inadequate when only part of an image has been changed.
For a geospatial analyst, the location of the manipulation is often more important than the image-level label. A suspicious object occupying a few dozen pixels could alter an assessment even though more than 99% of the image remains authentic. A localization system should therefore produce a mask showing the manipulated region, giving a human analyst something interpretable to inspect.
The Oak Ridge dataset, called fmow-fake-small, contains 60 images: 30 authentic and 30 manipulated. Every manipulated example has a pixel-level ground-truth mask. The dataset also preserves georeferencing and acquisition metadata, allowing researchers to examine whether forensic performance varies with sensor, pixel size or collection conditions.
That combination is unusual. Large remote-sensing deepfake datasets already exist, including RSFAKE-1M, which contains one million real and one million synthetic examples. But the Oak Ridge researchers argue that existing collections often lack masks suitable for localization, use fully generated images rather than localized alterations, or contain visible artifacts that make detection unrealistically easy.
How the fake images were built
The source imagery comes from Functional Map of the World, or fMoW, a dataset of more than one million images collected across roughly 200 countries by WorldView-2, WorldView-3, GeoEye-1 and QuickBird-2. The researchers used RGB, eight-bit pansharpened images and converted them into georeferenced GeoTIFFs using the accompanying metadata.
They then created ten examples for each of three manipulation types.
The first is a simple splice: a rectangular crop from one image is inserted into another. The benchmark includes splices from 16 by 16 to 256 by 256 pixels. Crucially, the crop is resampled using the physical ground dimensions and pixel resolution of the destination image. This reduces the scale inconsistencies that can reveal a naive cut-and-paste operation.
The second type is an object splice. The researchers used Meta’s Segment Anything model to extract objects or land-cover features and then manually curated the masks and placed the objects in plausible locations. Targets include vehicles, pools, buildings, runways, helipads, tennis courts and areas of vegetation or bare ground.
The third type uses diffusion-model inpainting. The team employed RSPaint, a Stable Diffusion model fine-tuned for remote-sensing imagery. A reference object or surface—such as an aircraft, building, dirt road, agricultural field or green space—is inserted into a user-defined part of the base image.
Here, geographic scale becomes a forensic issue. A generative model may produce a visually convincing aircraft that is physically far too large relative to the runway. The researchers address this by matching the real-world dimensions of reference objects and destination masks. They also crop the working image so the masked region occupies 15% to 30% of the model input, a range that produces more reliable inpainting.
These details make the examples harder than generic AI-image tests. Remote-sensing forgeries must respect not only visual texture but ground sampling distance, object dimensions and the spatial relationships among features.
A useful benchmark, not a finished solution
The dataset’s name is appropriately candid: it is small. Thirty manipulated images cannot support the training of a robust detector, and the authors explicitly recommend using the collection for evaluation rather than training.
Its diversity is also limited. Only one manipulation category uses a generative model, and all diffusion examples come from the same RSPaint workflow. Object placement and mask definition require substantial manual work. This improves visual quality but makes the construction process difficult to scale.
The paper also does not present a comprehensive leaderboard showing how current forensic models perform. It describes a dataset-construction method and releases a prototype benchmark. Claims that it “solves” satellite deepfake detection would therefore be premature.
Yet its limitations reveal an important reality: constructing a small number of credible, spatially consistent satellite forgeries can be more valuable for stress-testing than generating millions of obviously artificial images. A detector that performs well on low-quality fakes may simply be learning compression artifacts, warped geometry or model-specific signatures. Such shortcuts often fail when the image generator changes.
The stronger test is whether a system can identify a small, semantically plausible change without relying on an obvious visual flaw.
Detection is only one layer of trust
Even a much larger version of fmow-fake-small would not be sufficient by itself. Detection models face an adversarial and constantly changing problem: new generators appear, editing methods improve, and common forensic traces disappear through cropping, recompression or screenshots.
Geospatial verification will therefore need several complementary layers. Pixel-level forensic analysis can flag suspicious regions. Acquisition metadata can be checked for internal consistency. Analysts can compare the image with earlier or later collections, alternative sensors and independent providers. Cryptographic provenance could help verify the origin and processing history of imagery before it reaches a public platform.
The most resilient workflow will combine these methods rather than assume that a single AI detector can serve as a universal truth machine.
That is particularly important because satellite imagery occupies an unusual position. It is both a technical dataset and a persuasive visual artifact. Governments, journalists, insurers, environmental monitors and courts use it as evidence about events that may be inaccessible from the ground. A small alteration can therefore carry consequences far beyond the number of pixels involved.
The Oak Ridge benchmark is preliminary, but it asks the right question. In the era of synthetic geography, verifying an image is not enough. Analysts also need to know exactly where reality may have been edited.
The dataset is publicly available through Hugging Face.