
Hey, Geoawesome community! We’re excited to introduce an original series called “You Are #Geoawesome” where we invite you to share what makes geospatial and remote sensing technology truly amazing. This is your chance to showcase your passion and inspire others, and we want to make it as easy as possible for you to participate! Here’s everything you need to know to get started:
✨ What is the “You Are #Geoawesome” Series?
The series is all about highlighting the people who make our community special. Whether you’re a GIS expert, a drone enthusiast, or simply someone who loves working with geospatial technology, we want to hear your story! Share a video that showcases your enthusiasm for the field—maybe it’s about a favorite tool you use, a unique project you’ve worked on, or an inspiring colleague who has made an impact on your career.
? How to Record Your Video:
-
Plan Your Content:
Decide what you want to talk about. It could be your personal experience in the geospatial industry, a cool project you’ve been part of, or why you think geospatial technology is changing the world.
-
Record the Video:
- Keep it under 3 minutes.
- Use any device you’re comfortable with, it can be your phone, camera, or laptop.
- There’s no need to worry about adding music or graphics; keep it simple and authentic. Our team will handle all the post-production work, including editing, adding background music, and inserting graphics. You can add your comments or upload your graphic if you’d love to! We’ll do the rest!
-
What to Include:
- Introduction: Start by introducing yourself (e.g., your name, job title, and location).
- Your Geoawesome Story: Talk about your background and share why you think geospatial is awesome. It could be a personal story, your experience with a tool, or a project that left an impact.
- End with Enthusiasm: Close with a shoutout to the Geoawesome community or mention why you love being a part of it.
-
Video Quality Tips:
- Good Lighting: Make sure your face is well-lit.
- Clear Sound: Record in a quiet place to avoid background noise.
- Camera Position: Keep the camera steady and at eye level.
? How to Submit:
Once you’re happy with your video, simply email it to us at info@geoawesome.com. Include your name, job title, and a brief description of what your video is about. Our team will review it, and if selected, it will be featured on our website and social media channels.
? Example Video:
To get an idea of what we’re looking for, check out the first video by our Team Support Employee, Sebastian! His story highlights how geospatial technology has influenced his career choice and what makes the field so inspiring. Watch his recording on our website or social media pages (e.g. YouTube).
? Get Involved and Be Featured!
We’re extremely happy to see what makes geospatial technology special for you. This is your chance to inspire others, make connections, and celebrate the innovation within our community. So, grab your camera, share your story, and become a part of the “You Are #Geoawesome” series!
? Connect with Us:
? info@geoawesome.com
? Geoawesome Website
FB: /geoawesome.digital
IG: /geoawesome.digital
X: @geoawesome_dgtl
LN: /geoawesome
Let’s keep the #Geoawesome spirit alive!
Did you like this post? Read more and subscribe to our monthly newsletter!


#Ideas

Next article
Imagine standing atop a hill, gazing across a landscape dotted with weather stations. Each station provides temperature data for its exact location, but what about the areas in between? How do we estimate the temperature at any given point across the entire landscape? This is where interpolation in GIS comes into play – a set of techniques that help us fill in the gaps between known data points.
In this article, we’ll explore what interpolation is, what it’s used for, and the types of data it can handle, while breaking down some of the most common methods in simple terms. Whether you’re a GIS professional, a student, or just a curious geospatial enthusiast, who wants to know how to create continuous surfaces from scattered data.
What is Interpolation in GIS?
Interpolation is a statistical method used to estimate unknown values between two or more known data points. In GIS, interpolation allows us to create continuous surfaces (like temperature, elevation, or pollution levels) from discrete samples collected at specific locations. Essentially, it’s a way of predicting values for all locations within an area based on the values at sampled points.
Why Do We Need Interpolation?
- Data Completeness: In many cases, it’s impractical or impossible to collect data for every point in an area. Interpolation helps fill in these gaps and overcomes the limitations of data collection by enabling analysis in areas with no direct measurements.
- Surface Creation: Interpolation enables the creation of continuous surfaces (raster layers) from point data, which is essential for analysis and visualization. This creation of detailed raster layers enhances visualization and spatial analysis capabilities.
- Decision Making: Interpolated surfaces can inform decisions in environmental management, urban planning, agriculture, and many fields. It also allows for predictions and trend analysis.
Cost Effectiveness: By bridging gaps and creating comprehensive spatial representations, interpolation reduces the need for extensive field sampling, while maximizing the value of existing data points.
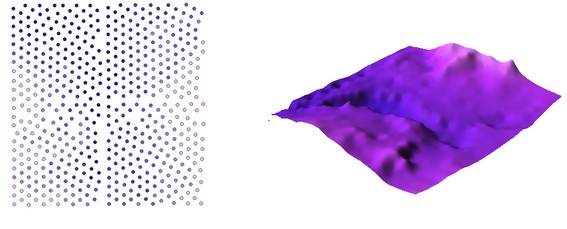
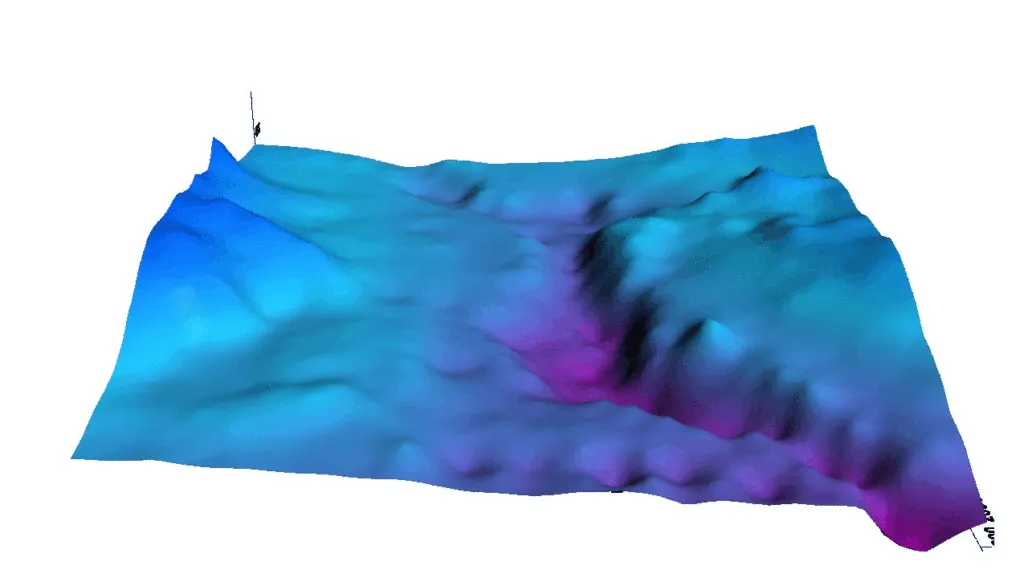
Turning Points into Surfaces
What Data Can Be Interpolated?
Interpolation is typically used with spatial data that varies continuously across a landscape. Common examples include:
- Elevation Data: Creating digital elevation models (DEMs) from contour lines or spot heights.
- Climate and Weather Data: Estimating temperature, precipitation (rainfall, snowfall), humidity, and wind speed and direction data across a region.
- Environmental Variables: Mapping soil properties (pH, texture, nutrient content, water quality parameters (dissolved oxygen, salinity), and air quality indices (particulate matter, ozone levels).
- Resource Distribution: Predicting the location of minerals, oil, or other resources.
Interpolation Methods Explained
There are many interpolation methods available in GIS, each with its own strengths and assumptions. Let’s explore some of the most commonly used techniques in simple terms.
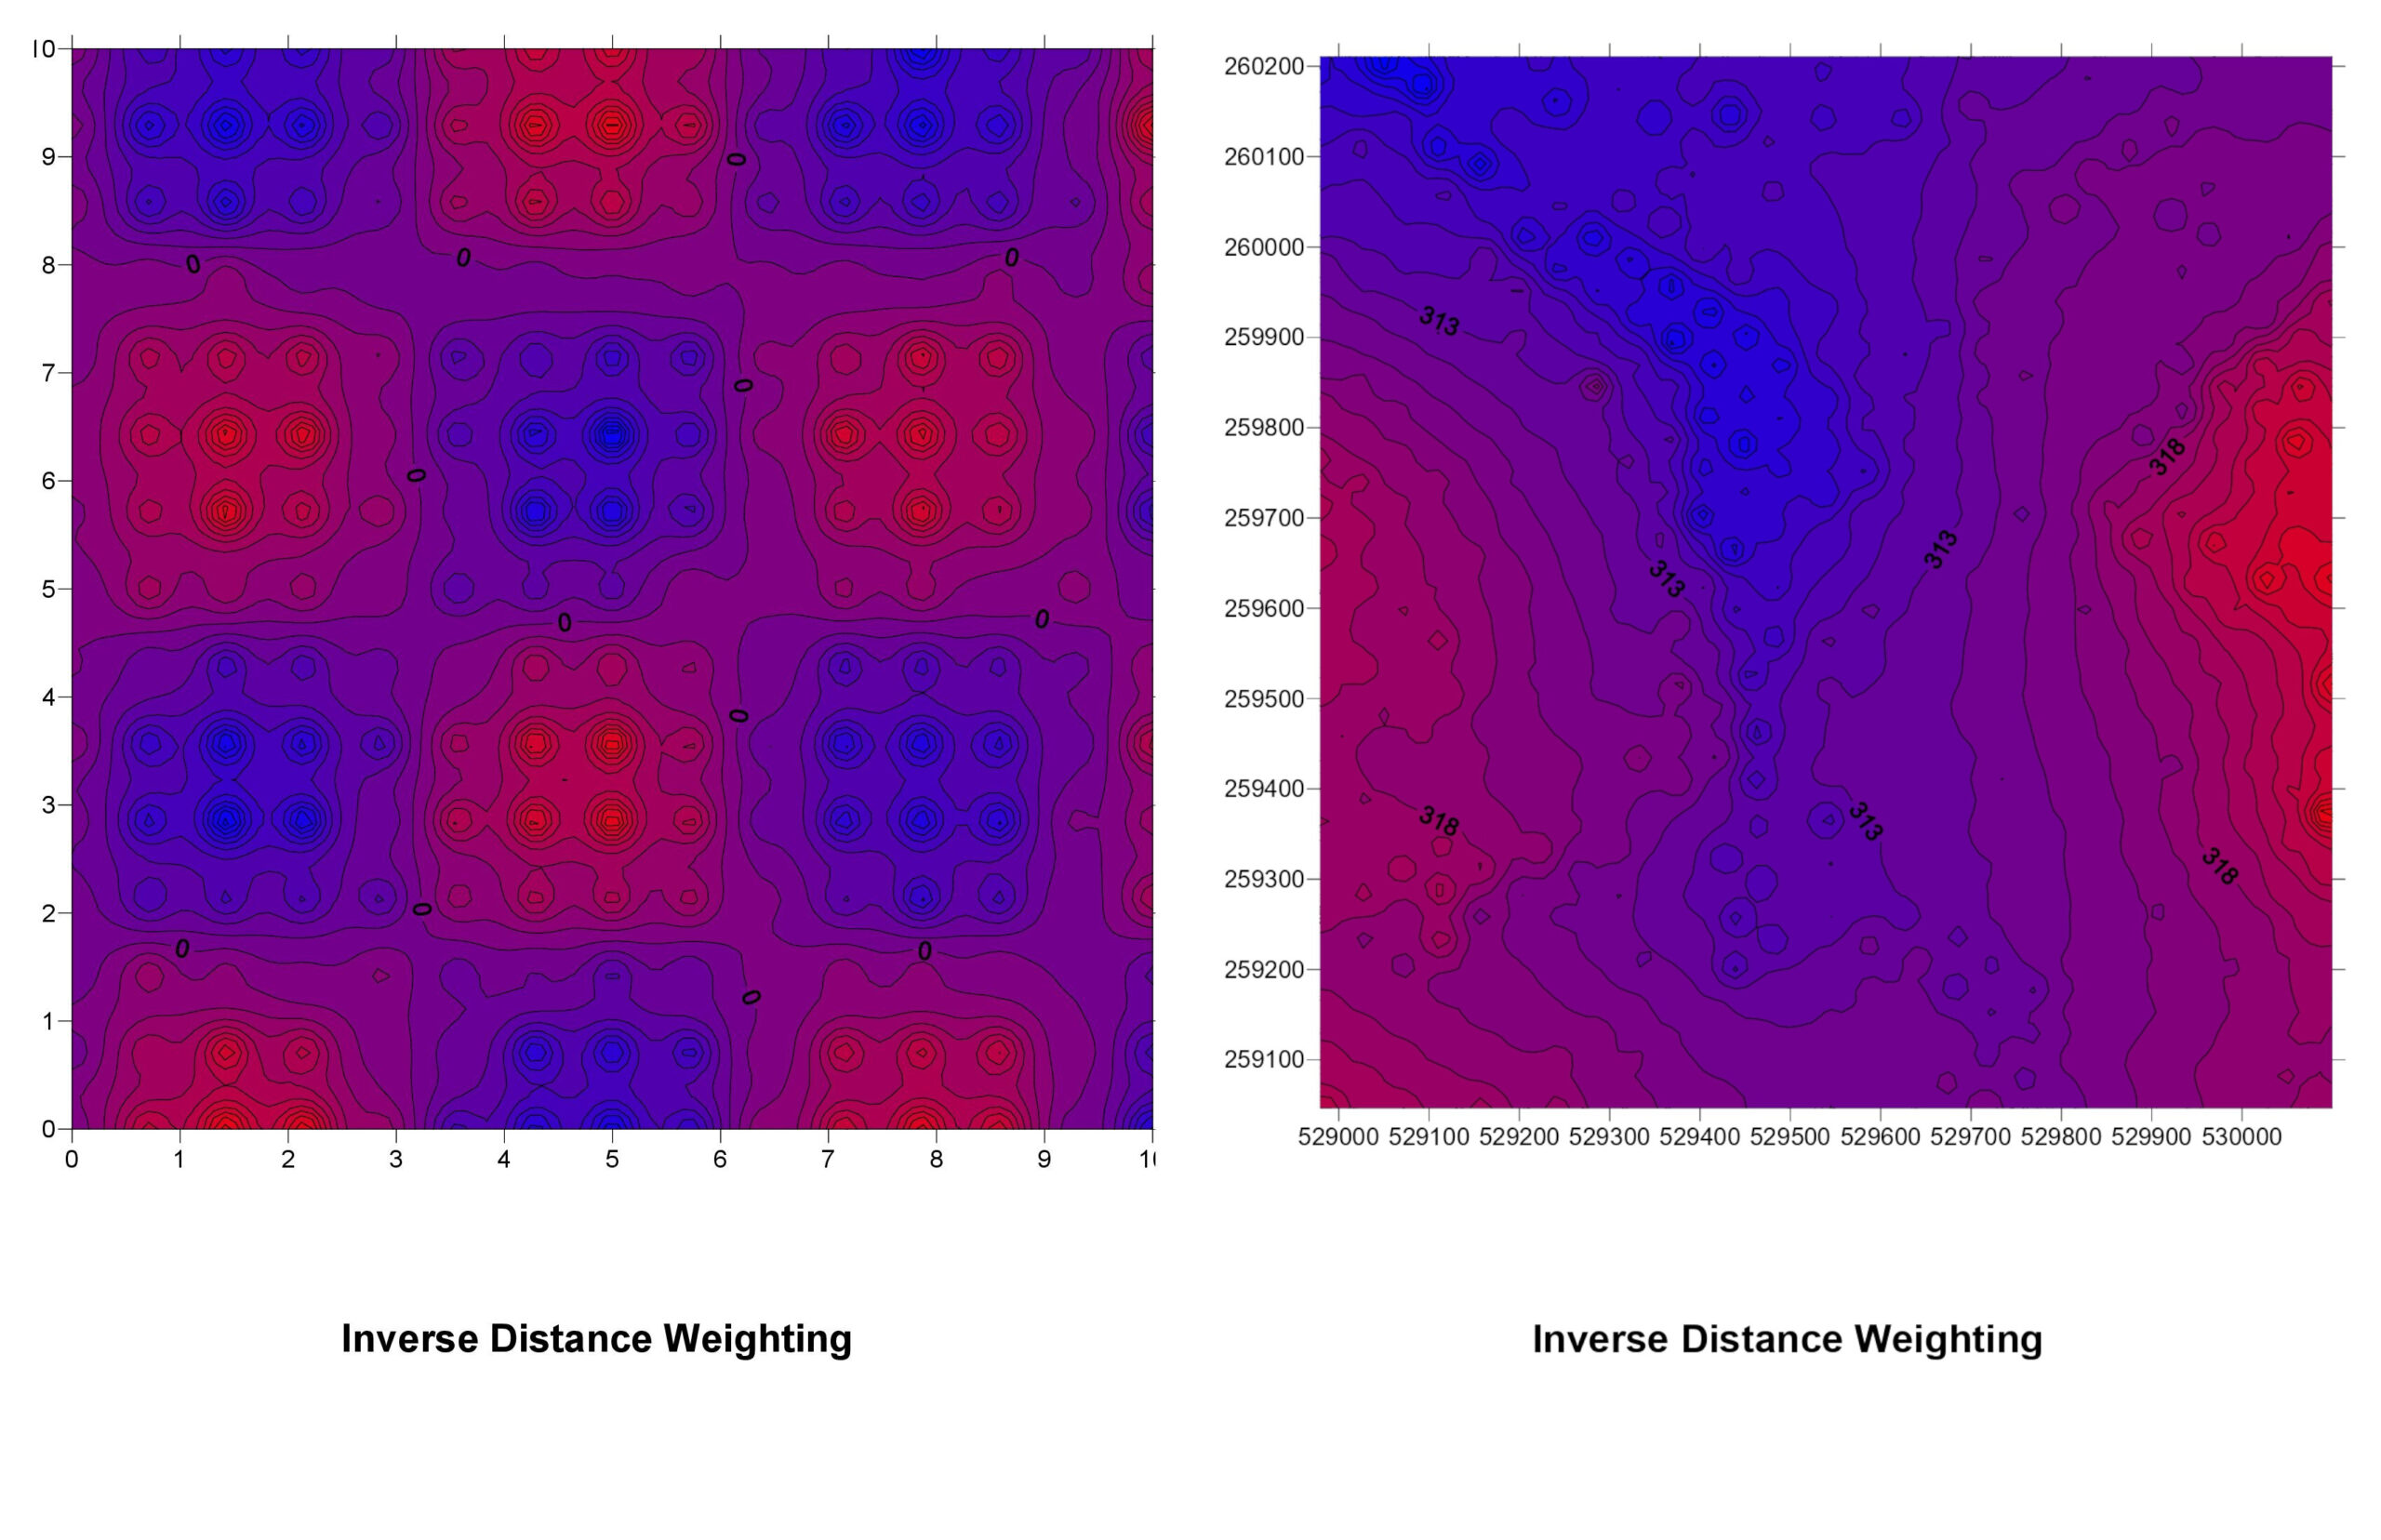
1. Inverse Distance Weighting (IDW)
How It Works: IDW assumes that the influence of a known data point diminishes with distance. In other words, points that are closer to the location being estimated have more influence than those farther away.
IDW Explained: Imagine you’re trying to guess the temperature at a specific spot. With IDW, you look at nearby weather stations and give more weight to those that are closer. If a station is just a mile away, its temperature reading is more relevant than a station 20 miles away.
Pros:
- Easy to understand and implement.
- Good for datasets where the influence of a point decreases uniformly with distance.
Cons:
- Doesn’t account for trends or patterns beyond distance.
- Can produce “bullseye” effects around data points.
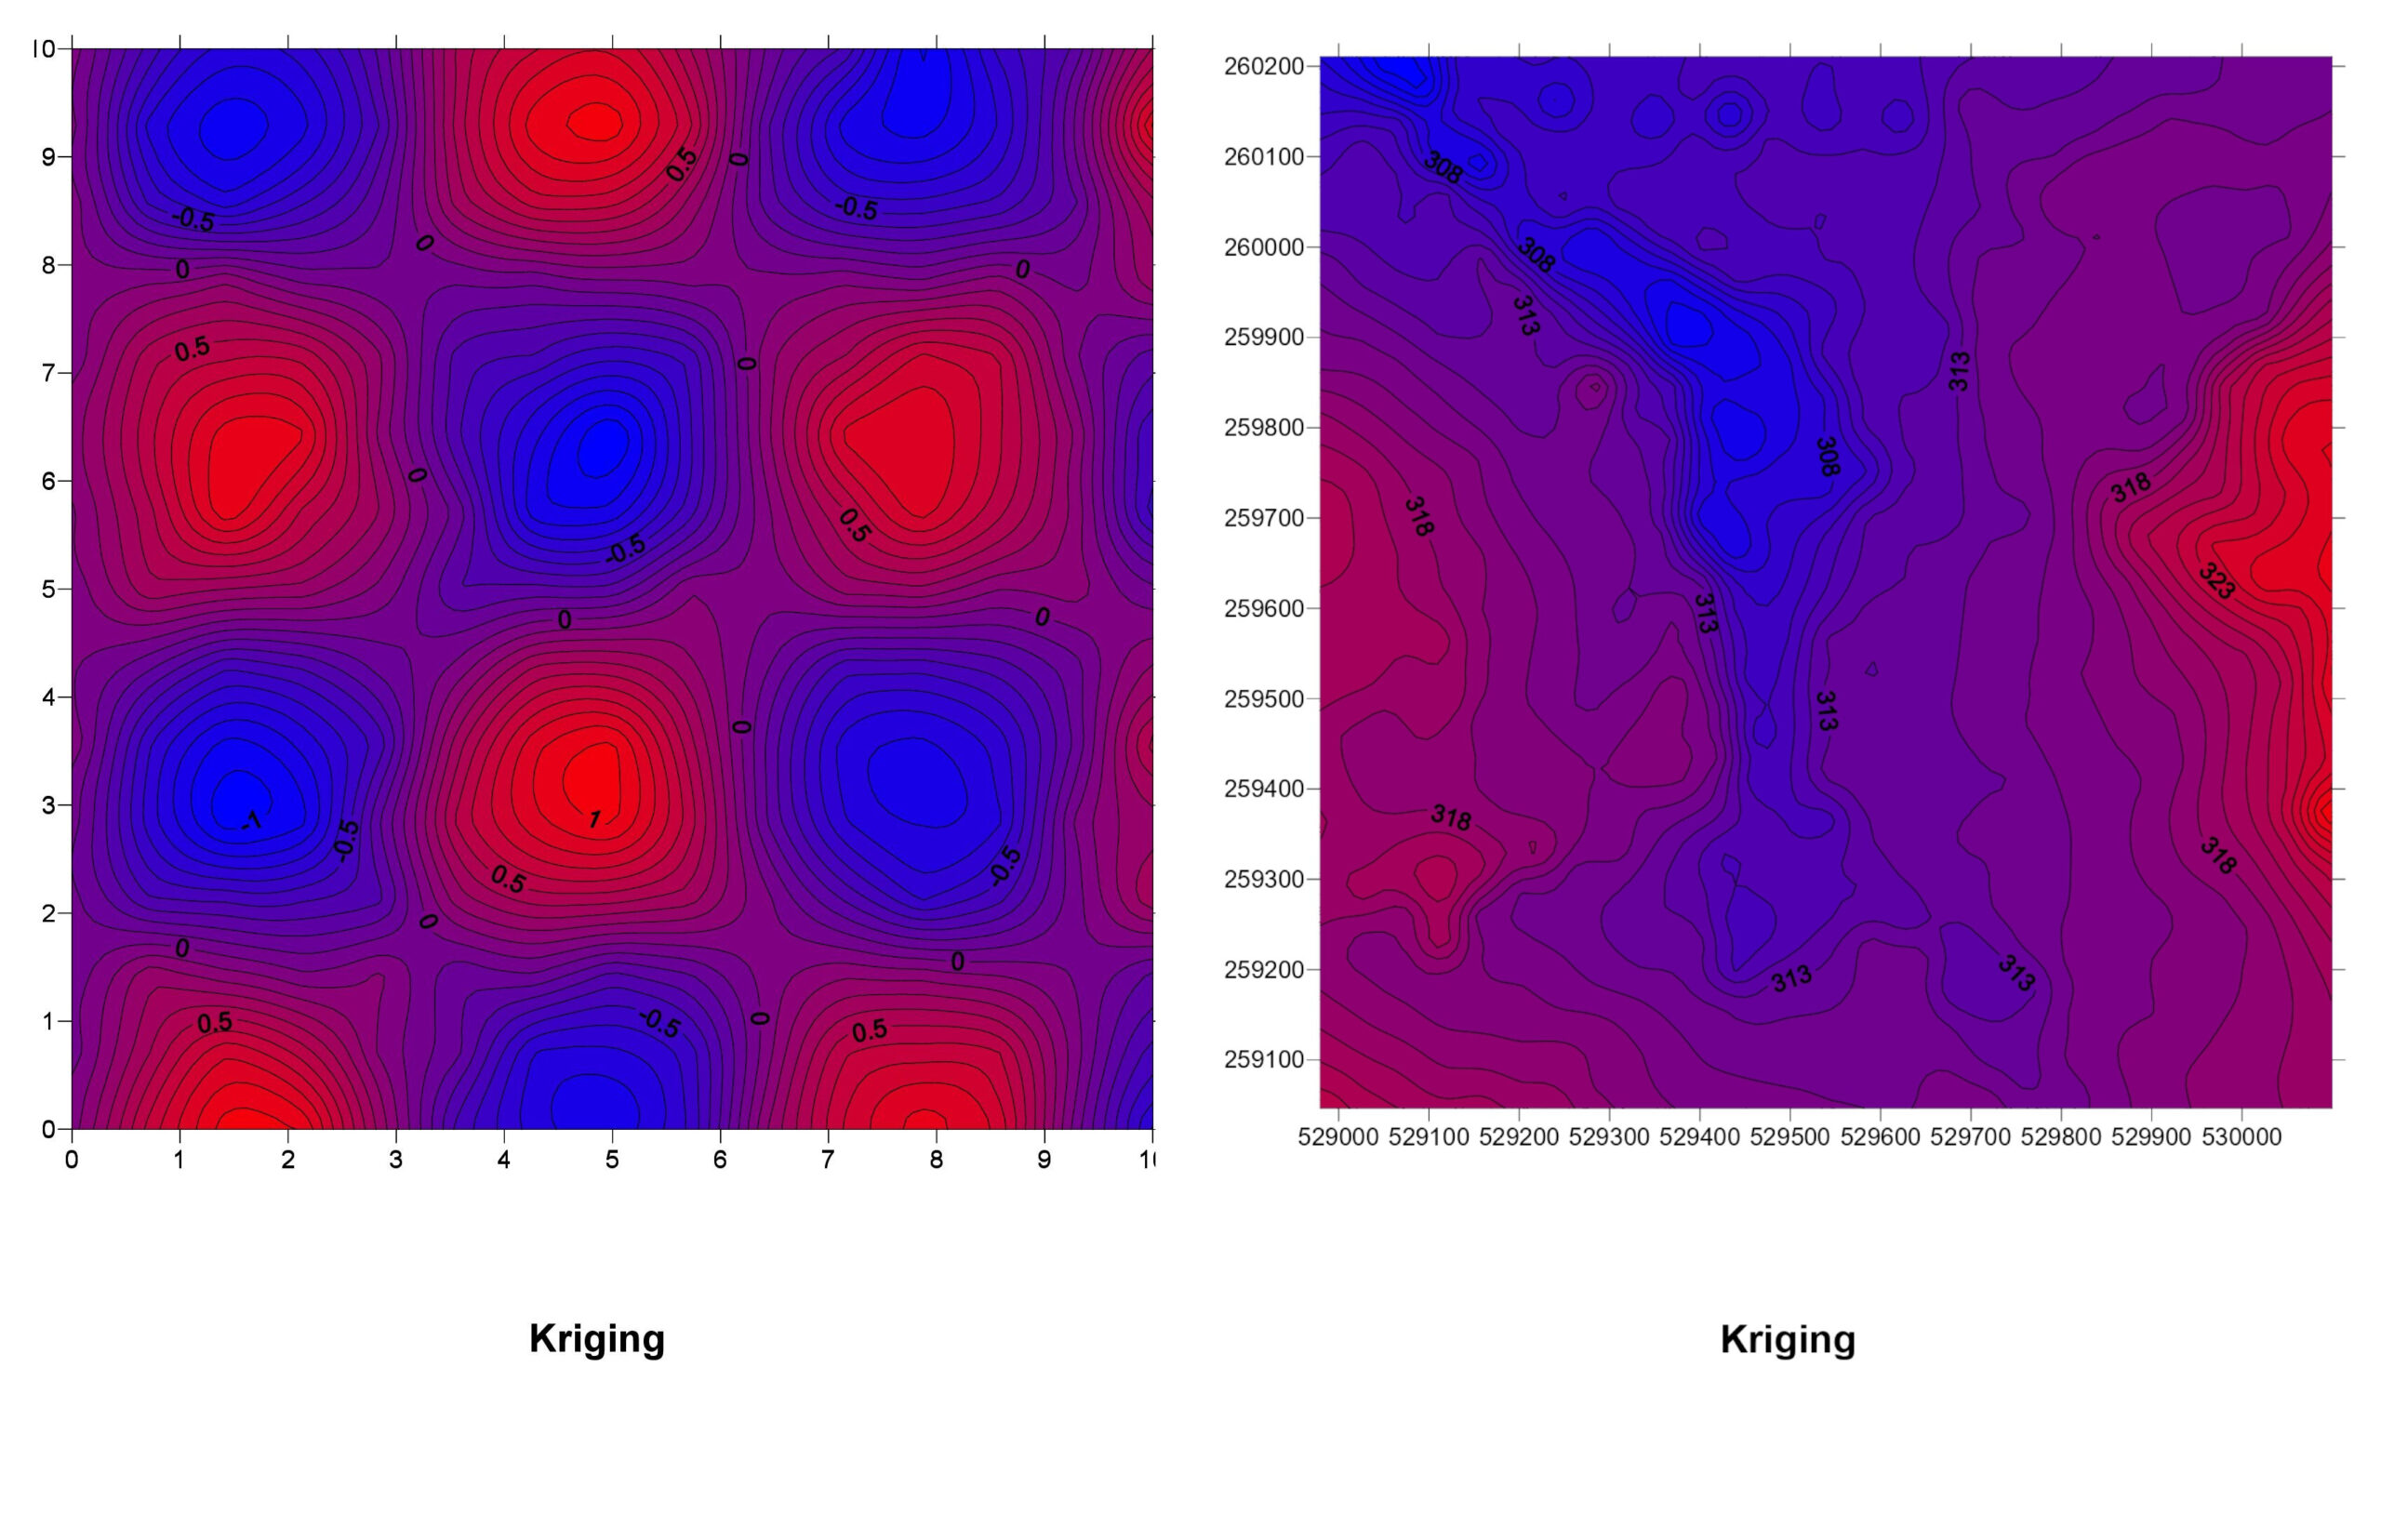
2. Kriging
How It Works: Kriging is a more advanced geostatistical method that not only considers the distance between points but also the overall spatial arrangement and trends in the data. It involves creating a variogram that models spatial correlation.
Kriging Explained: Think of Kriging as IDW’s smarter cousin. It doesn’t just look at how close other points are; it also considers how the values change over space. If there’s a trend (like increasing temperatures as you move south), Kriging takes that into account.
Pros:
- Provides statistically optimal predictions.
- Accounts for spatial trends and patterns.
- Offers measures of estimation uncertainty.
Cons:
- More complex and computationally intensive.
- Requires a good understanding of geostatistics to set up properly.
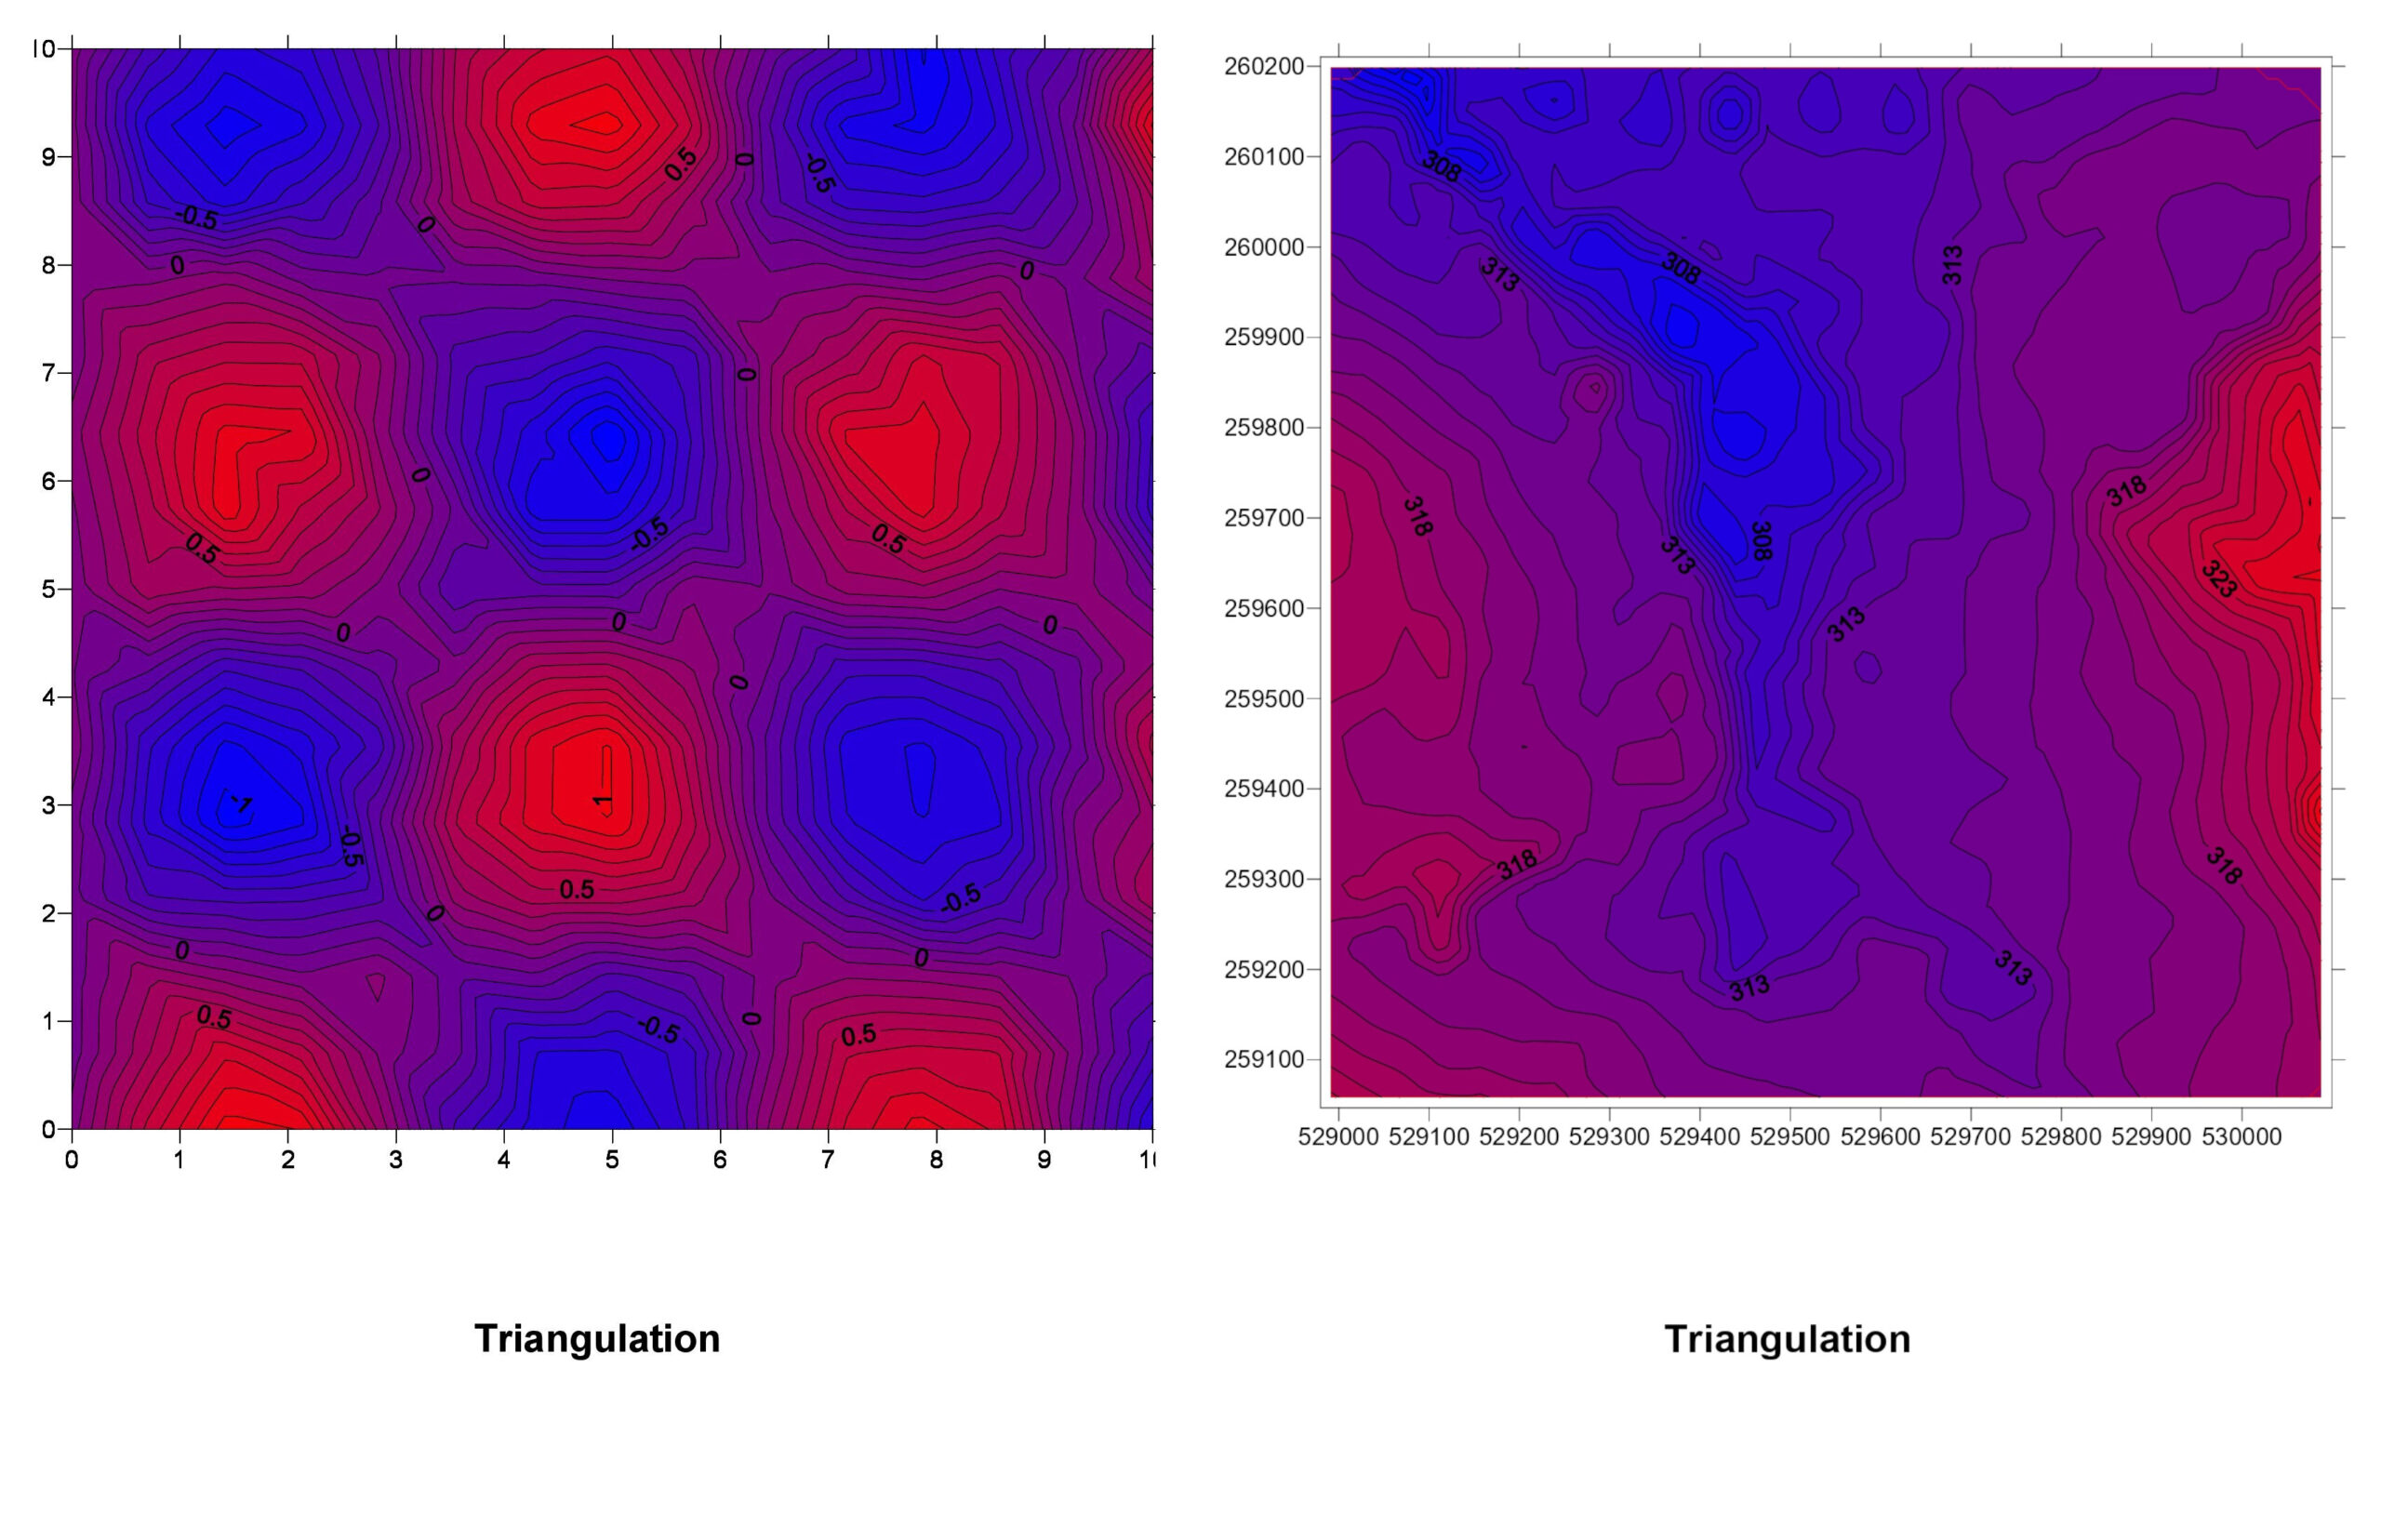
3. Triangulation (TIN – Triangulated Irregular Network)
How It Works: Triangulation divides the area into triangles based on the input points, creating a network. The value within each triangle is estimated based on the vertices.
TIN Explained: Picture connecting all your data points with lines to form a web of triangles. Within each triangle, the surface is estimated based on the three corners. It’s like stretching a sheet over pegs placed at each data point.
Pros:
- Good for modeling surfaces with abrupt changes, like cliffs.
- Preserves the exact values at the data points.
Cons:
- Can produce unrealistic surfaces if data points are unevenly distributed.
- Not ideal for smoothly varying surfaces.
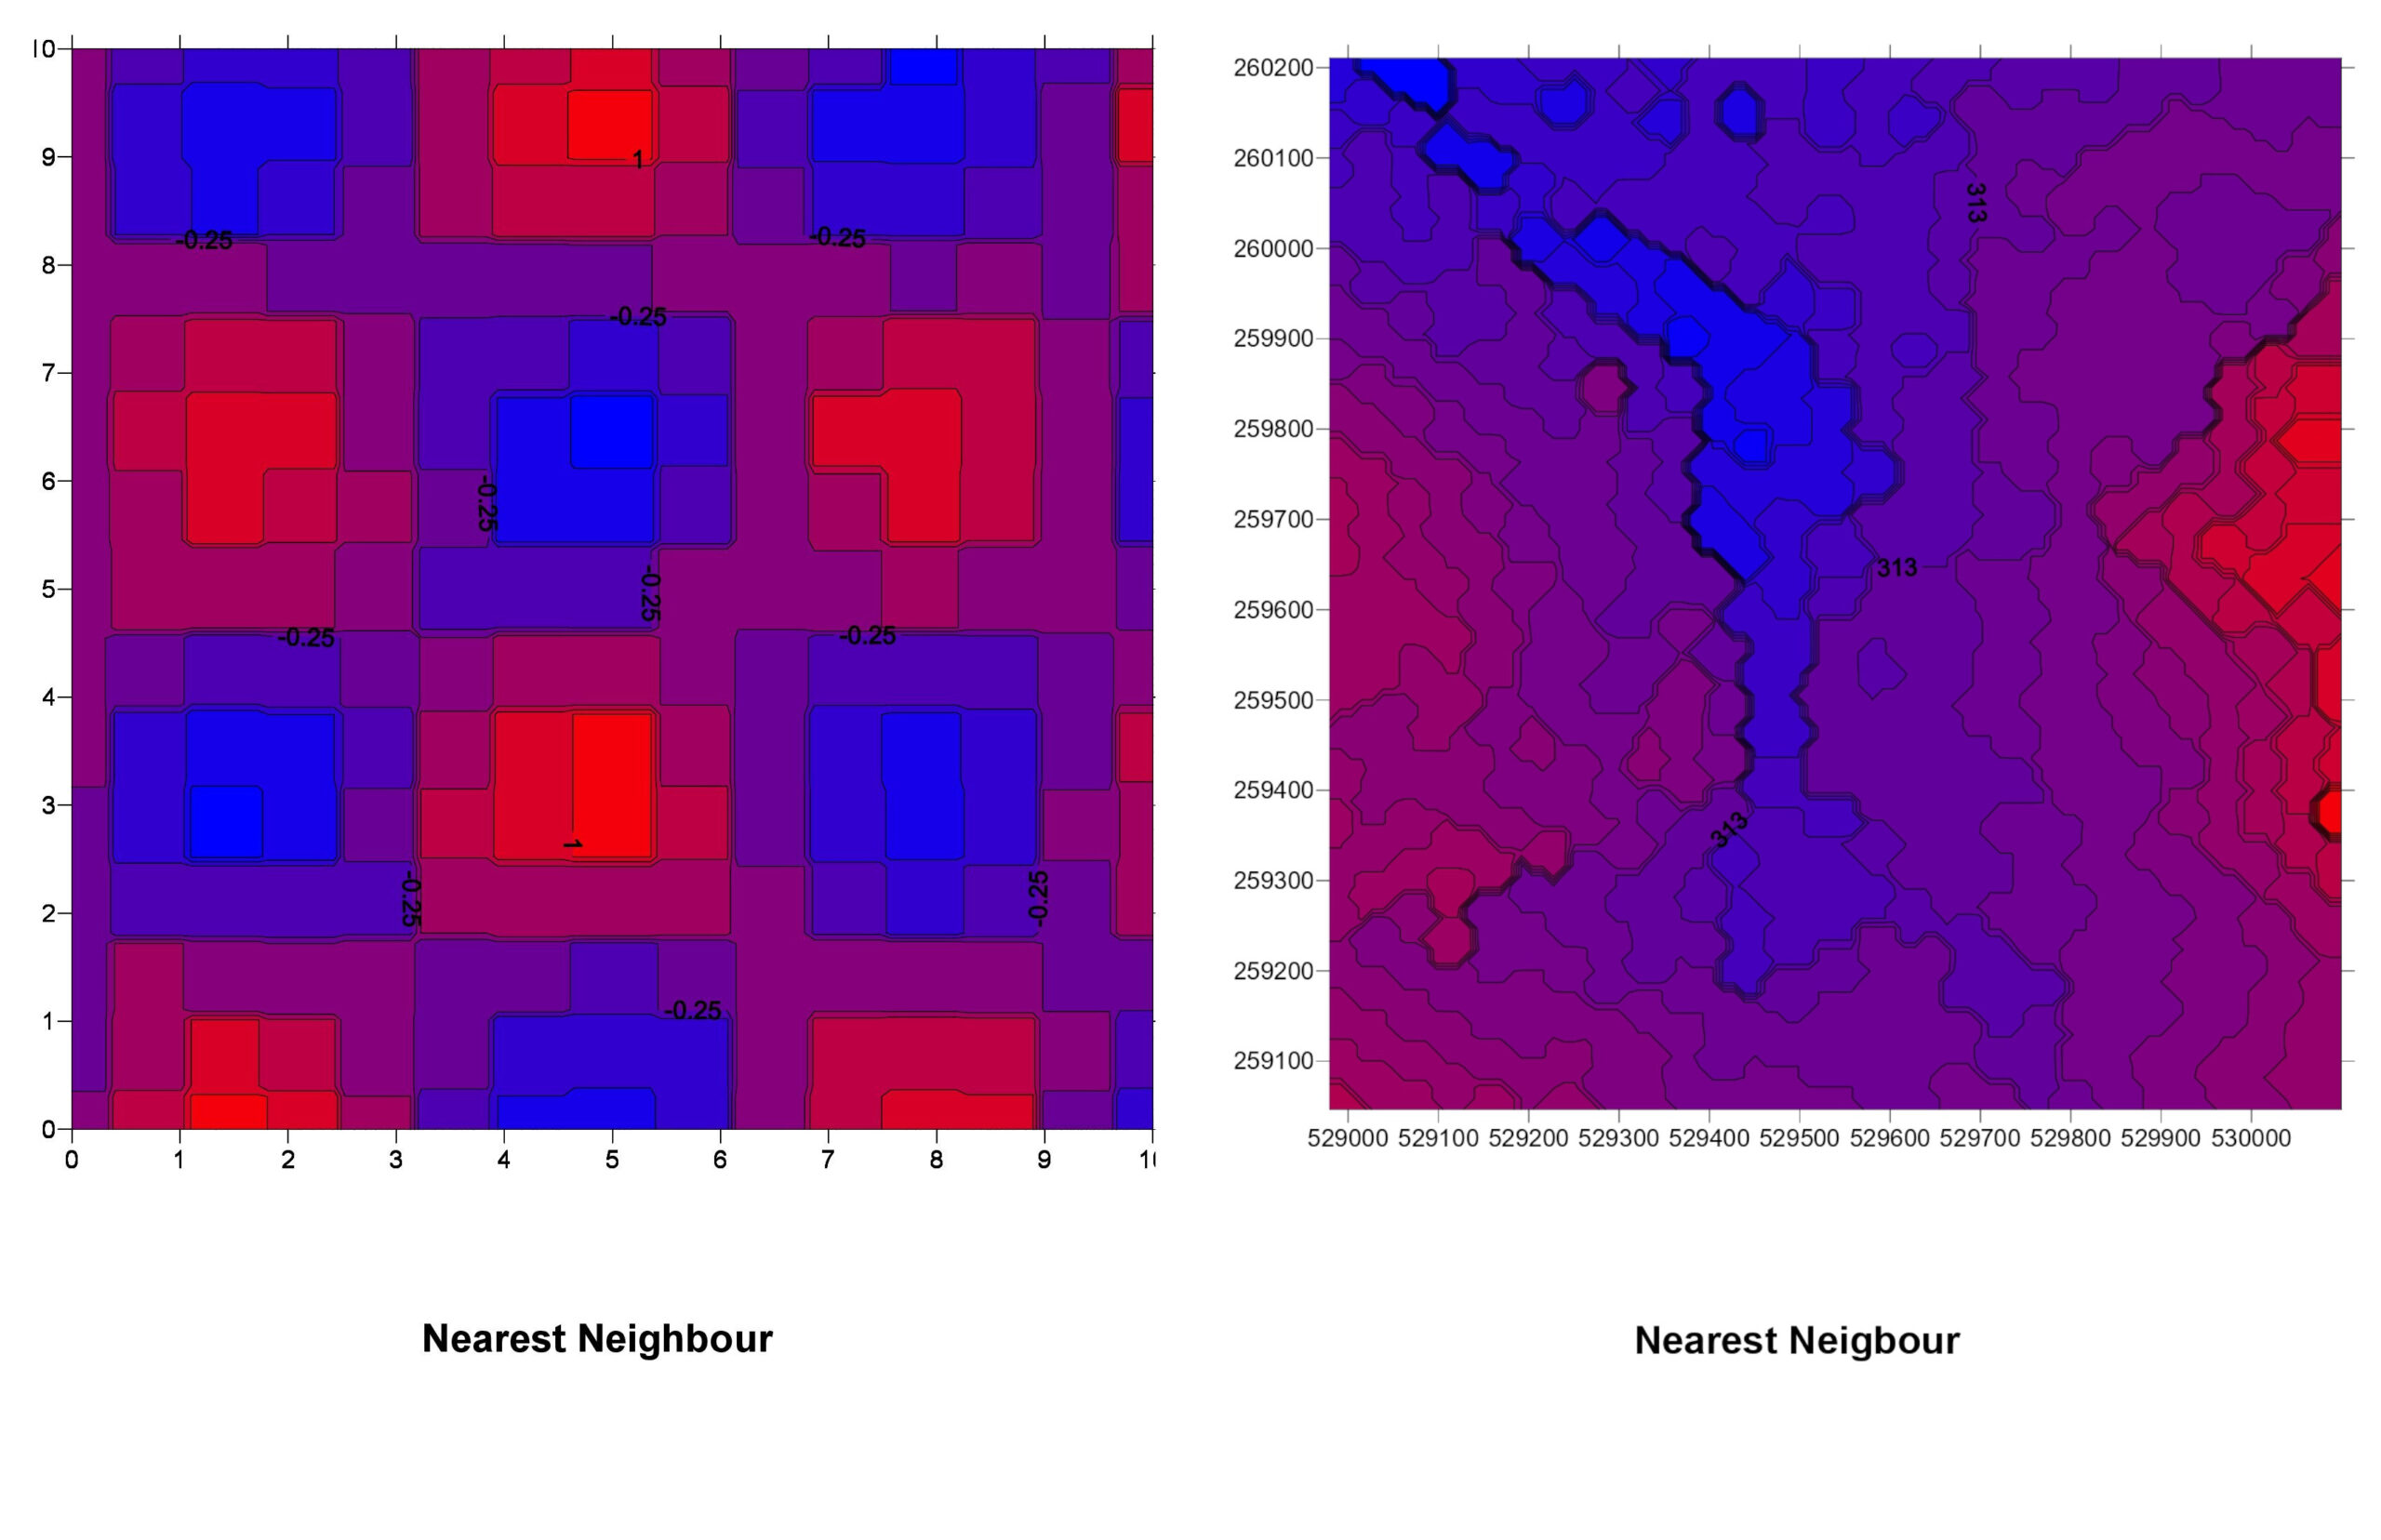
4. Nearest Neighbor
How It Works: This method assigns the value of the nearest known data point to each unknown location. It doesn’t interpolate but rather classifies areas based on proximity.
Nearest Neighbor Explained: For any location where you need an estimate, you find the closest known data point and use its value. It’s like saying, “The nearest weather station says it’s 20°C, so I’ll assume it’s 20°C here too.”
Pros:
- Simple and fast.
- Preserves the original data values.
Cons:
- Creates abrupt changes at the boundaries between areas.
- Not suitable for smoothly varying data.
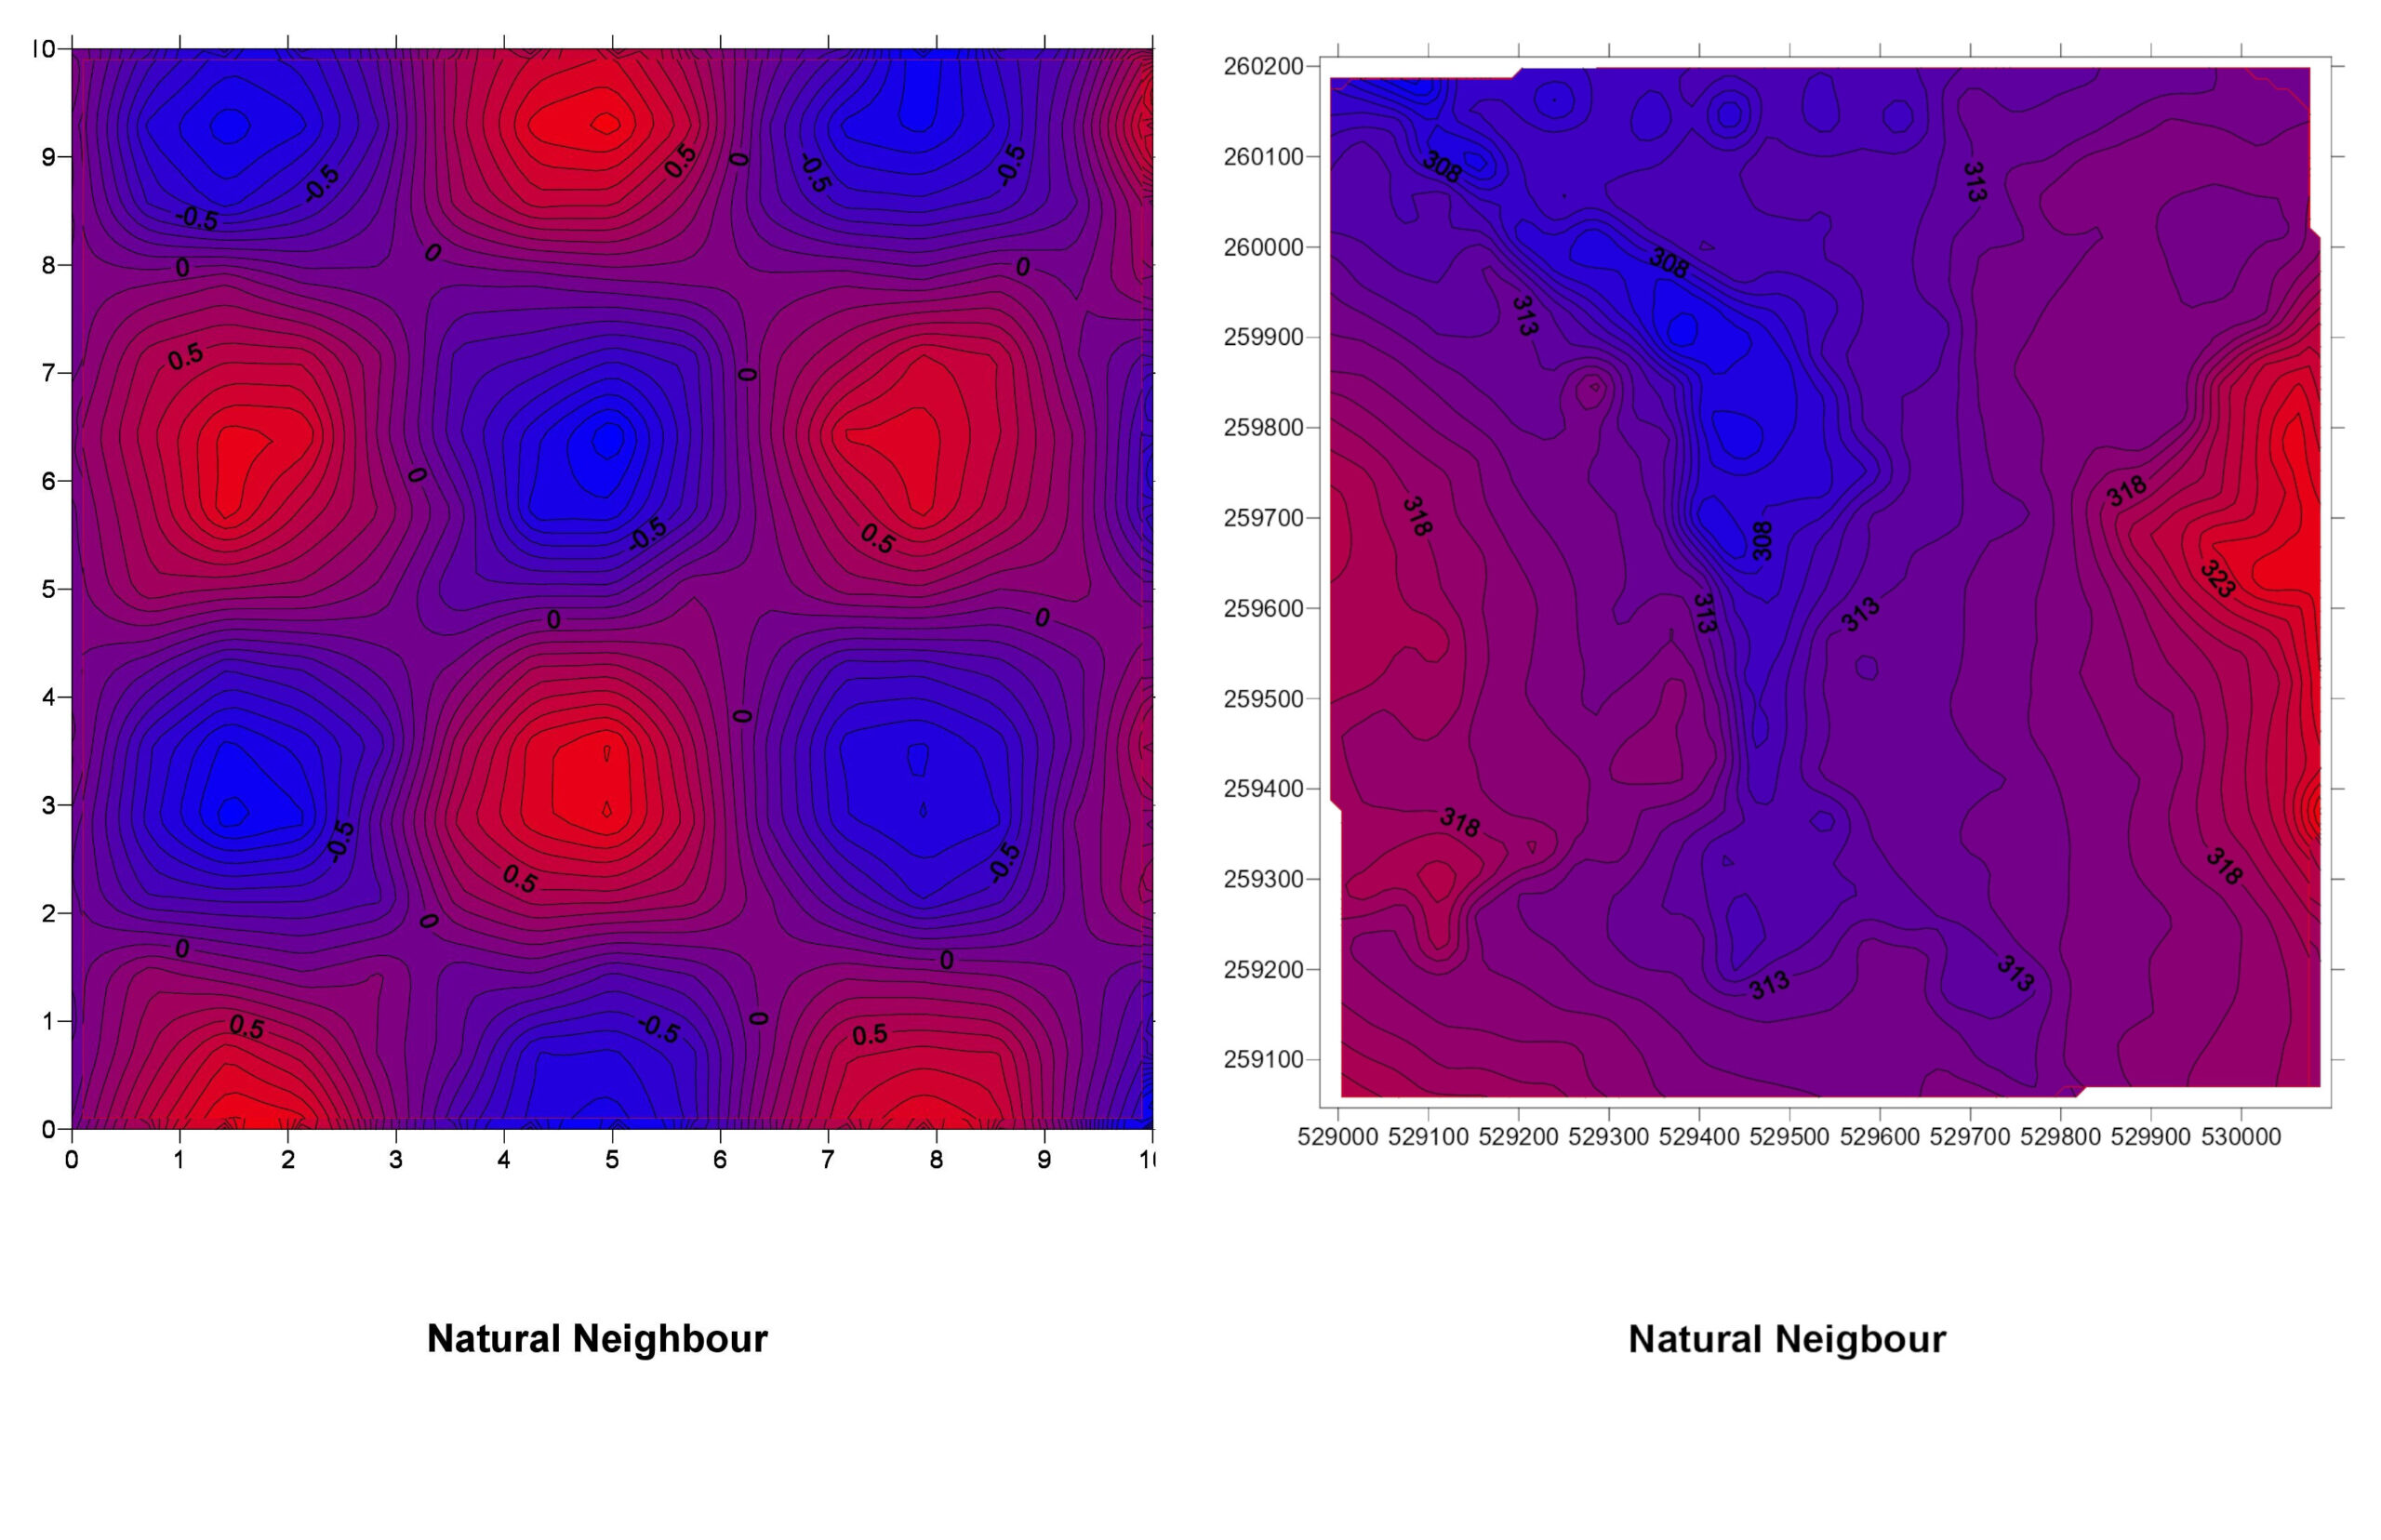
5. Natural Neighbor
How It Works: Natural Neighbor interpolation uses Voronoi tessellation (a way of dividing space) to determine weights based on proximity and area of influence.
Natural Neighbor Explained: Imagine each data point has its own territory. When estimating a value at a new location, you see how much of that location falls into the territories of surrounding points. Those with larger overlaps have more influence.
Pros:
- Produces smooth surfaces without abrupt changes.
- Adapts well to irregularly spaced data.
Cons:
- Computationally more intensive than simpler methods.
- Less intuitive than methods like IDW.
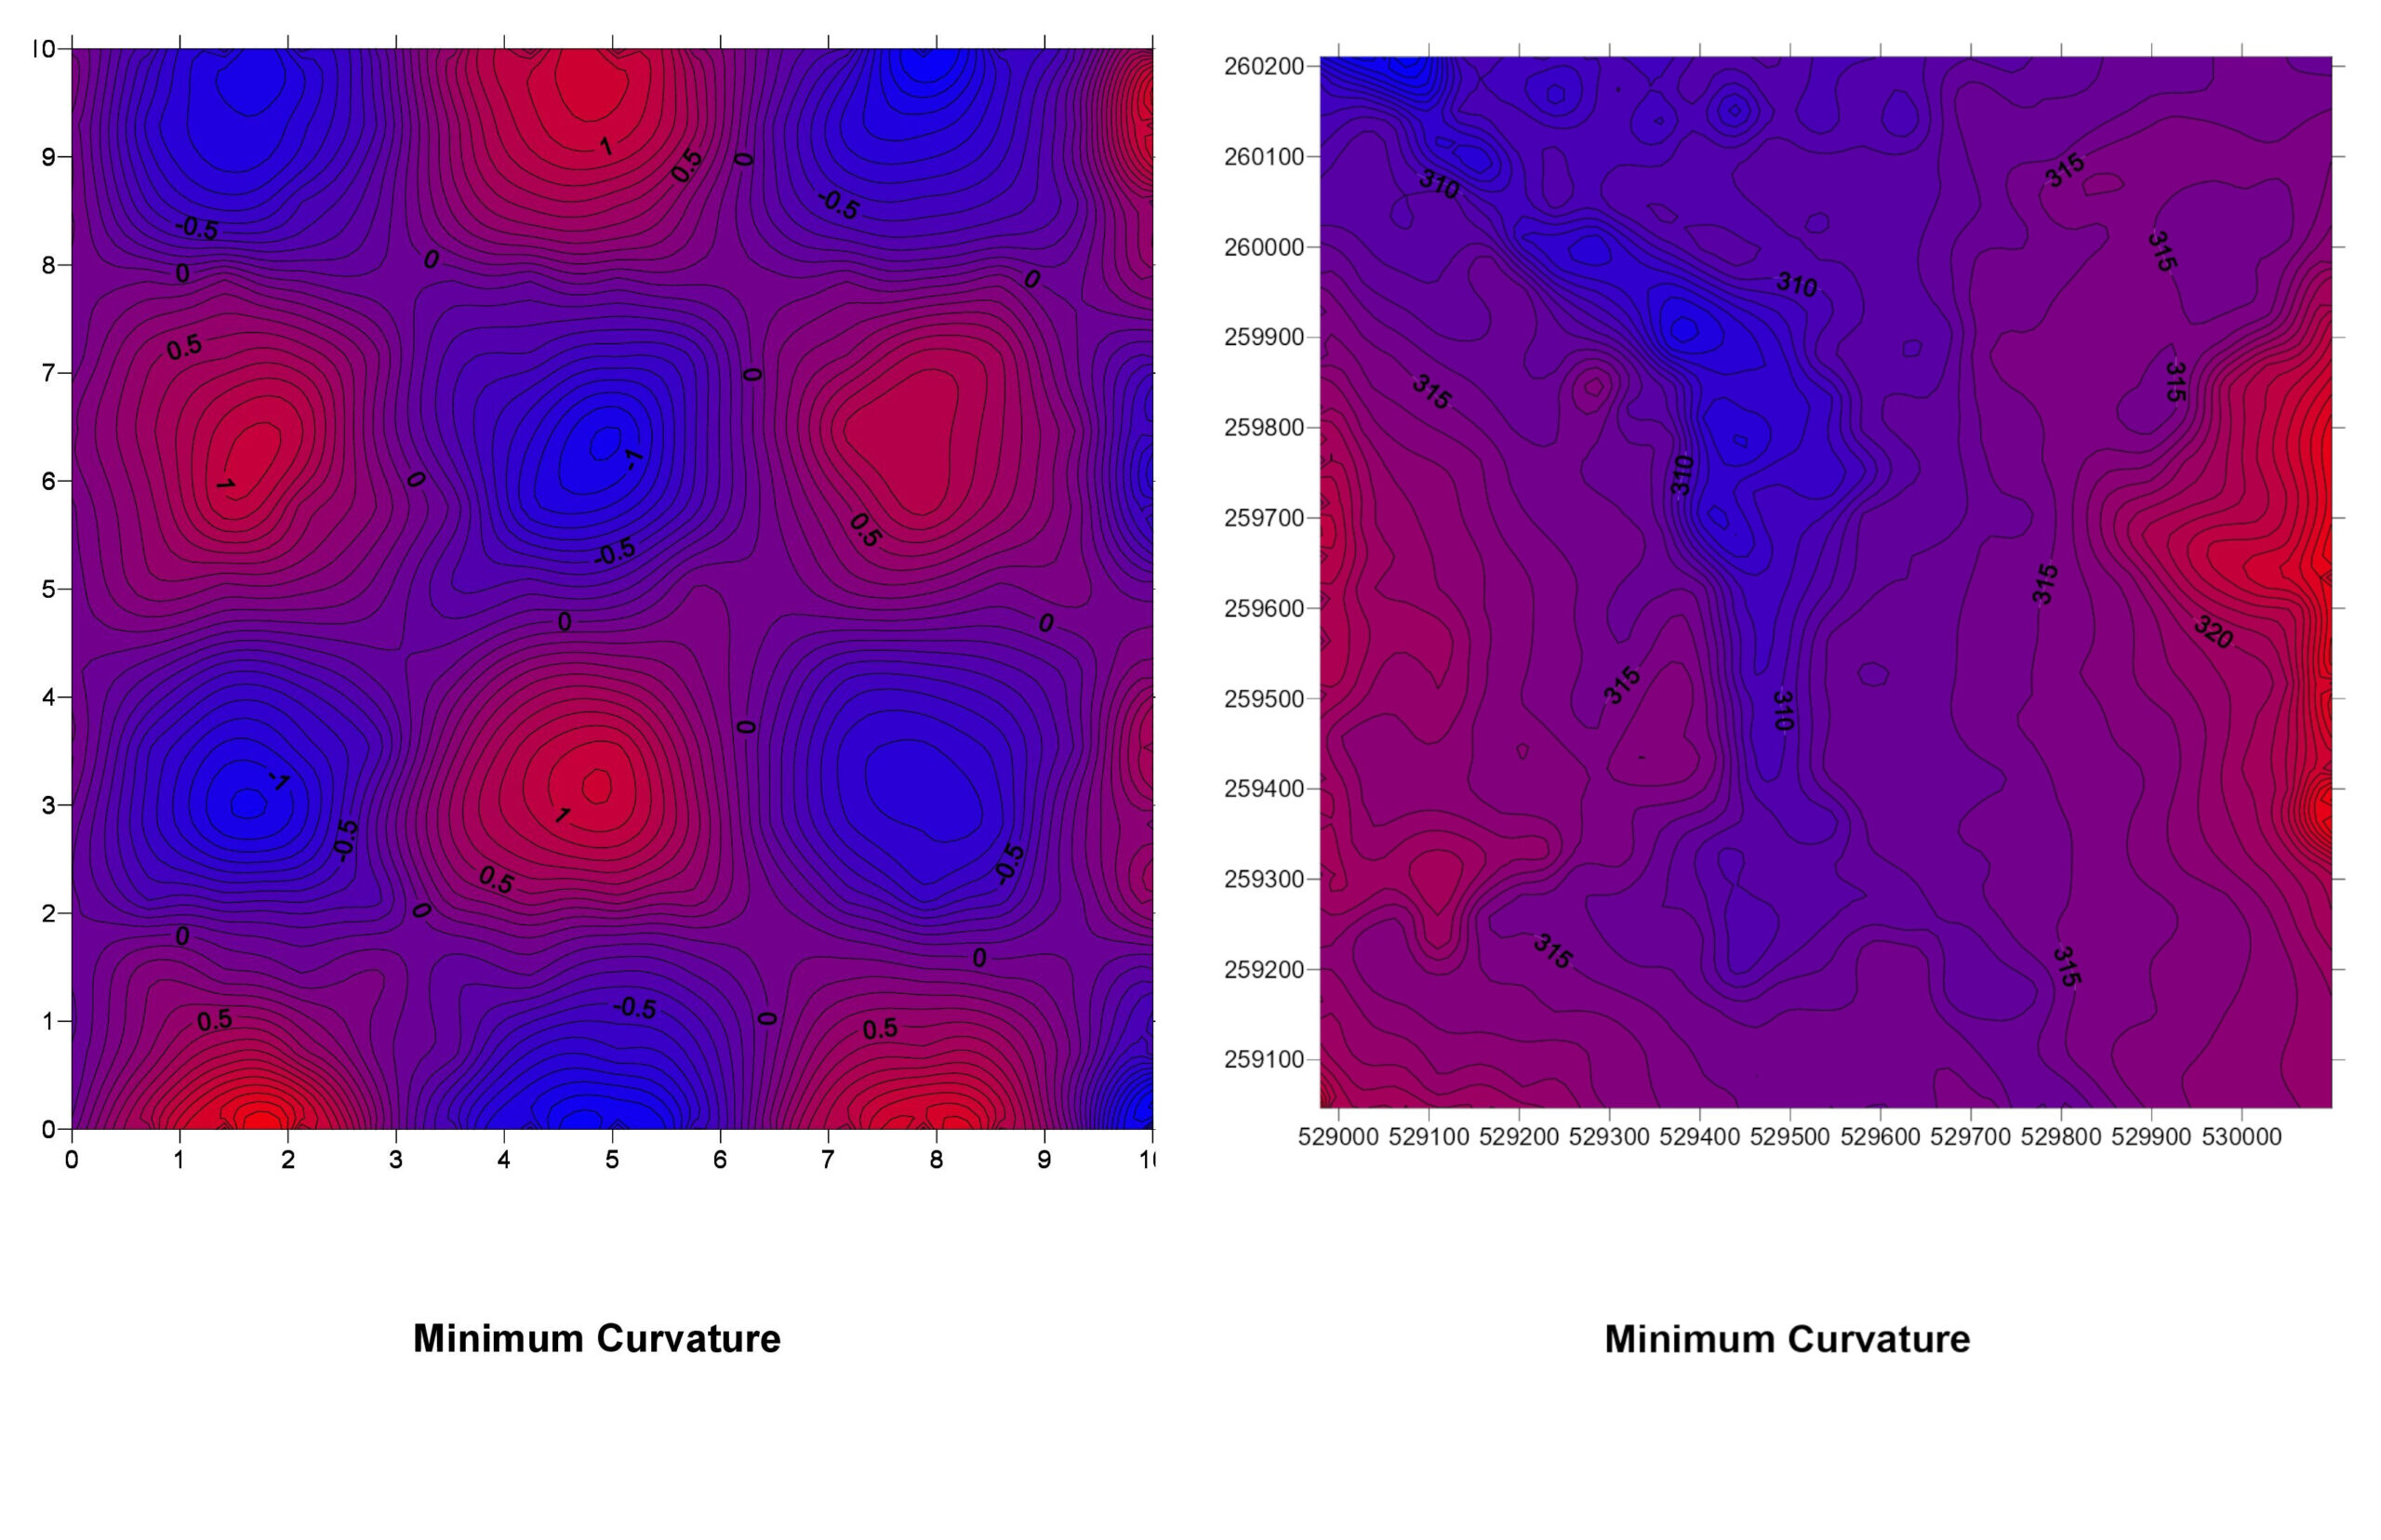
6. Minimum Curvature (Spline)
How It Works: This method fits a smooth surface that minimizes the overall curvature, similar to bending a flexible sheet to pass through the data points.
Minimum Curvature Explained: Think of laying a rubber sheet over your data points, with the sheet touching each point. The sheet bends smoothly between points, creating a surface with minimal twists and turns.
Pros:
- Creates smooth and visually appealing surfaces.
- Good for gently varying data.
Cons:
- Can overshoot or produce unrealistic values (overfitting).
- Not suitable for data with sharp changes.
Choosing the Right Method of Interpolation
Selecting an interpolation method depends on several factors:
- Data Characteristics: Is your data smoothly varying or has abrupt changes?
- Distribution of Data Points: Are the points evenly spread out or clustered?
- Purpose of the Analysis: Do you need a quick estimate or a statistically robust prediction?
- Computational Resources: Some methods require more processing power and time.
Tips:
- Experiment: Try multiple methods and compare the results.
- Cross-Validation: Use a subset of data to validate the accuracy of your interpolation.
- Consult Expertise: For complex datasets, consider consulting a geostatistician.
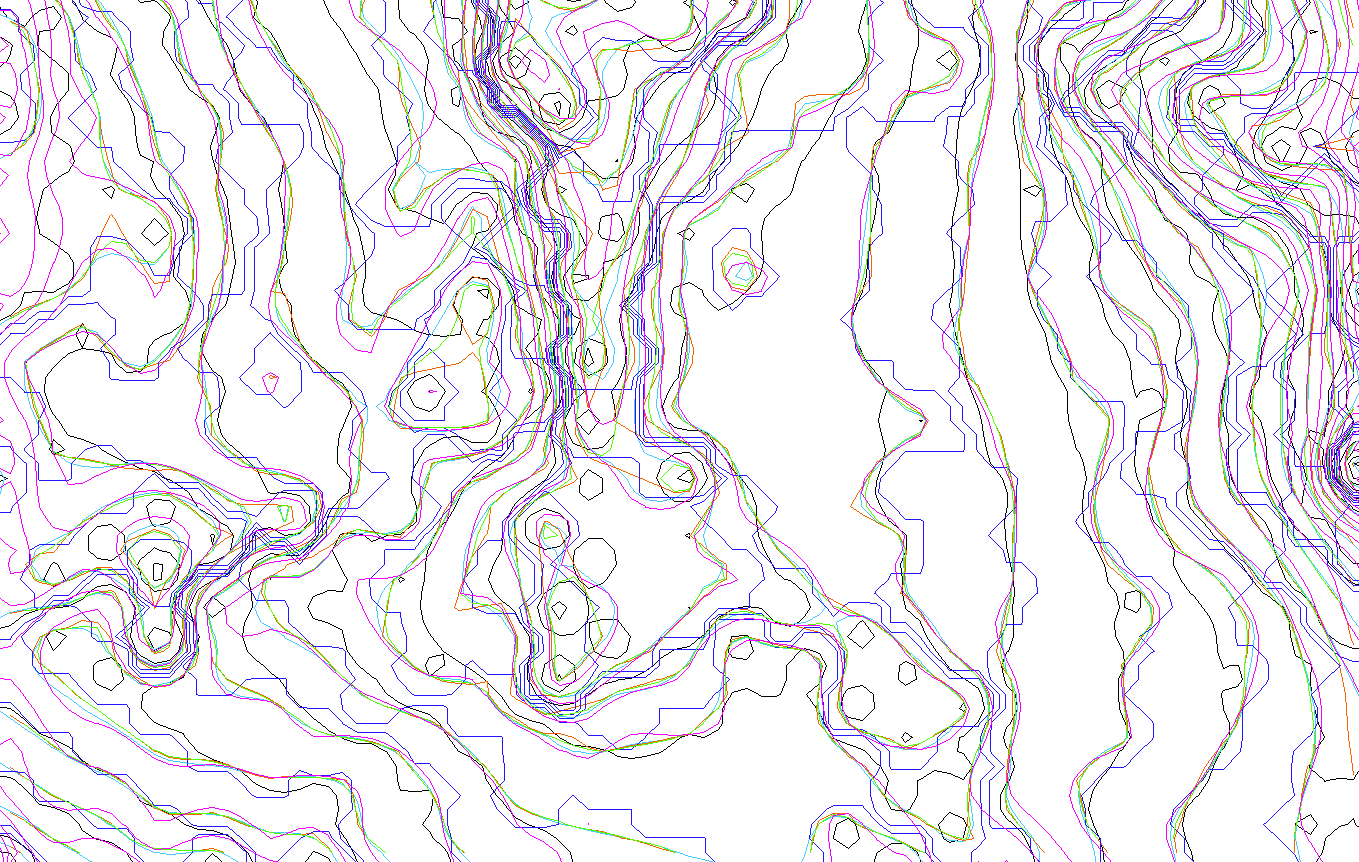
By overlaying the interpolated maps (like in the image below), we can conclude that no interpolation technique produces the same result. This allows for the manipulation of visualizations by GIS analytics.
In a nutshell, interpolation is a technique in GIS that transforms scattered data points into continuous surfaces, unlocking insights and enabling informed decision-making.
By understanding the basics of methods like IDW, Kriging, Triangulation, Nearest Neighbor, Natural Neighbor, and Minimum Curvature, you’re better equipped to handle spatial data challenges. Remember, there’s no one-size-fits-all solution—each method has its place, and the best choice depends on your specific needs and data characteristics.
So the next time you’re faced with a landscape of unknowns, you’ll know how to bridge the gaps, turning dots into a meaningful picture of the world.
Did you like this post? Read more and subscribe to our monthly newsletter!

