

Evolving from the ancient Celtic holiday of Samhain, modern Halloween has become less about literal ghosts and celebrating those who passed away and more about costumes and candy. Below you’ll find the collection of the best maps and infographics that will let you understand Halloween a bit better.
How countries around the world celebrate Halloween

source: Angles Fancy Dress
The acres of harvested pumpkins by state
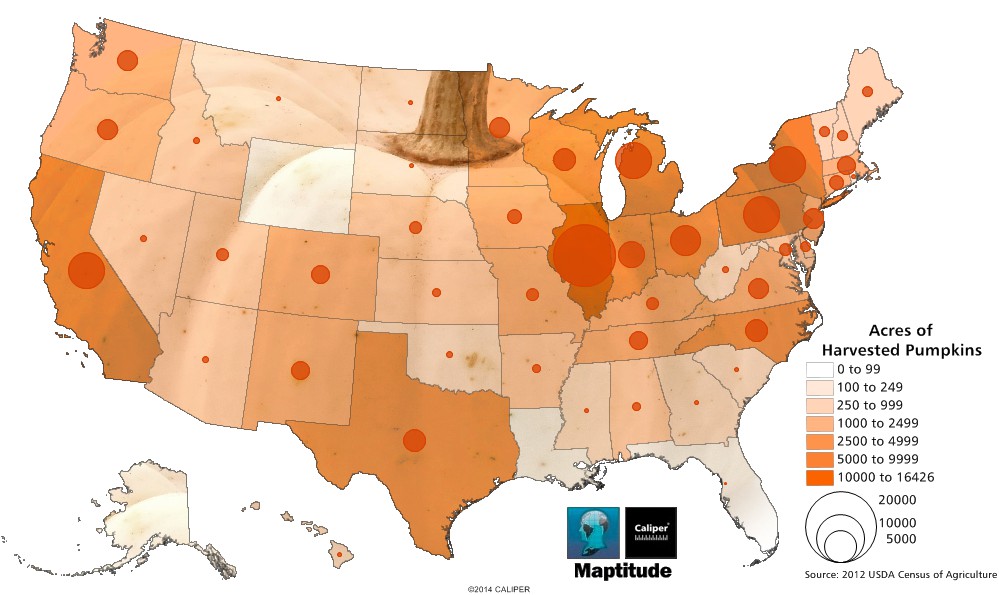
Maptitude Mapping Software Pumpkin Harvest Map
source: Caliper
Countries with candy import peak in October
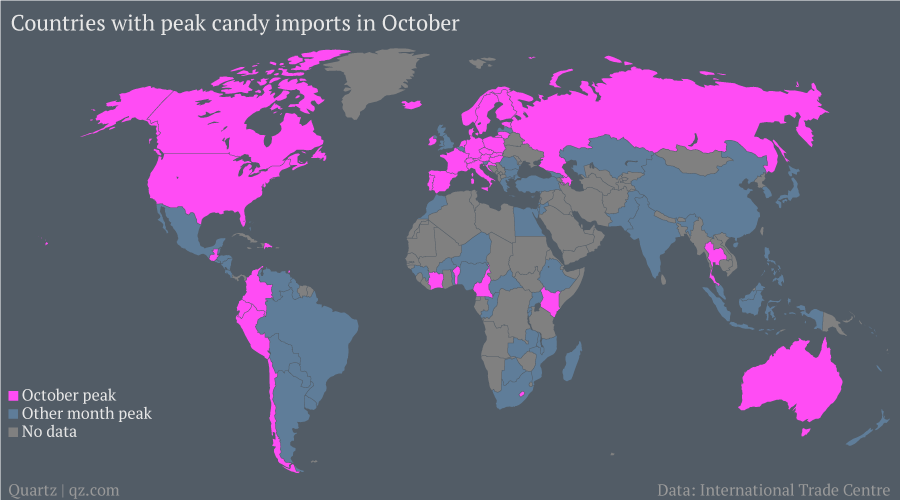
source: qz
The most popular candies per states

source: Cosmopolitan
The Most Googled Halloween Costumes

source: Huffington Post
Halloween spendings across the US

source: Halloween Spending Across America
The Best Cities for Trick-or-Treating
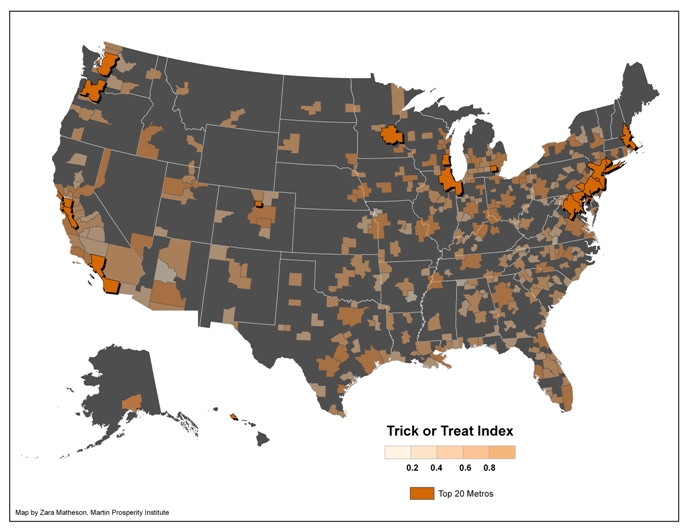
source: The Atlantic
Where horror films took place

source: Horror Freak News
[td_smart_list_end]


#Featured


Next article

For something as beautiful, beneficial and gargantuan as mountains, it is surprising how understudied these globally distributed environments are. There are only a handful of global mountains raster GIS data layers available to us, one of which was developed as recently as this year. And even then, there is no easy mechanism through which scientists, policymakers – and for that matter, even hikers – could browse, explore or visually compare the information known to us.
A collaboration between the US Geological Survey (USGS), Esri, the Center for Development and Environment of the University of Bern, the Global Mountain Biodiversity Assessment, and the Mountain Research Initiative is changing that. As a part of a Group on Earth Observations (GEO) initiative called GEO-GNOME, USGS has come out with a new Web-based browsing tool that allows for visualization and query of well-known global mountains raster GIS data layers produced by Kapos, Körner, and Karagulle et al.
Called the Global Mountain Explorer (GME), this new tool allows for visualization and query of these characterizations either separately or in pairwise comparisons. In simple words, GME gives users the most detailed view yet of the world’s mountains – at a resolution 16 times more detailed than previous mapping efforts.
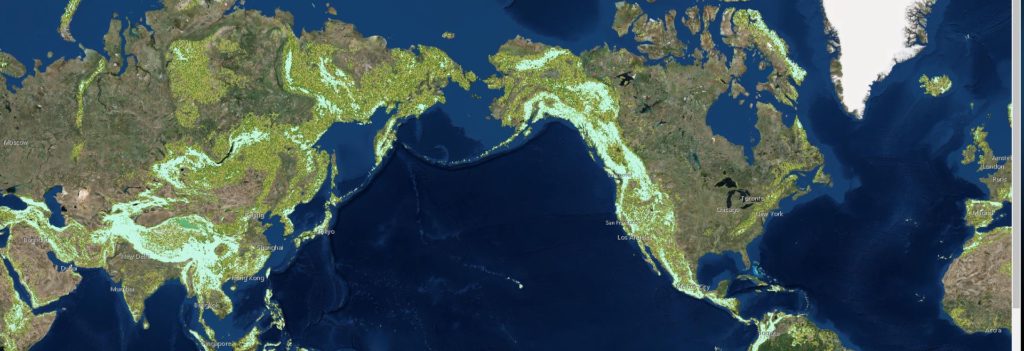
An example display from the Global Mountain Explorer tool showing a map of mountains on top of a satellite image background
According to USGS ecosystems geographer Roger Sayre, who was leading this project, “GME allows anyone with access to the Internet to explore where mountains are, whether they are low or high, scattered or continuous, snowy or snow-free. Mountain Explorer users can visualize and compare in one place and for the first time the three major global mountain maps that have been produced.”
USGS explains that users can select an area by zooming in or by typing a place name like Mt. Everest to view its elevation and type. A number of backdrops are also available –satellite images, topographic maps or political boundary maps – for users to choose how they want the different types of mountain classes to be displayed. You can check out the full features of GME in this helpful video tutorial below:

