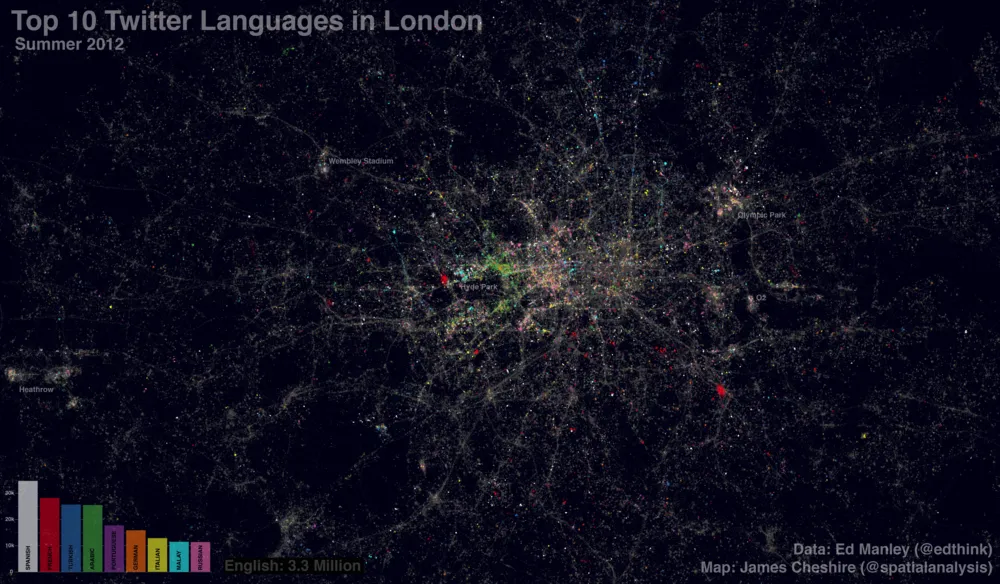

While studying language diversity in London, a heat map of languages used during last summer, reveals the top 10 languages used in London’s Twitter sphere. This map was prepared by, Ed Manley and James Cheshire from University College of London. They have used around 3.3 million geolocated tweets, captured in London over the course of this summer. In total, 66 languages were detected. Interesting things to see is the tweets confirmed that certain groups seem to be more dominant in some areas than in others. They have used Chromium Compact Language Detector – a open-source Python library adapted from the Google Chrome algorithm to detect a website’s language.

The map was compiled by Ed Manley and James Cheshire


#Ideas


Next article
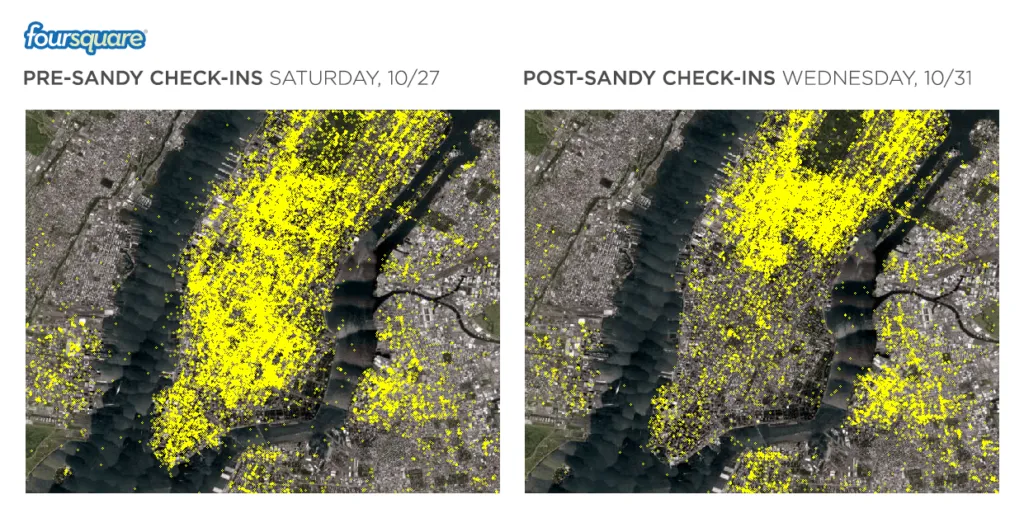

Nice visualization made by Foursquare of the before and after of the Sandy. It shows how check-in patterns change during an event of Hurricane Sandy’s magnitude. It all begins with the Saturday before the storm and ending early morning – the 5th of November. Besides the general ebb and flow of activity between day and night throughout the week, you’ll see the number of check-ins drastically decrease below 34th Street from Tuesday to Friday, when almost all of lower Manhattan was without power.
And image comparison:

source: 4SQ Blog

