

We, as humans, have always been drawn to the night sky. Those bright, white dots in the pitch black blanket that spreads over our heads during the night have always captivated even the most uninterested of eyes. Stars have always been an interesting topic, whether it’s scientific or magical, exact or ambiguous, they’ve been there, rolling on our tongues.
Stars charts and astronomy is also an important part of the heritage of cartography and navigation. Since ancient times, people have observed the night sky to predict the future, navigate and understand their place in the universe. So-called Celestial cartography goes back to 2nd-century Greek mathematician Claudius Ptolemy and his astronomical manual Almagest, which served as the primary guide for European and Islamic astronomers until the beginning of the 17th century. Many cultures organized the stars into heavenly patterns called constellations that were reflecting stories and believes. In ancient Greece, these constellations were viewed as symbolic representations of classical Greek heroes and figures. These images formed the origin of the cosmological and celestial charts in beautiful star atlases of the 17th and 18th Centuries.

Curtesy @thepastelsuitcase
In the most recent era, start charts and constellations have nearly disappeared from the books and atlases as astronomy has been led by scientific discoveries rather than aesthetics and sentiment. Maybe this is why the Under Lucky Stars project caught my attention. The idea is to make printed personal star charts of the constellations in the sky at any past or future moment chosen by users. It is simple yet brilliant. I have immediately ordered one for my map collection, however, I can imagine that it is a perfect gift for and from any Geo Geek.
To generate your own star maps, you go to the Under Lucky Starts website and select a location and time. The engine calculates the azimuth and maps the position of the stars for any given moment in time. You then choose one of the 16 different designs, three sizes and six frame options. You can also type in a personalized title above the picture (although I decided not to keep it more personal).

Curtesy @inmyattic_
I have received my Star Map in a few days, and I love the design and quality. It shows the projection of the visible sky with the cardinal directions (North, South, East, West) indicated. The stars close to the edge of the circle were closer to the horizon in my chosen moment, while stars close to the circle’s centre were visible right above my head. The size of each dot indicates the apparent magnitude of the star. The map also adds some of the visible constellations like Cassiopeia, Orion or Leo.
I’ve ordered the map of curiosity, and I was pleasantly surprised by the aesthetics and experience it provides. Also, the print and frame quality gives you a premium feel. All my friends and family can expect to get one for any upcoming occasion 😉.


#Ideas

Next article


Illustration 1 – Programming Job Trends for GIS: Feb – May 2021
What skills do I need and for what roles?
GIS is a career field with a wide range of roles and applications. Entry-level GIS technician roles can involve plotting points on a map while advanced-level GIS developer roles can involve configuring the database structure for an organization completely from scratch. And what about GIS Analyst and GIS Specialist roles? What exactly do they entail? If you are new to the career field, or perhaps in the middle of it, what is needed to move forward? What skill sets are required and at what stage in your career do you need them? In an effort to answer this question for myself as I seek to take the next step in my geospatial journey from GIS Technician to GIS Analyst, I was inspired to write this program – which included teaching myself Python!
A Straight-Forward Approach
How does someone determine that information? One straight-forward approach is to pick a job site, search for the job title, read the job descriptions, and keep a count of the number of times a certain word appears. Rinse and repeat for all the words you are interested in. This would give you the information that you need, but it does come with a number of difficulties:
- Time commitment. Searching one job takes a few minutes. Searching a dozen jobs or more can take several hours.
- Human limitations. How many words can reasonably be kept track of during one scan? My guess would be in the 1-5 word range.
- Repetitive nature of the task. How long can someone really focus and be detailed-oriented when repeating the same mind-numbing exercise over and over?
An Automated Approach
What if there was a way to accomplish this task and address all of those difficulties at one time? Turns out, there is! One solution lies in using a combination of Python and R scripts to data mine job descriptions, keep a tally of key words, and visualize the results so that they can be easily interpreted. The process as presented in this article identified keywords from the first 25 search results using LinkedIn’s job search engine. The entire process follows this work flow model:
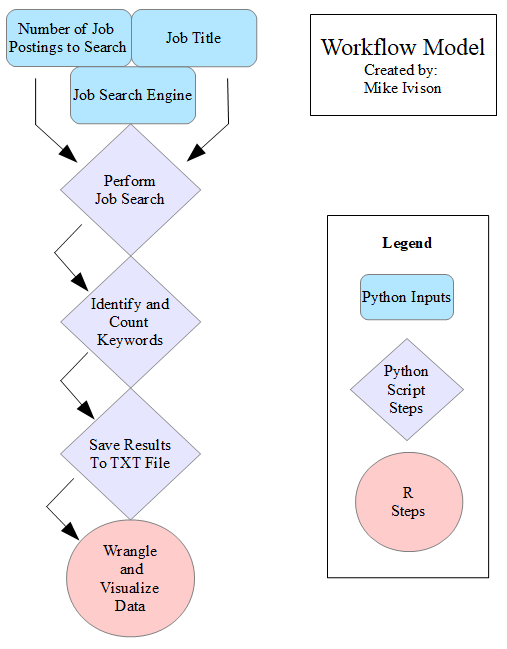
Illustration 2 – Job Trend Workflow Model
The Python script provides a output that looks something like this:
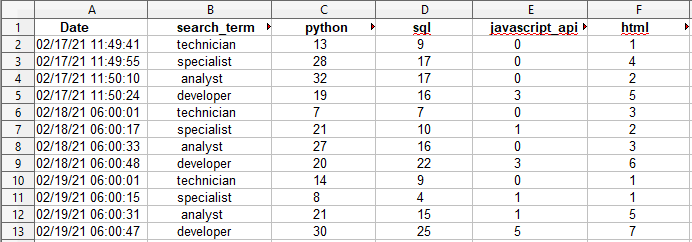
Illustration 3 – Sample Python Script Output
Once the information is in this format, it can be built into a data frame and queried to determine results. In this case, the R programming language was used to categorize the data by GIS Technician, Specialist, Analyst, and Developer. The mean number of search results for each keyword per category was calculated. This approach allows for a large number of skill set comparisons. The illustration at the top of this article compares programming job trends. A couple of other examples are trends comparing different Esri applications or Enterprise/Portal GIS solutions, as shown below:
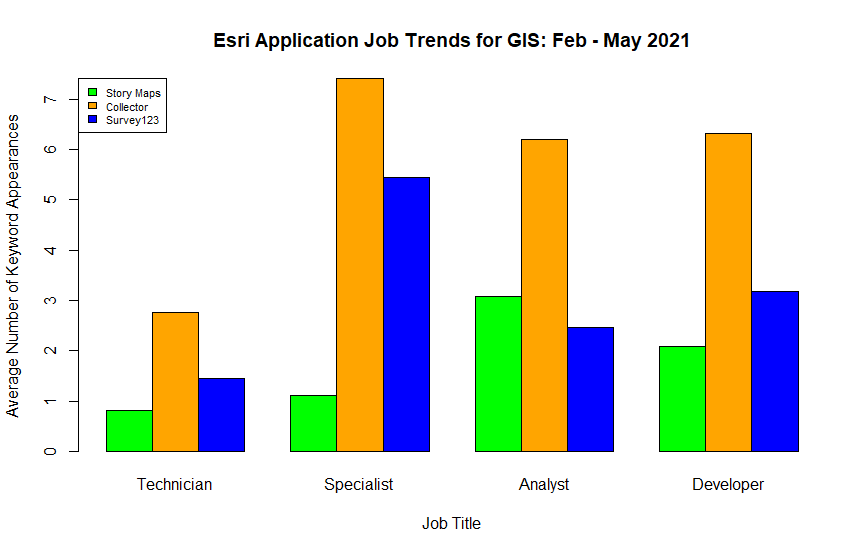
Illustration 4 – Esri Application Job Trends for GIS: Feb – May 2021
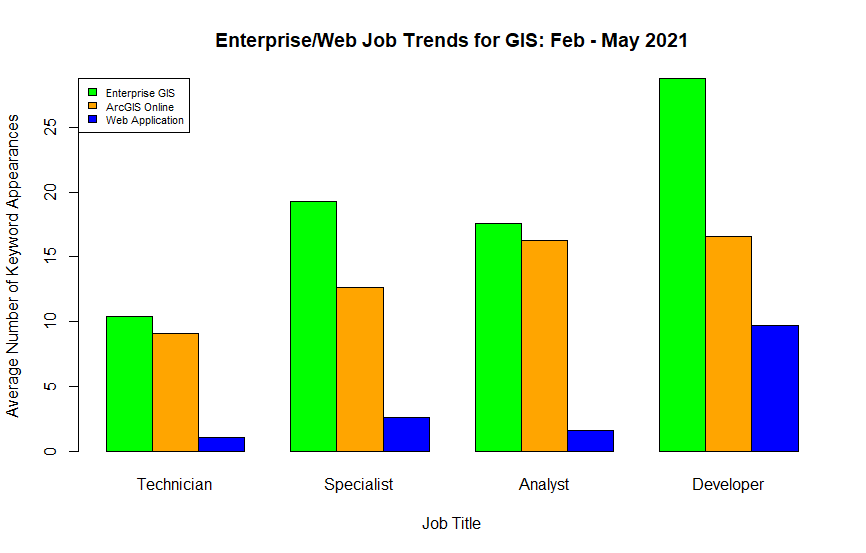
Illustration 5 – Enterprise/Web Job Trends for GIS: Feb – May 2021
As you can see, a lot of insight can be gained from the information when it has been gathered and visualized. Once the python script is written, it is adaptable and can be changed to search for new technologies or redefine keywords that may not be the ideal search term for the word. Changes in the visualization are also easy to accomplish because the R script imports an updated data set every time it runs.
Takeaways – and What’s Next?
As with any long-term GIS project, there will always be room for improvement. For instance, ArcMap and ArcPro were the keywords included in this data set. These are more conventionally written in job descriptions as ArcGIS Desktop and ArcGIS Pro, so the trends for those words were not reflective of reality and need to be adjusted in future iterations of the script. Or perhaps it might be better to compare ArcGIS Desktop vs. QGIS as ArcMap and ArcPro are sometimes included in job descriptions under the blanket term ArcGIS Desktop.
As this project is in early-stage development, it will be adjusted to reflect better results. However, there are some interesting trends that are already apparent. For instance, in the Programming Trends bar plot, programming skills are rather low for the GIS Technician role. Python and SQL become important in the GIS Analyst and GIS Specialist roles with Python slightly edging past SQL. In the GIS Developer roles, Javascript and HTML start to be required, and SQL takes a higher importance than Python. Additionally, the Esri Application bar plot identifies ArcGIS Collector as important in the Specialist, Analyst, and Developer roles while ArcGIS Survey123 seems more relevant in the Specialist role.
In conclusion, the geospatial career field is constantly evolving and tools like this will be a great way to keep track of the changes, adapt to them, and ultimately be successful. I hope this article was insightful. No matter where you are at in your geospatial career, I would encourage you to explore automated options, keep learning new things, and always strive to improve your GIS!

