What is INSPIRE Directive and its Purpose?
Imagine a Europe where environmental data flows seamlessly across borders—empowering decision-makers and individuals alike. This vision became a reality in 2007, thanks to the INSPIRE Directive, or Infrastructure for Spatial Information in Europe.
Officially known as Directive 2007/2/EC, INSPIRE was established by the European Union to create a cohesive framework for spatial data infrastructure across Europe.
A European Spatial Data Infrastructure (SDI) was established aimed at supporting environmental policies and other activities that could impact the environment.
Launched in 2007, its primary goal is to enhance the availability and interoperability of geospatial data, particularly for environmental policies and initiatives.
Designed to facilitate the sharing and access of spatial data across Europe, INSPIRE fosters more informed decision-making at all levels of government.
Since 2007, INSPIRE has impacted how geospatial data is supported across EU member states.
By standardizing data collection and sharing, the directive helps eliminate redundancies and improves the efficiency of data use across different sectors.
This interoperability allows for trouble-free integration of data from multiple sources, significantly benefiting environmental management, planning, and conservation efforts across EU-members.
What are the Key Features of INSPIRE?
The INSPIRE Directive encompasses 34 spatial data themes, which are then organized into three annexes. These themes cover a wide range of environmental and geographical information.
Major components:
- Network services: Such as discovery, view, and download services that allow users to find, visualize, and access spatial data.
- Metadata: Detailed descriptions of datasets help users understand the data’s context and usability.
- Data harmonization: INSPIRE promotes the standardization of data formats and protocols, enabling seamless integration of information from various sources.
Next, let’s look at the 24 spatial data themes in more detail.
Available Data and Formats
The directive covers an impressive 34 spatial data themes. Think of these are categories of geographic information that, are essential for understanding and managing our environment and environmental applications.
Here are some examples of the 34 spatial data themes to give you an idea:
- Weather patterns and ocean currents
- Geological data (rock types, fault lines)
- Land use information (urban areas, farmland, forests)
- Population distribution
- Transportation networks
- Protected natural sites
This diverse range of data means that various sectors can make the most of the varying data types and the applications they serve.
Standardized Formats: Making Life Easier
One of the best things about INSPIRE is that all this data comes in standardized formats. Why does this make a difference?
Well, it means that whether you’re a scientist in Spain or a policymaker in Poland, you can easily use and understand the data without worrying about compatibility headaches.
That’s because the standardized formats comply with international standards, making them readily usable across different platforms and applications. So, you’ll be able to use the data with most modern mapping software and analysis tools—which is a huge time-saver and reduces the risk of errors.
How to Access INSPIRE Data
The great thing about INSPIRE is that it’s designed to be easily accessible through what we call “network services”.
Data under INSPIRE is accessible via various platforms that offer tools for viewing and downloading the necessary datasets. The INSPIRE geoportal is one such platform that provides access to datasets provided by member states. Users can access this data for a range of applications.
Here’s how it works:
- Discovery Services: Helps you find the data you need
- View Services: Lets you visualize the data on maps
- Download Services: Allows you to get the actual data files
- Metadata: Access detailed metadata to understand the data’s origins and limitations
These services with the INSPIRE Implementing Rules, which include metadata, data specifications, and data sharing protocols. This ensures consistency and reliability.
INSPIRE data themes. Source
Challenges Facing the INSPIRE Project
While INSPIRE has made significant strides in improving geospatial data sharing across Europe, it’s not without its own growing pains!
The use of INSPIRE datasets is facing various challenges that impact their effectiveness across the European Union. One significant issue is the complexity and diversity of data formats among member states, which can hinder trouble-free integration and interoperability.
INSPIRE standards and protocols can be pretty complex. This lack of technical know-how can lead to inconsistent data quality and implementation.
Funding constraints and resource limitations also pose barriers to maintaining up-to-date and complete geospatial databases. This can result in outdated or incomplete datasets.
Furthermore, the evolving requirements of the INSPIRE Directive require continual adaptation of national infrastructures, a process that can be slow and fragmented due to varying national priorities and capacities.
To top it all off, each member state has its own set of priorities and challenges. What’s urgent for one country might not be as pressing for another. Such varied priorities can lead to a fragmented approach to implementing INSPIRE across Europe.
Challenges Facing the INSPIRE Directive
While INSPIRE has made significant strides in improving geospatial data sharing across Europe, it’s not without its own growing pains!
The use of INSPIRE datasets is facing various challenges that impact their effectiveness across the European Union. One significant issue is the complexity and diversity of data formats among member states, which can hinder trouble-free integration and interoperability.
INSPIRE standards and protocols can be pretty complex. This lack of technical know-how can lead to inconsistent data quality and implementation.
Funding constraints and resource limitations also pose barriers to maintaining up-to-date and complete geospatial databases. This can result in outdated or incomplete datasets.
Furthermore, the evolving requirements of the INSPIRE Directive require continual adaptation of national infrastructures, a process that can be slow and fragmented due to varying national priorities and capacities.
To top it all off, each member state has its own set of priorities and challenges. What’s urgent for one country might not be as pressing for another. Such varied priorities can lead to a fragmented approach to implementing INSPIRE across Europe.
Exploring INSPIRE Data through Map Browsers
Several national online mapping websites allow users to interact with INSPIRE datasets visually.
To discover what INSPIRE datasets are available for a specific country, visiting that country’s national geoportal is a good starting point. These sites typically provide information about available datasets, how to access them, and guidance on their use.
While many countries have made significant progress in making their INSPIRE data available, the project is still evolving. Some nations are further along in their implementation, resulting in more comprehensive and user-friendly geoportals. Others may still be working on providing full access to their datasets.
We’ve gathered information about national geoportals below:
| Country | INSPIRE Portal Website |
| European Union | https://inspire-geoportal.ec.europa.eu/ |
| Austria | https://www.geoportal.at/ |
| Belgium | https://www.geo.be/ |
| Bulgaria | https://www.cadastre.bg/ |
| Croatia | https://www.geoportal.hr/ |
| Cyprus | https://data.gov.cy/ |
| Czech Republic | https://www.geoportal.cz/ |
| Denmark | https://www.kortforsyningen.dk/ |
| Estonia | https://geoportaal.maaamet.ee/ |
| Finland | https://www.paikkatietoikkuna.fi/ |
| France | https://www.geoportail.gouv.fr/ |
| Germany | https://www.geoportal.de/ |
| Greece | https://maps.geoportal.gov.gr/ |
| Hungary | https://www.foldhivatal.hu/ |
| Ireland | https://www.geohive.ie/ |
| Italy | https://www.pcn.minambiente.it/ |
| Latvia | https://www.lgia.gov.lv/ |
| Lithuania | https://www.geoportal.lt/ |
| Luxembourg | https://www.geoportal.lu/ |
| Netherlands | https://www.pdok.nl/ |
| Poland | https://www.geoportal.gov.pl/ |
| Portugal | https://snig.dgterritorio.gov.pt/ |
| Slovakia | https://www.geoportal.sk/ |
| Slovenia | https://prostor.gov.si/ |
| Spain | https://www.idee.es/ |
| Sweden | https://www.geodata.se/ |

Inspire Datasets – Orthoimage
Inspire Datasets – Elevation
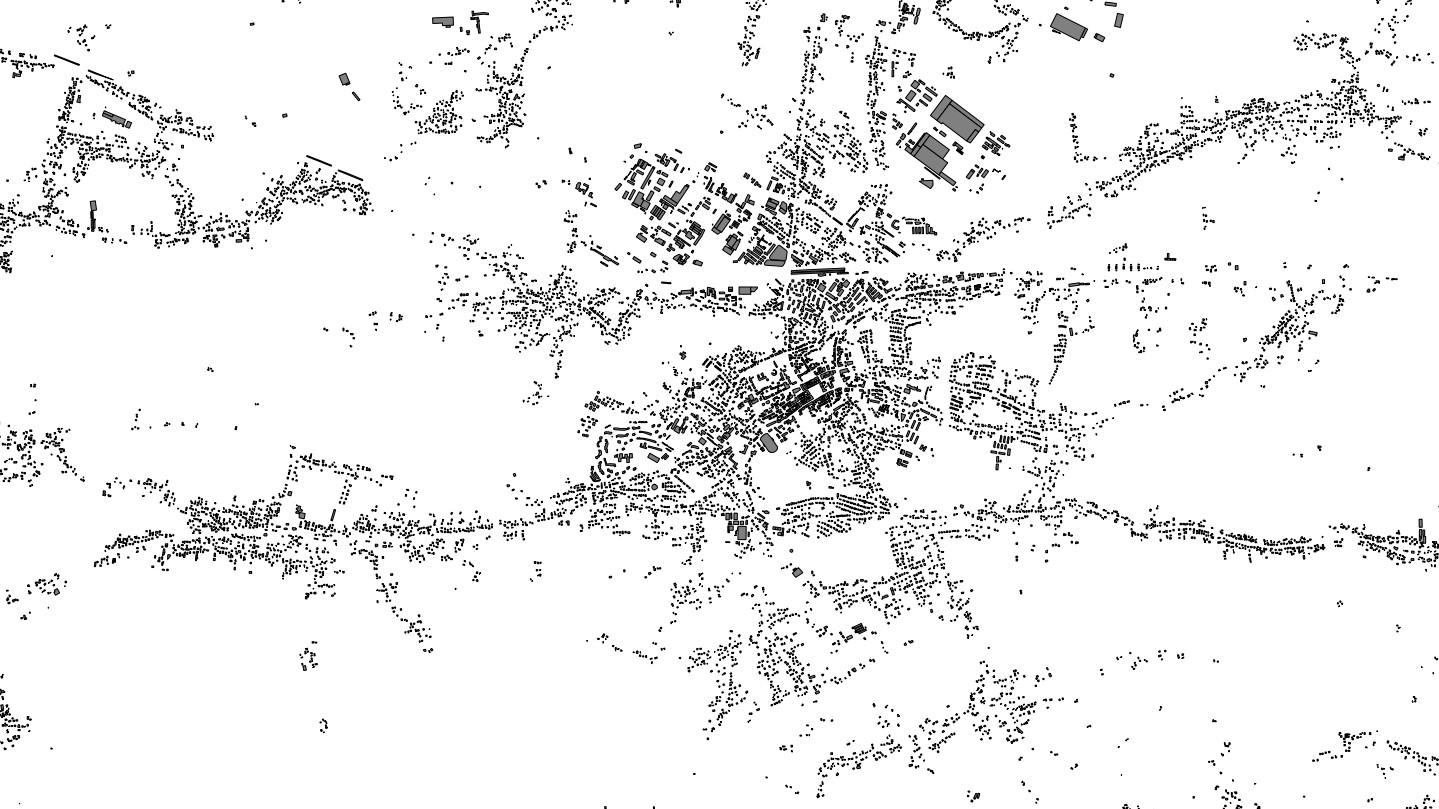
Inspire Datasets – Buildings
The Future of INSPIRE Directive
The INSPIRE project is still a work in progress that’s continuously evolving. t remains a key element in Europe’s data strategy, especially in light of needs such as climate change monitoring and disaster management.
One of INSPIRE’s strengths is its responsiveness to user needs. Its development is supported by continuous feedback from users and technological advancements, ensuring that the infrastructure remains relevant and user-friendly.
INSPIRE isn’t just important for Europe—it’s setting a benchmark for international efforts in managing and collaborating on geospatial data.
Despite challenges, it’s important to remember that INSPIRE is a massive undertaking that’s already yielding benefits. As with any large-scale project, ironing out these issues takes time, collaboration, and persistence.
The goal of creating a unified, accessible geospatial data infrastructure for Europe is still very much alive – it’s just a matter of navigating these hurdles along the way. INSPIRE continues to develop, it’s bringing us closer to a future where geospatial data flows freely across borders, supporting better decision-making and innovation.
For more detailed insights into the INSPIRE Directive and access to its governing data, you can visit the INSPIRE Knowledge Base and the INSPIRE Geoportal.
Did you like this post? Read more and subscribe to our monthly newsletter!

#Ideas

Next article
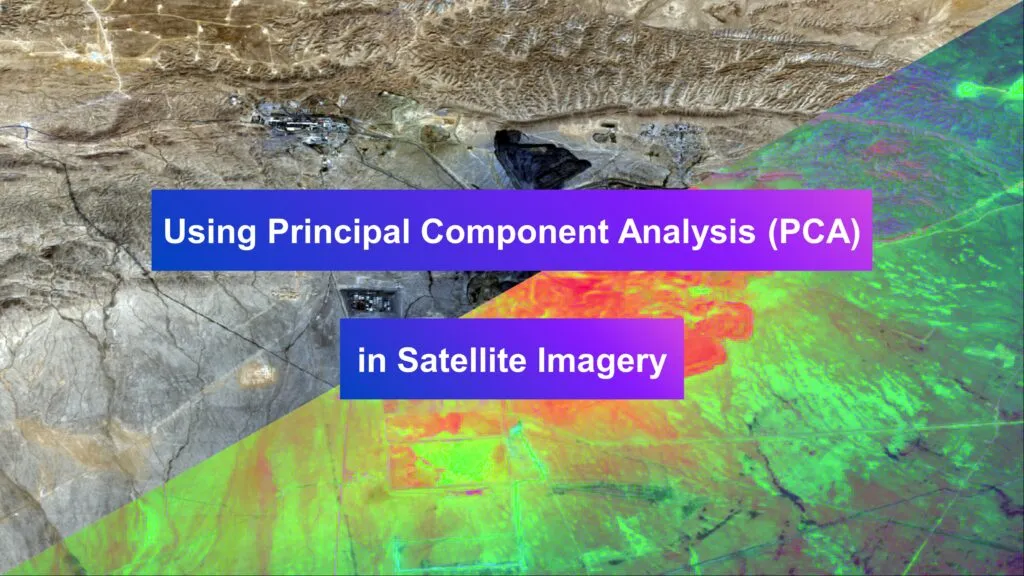
Using Principal Component Analysis (PCA) in Satellite Imagery: A Concise Guide with QGIS Application
Introduction
Principal Component Analysis (PCA) is a statistical technique used in satellite image processing. It helps enhance image data, reduce dimensionality, and improve interpretability while retaining important information—all while preserving crucial information.
So, how does it work? PCA transforms your original correlated variables into a set of values of linearly uncorrelated variables, known as principal components. Think of these components as a refined version of your data. They are derived from your original dataset and capture the most significant variance available.
The first principal component accounts for the largest possible variance. Then, each succeeding component has the highest variance possible under the orthogonal constraint to the previous components.
What’s the outcome? A more manageable dataset that retains the essential features of your satellite images, making them easier to analyze and interpret.
Principal Component Analysis in Satellite Imagery: Finding Patterns in Multispectral Data
In the context of satellite images, PCA is particularly valuable for its ability to reduce the large dimensionality of data while highlighting features that are most informative for further analysis like classification or change detection.
This technique enhances the contrast between features in different bands of a multispectral image, which can be highly important for identifying patterns or anomalies in environmental studies, urban planning, and resource management. This makes it easier to analyze patterns and anomalies.
To summarize, what are the benefits of PCA?
- Dimensionality reduction: PCA compresses multiple spectral bands into fewer, more manageable components without losing important information.
- Enhanced contrast: It improves the visibility of features across different bands, helping with tasks like classification and change detection.
- Noise reduction: By separating relevant signals from noise, PCA reduces noise while enhancing image quality.
Using PCA with QGIS Software and the Semi-Automatic Classification Plugin

SCP logo
QGIS offers tools for implementing PCA through plugins such as the Semi-Automatic Classification Plugin (SCP) and PCA4CD.
The SCP allows users to perform PCA to analyze satellite imagery and generate outputs that can be used for further analysis or visual interpretation.
To use PCA in QGIS through SCP:
- Load your satellite imagery into QGIS.
- Open the SCP and configure your band set by selecting the appropriate satellite bands.
- Navigate to the “Band Processing” tab within SCP and select PCA.
- Specify the number of principal components you wish to generate (commonly three for an RGB image).
Run the PCA, and the plugin will output PCA images which can then be visualized or used in further analyses (more info: QGIS in Mineral Exploration).
Understanding Principal Component Analysis Outputs
The outputs from PCA in QGIS include:
- PCA component images: These images represent the transformed data, typically focusing on the first few components for visualization (e.g., PCA1, PCA2, PCA3 for three-component analysis).
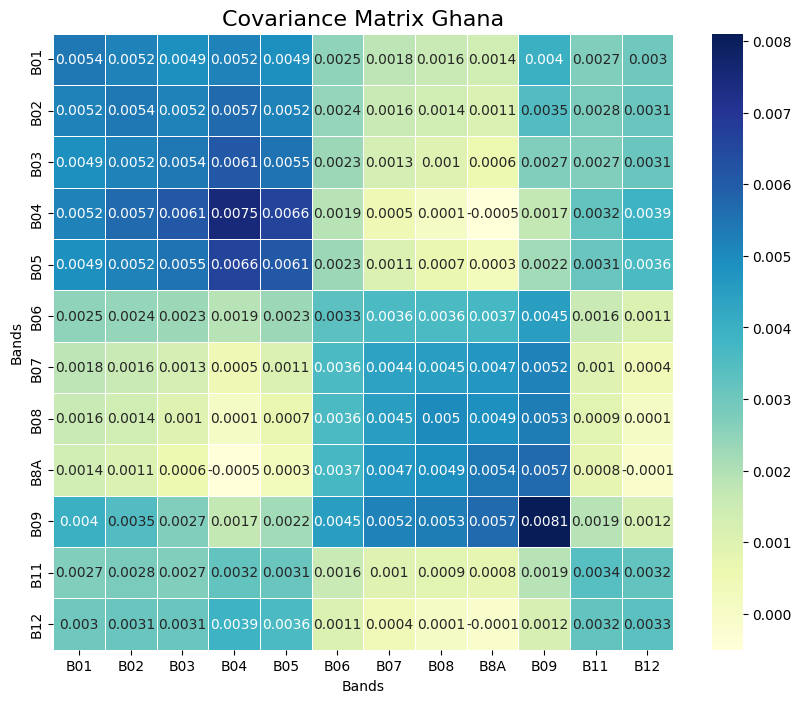
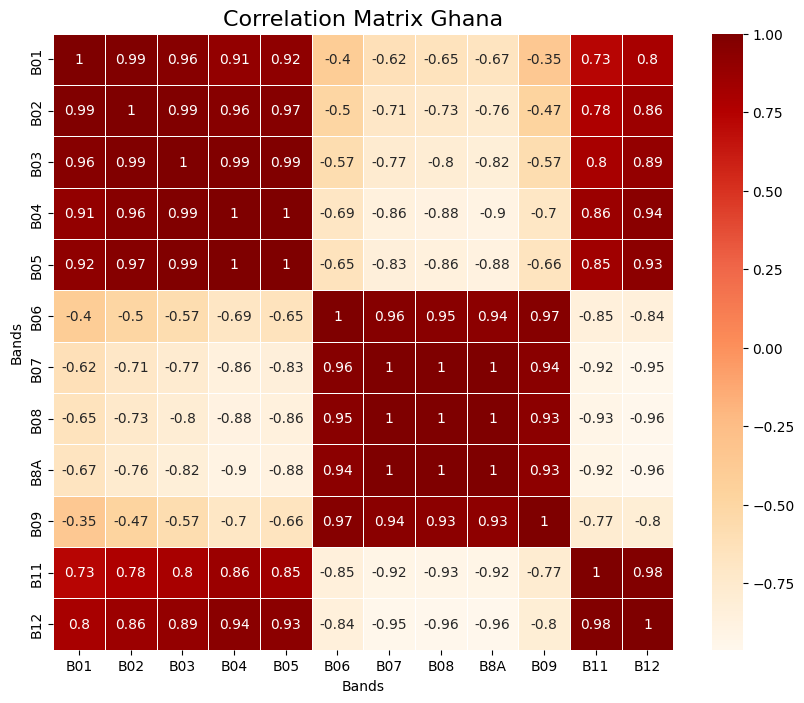
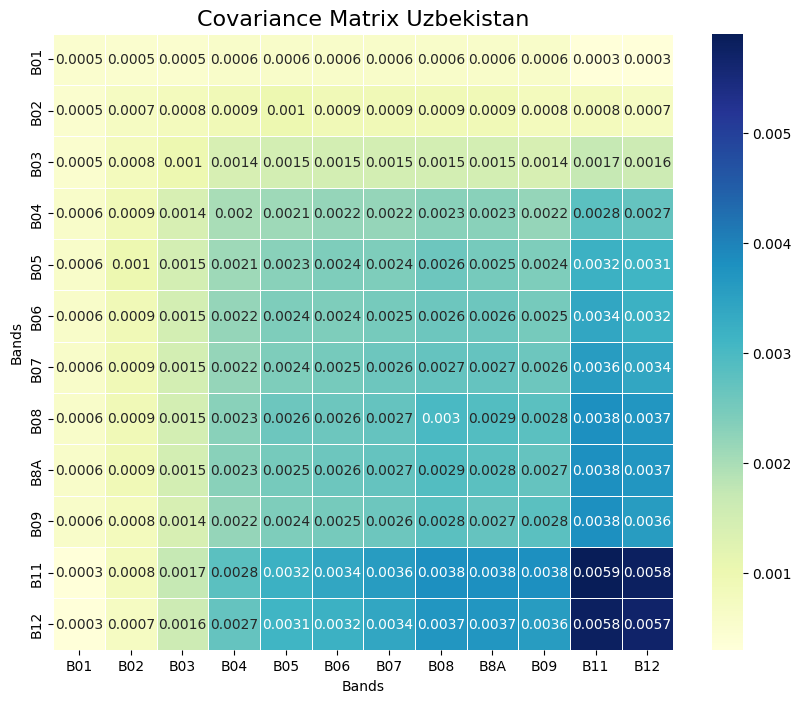
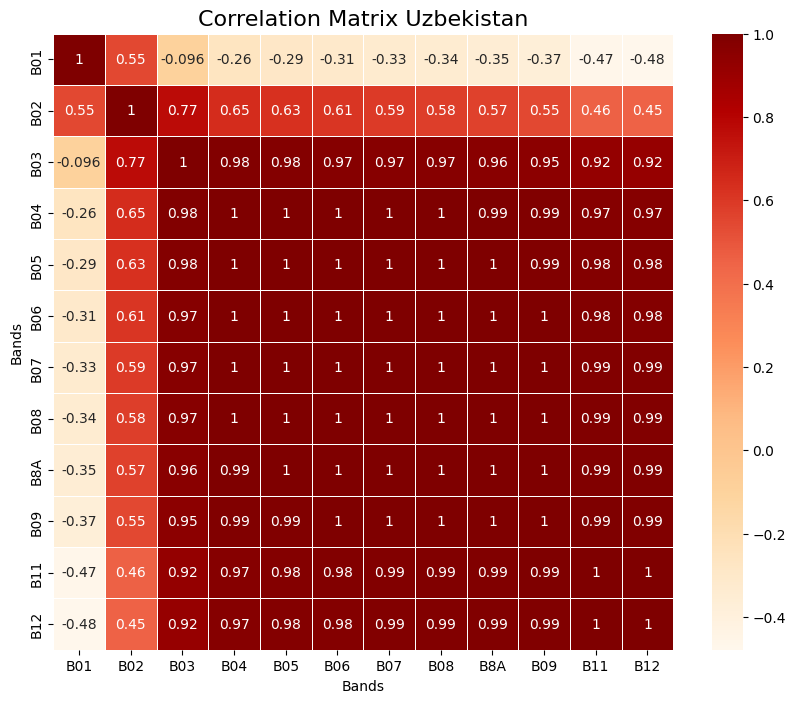
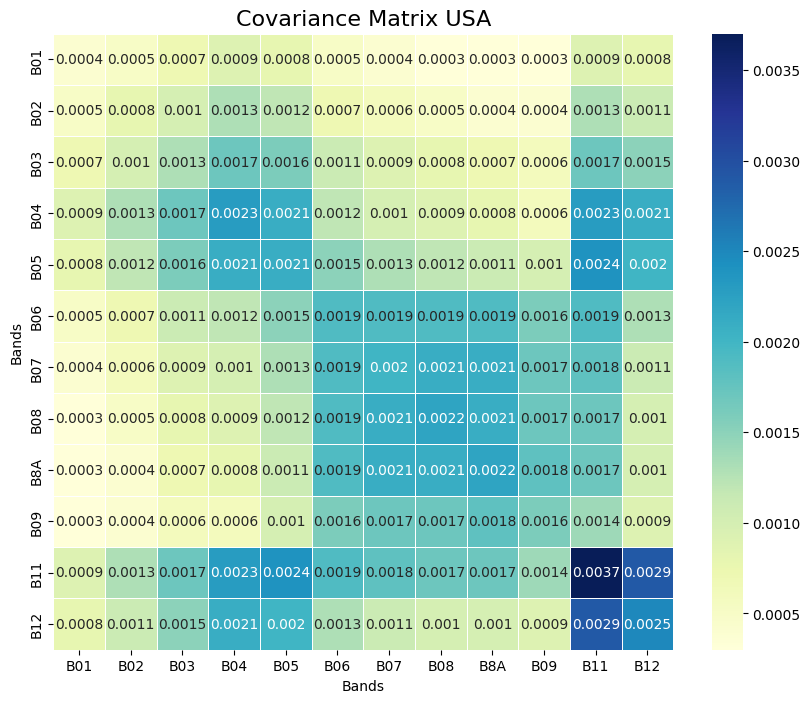
- Statistical metrics: Outputs such as the covariance matrix, correlation matrix, eigenvectors, eigenvalues, accounted variance, and cumulative variance. Equipped with these metrics, you can better understand the data’s underlying structure and how much variance each principal component captures from the source data.
Applications of Principal Component Analysis
PCA is widely used in various fields, including environmental studies, urban planning, and resource management. It helps improve land cover classification, monitor changes over time, and extract critical features from complex datasets.
Let’s look at an example of PCA used for mineral exploration below:
Case Study: In Search of Gold-Prone Zones in Ghana, USA, and Uzbekistan
Implementing PCA on satellite images can also be used in mineral exploration to identify areas with potential mineral deposits.
For instance, analyzing multispectral images of Asanko Gold Mine Camp in Ghana and Uzbek Muruntau Gold Mine using PCA helps highlight geological features that are typically associated with gold deposits, such as alteration minerals and geological structures. This process involves:
- Selecting regions of interest within the satellite images.
- Applying PCA to highlight anomalies and patterns indicative of mineralization.
- Analyzing and interpreting the PCA outputs to pinpoint locations that warrant further field investigation or sampling.
This approach allows geologists and researchers to efficiently target potential gold-prone areas, reducing time, cost, and environmental impact compared to traditional exploration methods.
True view, PCA1, PCA2, PCA3 and band composition (PCA1, PCA2, PCA3) for mine Ghana
True view, PCA1, PCA2, PCA3 and band composition (PCA1, PCA2, PCA3) for mine Uzbekistan
True view, PCA1, PCA2, PCA3 and band composition (PCA1, PCA2, PCA3) for mine in USA
 |
 |
 |
 |
 |
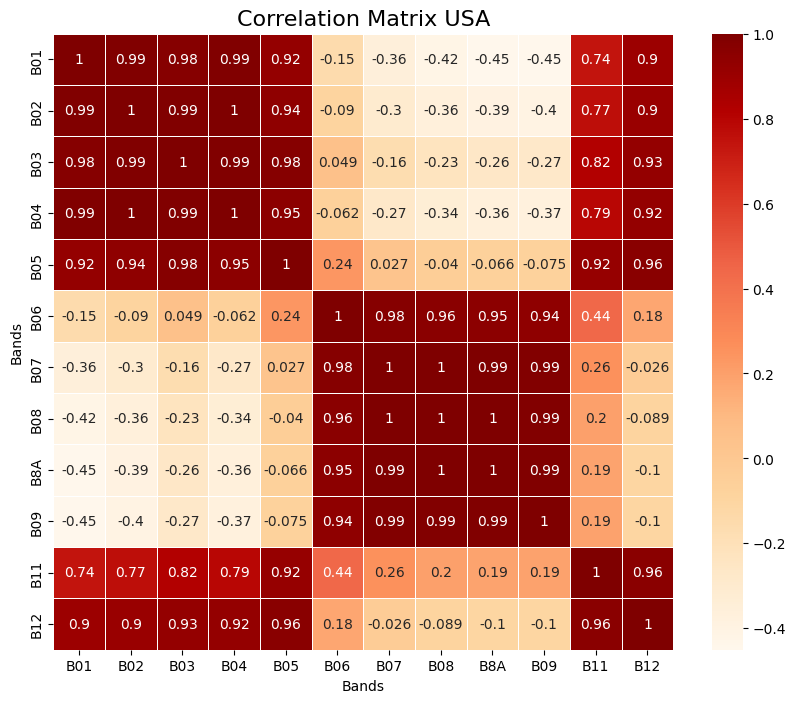 |
Covariance and Correlation Matrixes
Conclusion: The Power of PCA in Geospatial Analysis
PCA is a technique that offers a way to enhance satellite imagery and extract meaningful information from large datasets.
By using PCA in geospatial software, researchers and practitioners can gain insights into the spatial structures of the data, enabling more informed decision-making in various fields such as environmental monitoring, urban planning, and resource exploration.
As we face increasingly complex global challenges, techniques like Principal Component Analysis will be crucial in helping us understand and manage our world.
Did you like this post about Principal Component Analysis? Read more and subscribe to our monthly newsletter!

