Sound and the city. How can you map sounds?
Visualizing geotagged data can reveal a unique spatial pattern that might allow you and/or decision makers to make choices based on knowledge. We’ve seen maps of different phenomena like diplomacy networks, human activity, the age of buildings, adultery, or even sights of Virgin Mary. But how can one map sounds of a city?
The most straightforward approach would include listening to urban sounds, measuring and interpreting it but the scale of that kind of project would make it hardly doable. Another approach that has been implemented a few months back by Trulia, includes mapping noise complaints.
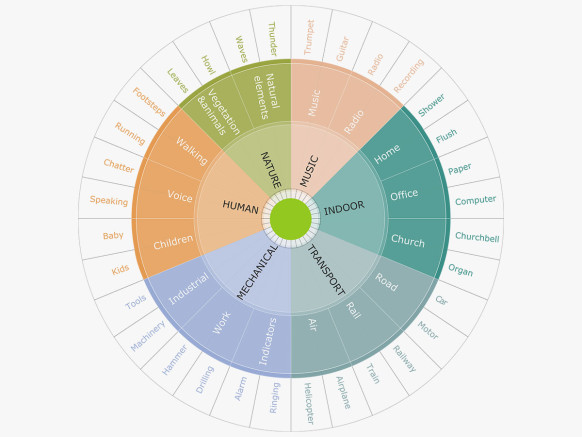
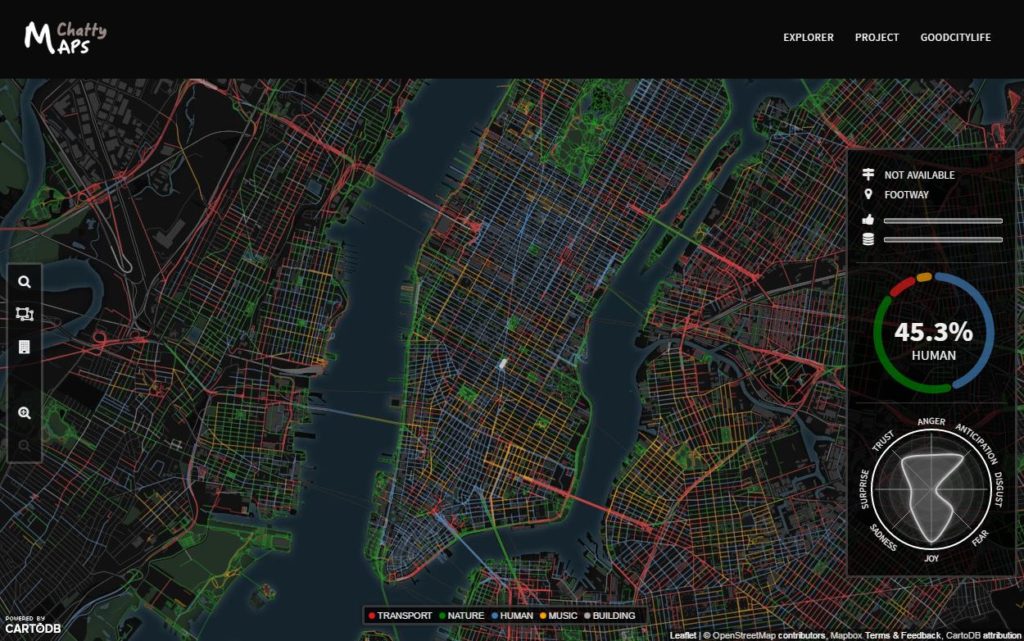
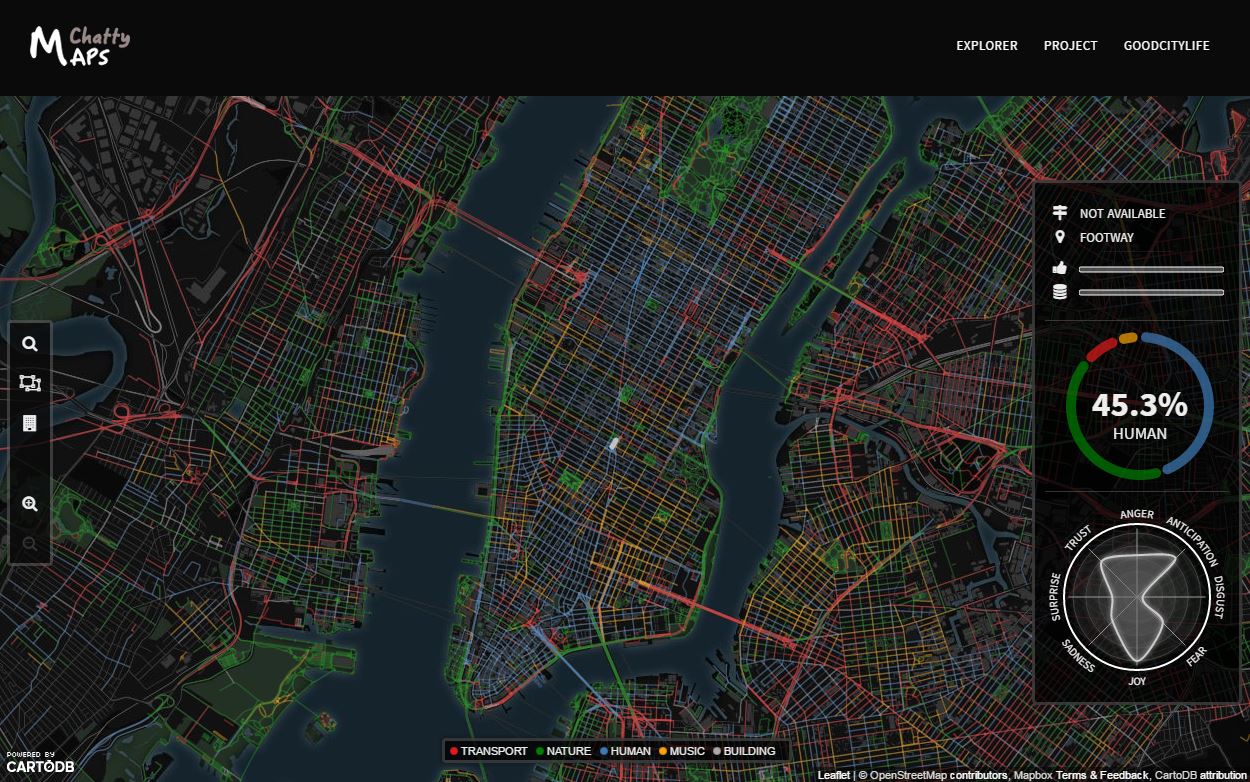
The new project called Chatty Maps looks at the same topic from a different angle. The maps were created by mining Flickr for geo-tagged images containing sound-related words. The researchers started with creating a library of sound-related words which they were looking in the description of photos. These words are taken from Freesound, the largest crowdsourced online repository of audio samples and then categorized into six types: transport, nature, human, music, mechanical, and indoor sounds.
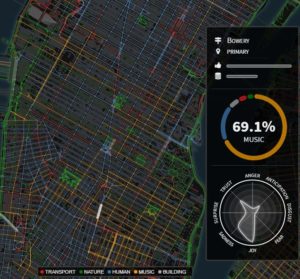 Each of the street on the maps is colored according to what kind of noise is mostly associated with it. Blue means human-related sounds, red stands for transportation, green for nature, yellow for music, and gray for construction. When you click on a particular street, you get its sound profile. Everything is nicely done in CartoDB.
For now, the maps are available for New York, San Francisco, Chicago, Boston, Washington, Miami, Seattle, London, Barcelona, Madrid, Milan, and Rome.
Cool project.


