Must-Have QGIS Plugins To Elevate Your Mapping Projects
The QGIS ecosystem thrives thanks to its active community and an impressive array of plugins. These plugins continuously add new features to QGIS, making it easy and efficient for users to perform geospatial processing.
Here is a list of the most popular and useful QGIS plugins, along with insights on how they can elevate your GIS work.
1. QuickMapServices
For continuously updated catalogs of basemaps and a user-friendly interface
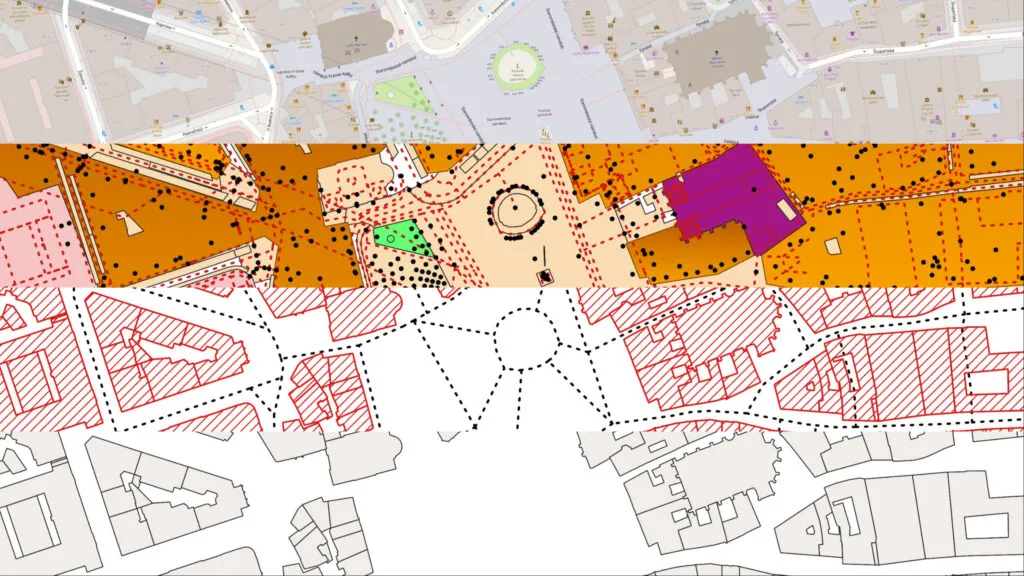
Whether you’re a seasoned GIS professional or just starting out, QuickMapServices (QMS) makes it simple to add the perfect basemap to your project with just a few clicks. It provides access to many different types of maps, including Google, Bing, and OpenStreetMap (OSM) layers. QMS, which has been downloaded over 7.2 million times, has an extensive catalog and customizable features, making it an essential plugin for any QGIS user.

2. Aino
For simplified, AI-enhanced OpenStreetMap (OSM) data capabilities
Aino is a powerful plugin designed for users who want to harness the full potential of OSM data. It makes easier to use OSM data. The plugin offers tools to efficiently download, parse, and integrate OpenStreetMap layers directly into QGIS. It has simple options for filtering and selecting specific OSM features (like roads, buildings, or points of interest). It makes it easy to work with open geospatial datasets.
One of the standout features of Aino is its AI-driven capability to convert natural language prompts into relevant OSM data. For example, you can simply type “parks in Barcelona,” and Aino will gather the corresponding vector layers for you. This no-code approach streamlines the data-gathering process, allowing users to focus more on analysis and less on technical details.
More use-cases:
https://youtube.com/shorts/zBmSAjCR-JU?si=ElVsIKLZThUTwbnE
https://youtube.com/shorts/V2ZrkZO3M0s?si=VKq4yTBTUBsYJEsX
3. MMQGIS
For user-friendly data manipulation and extensive processing tools beyond the standard toolbox
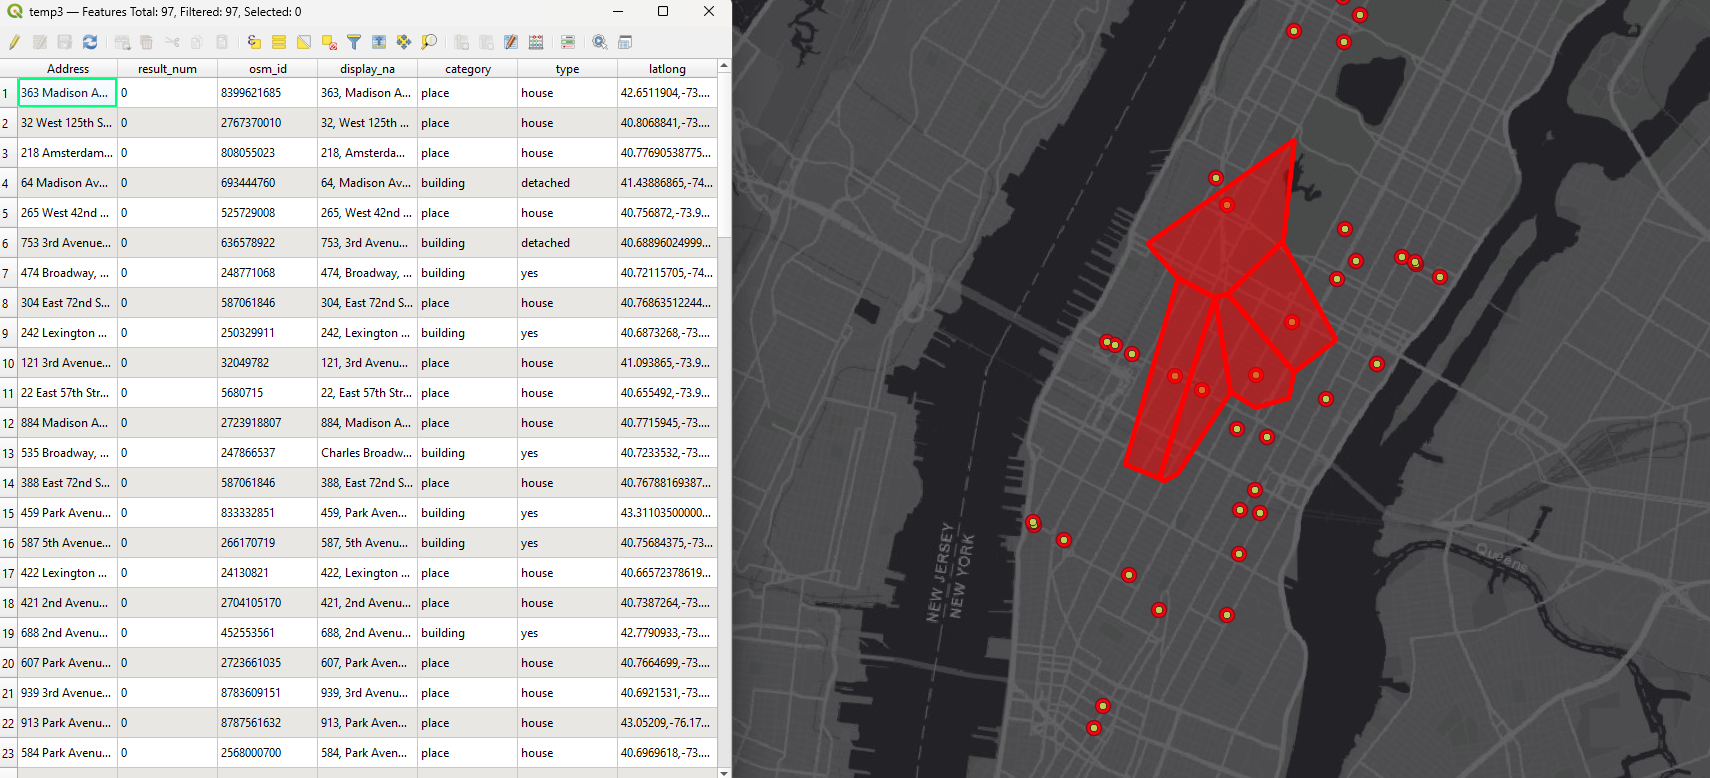
MMQGIS is a standout plugin for QGIS users who need powerful tools for data manipulation and processing. It offers a variety of tools for working with data, such as geocoding, attribute manipulation, and spatial operations. MMQGIS is perfect for bulk processing tasks, such as merging layers, geocoding addresses, and creating spatial joins. MMQGIS simplifies these processes with ease.
What truly sets MMQGIS apart is its user-friendly interface and the extensive range of tools it provides, which are often not available in the standard Processing toolbox. For instance, the geocoding feature allows you to convert a list of addresses into geographic points quickly or reverse geocode points back into addresses. This capability is invaluable for urban planners, researchers, and anyone working with large datasets who needs to streamline their workflows.
4. Data Plotly
For creating stunning, interactive visualizations directly from spatial data
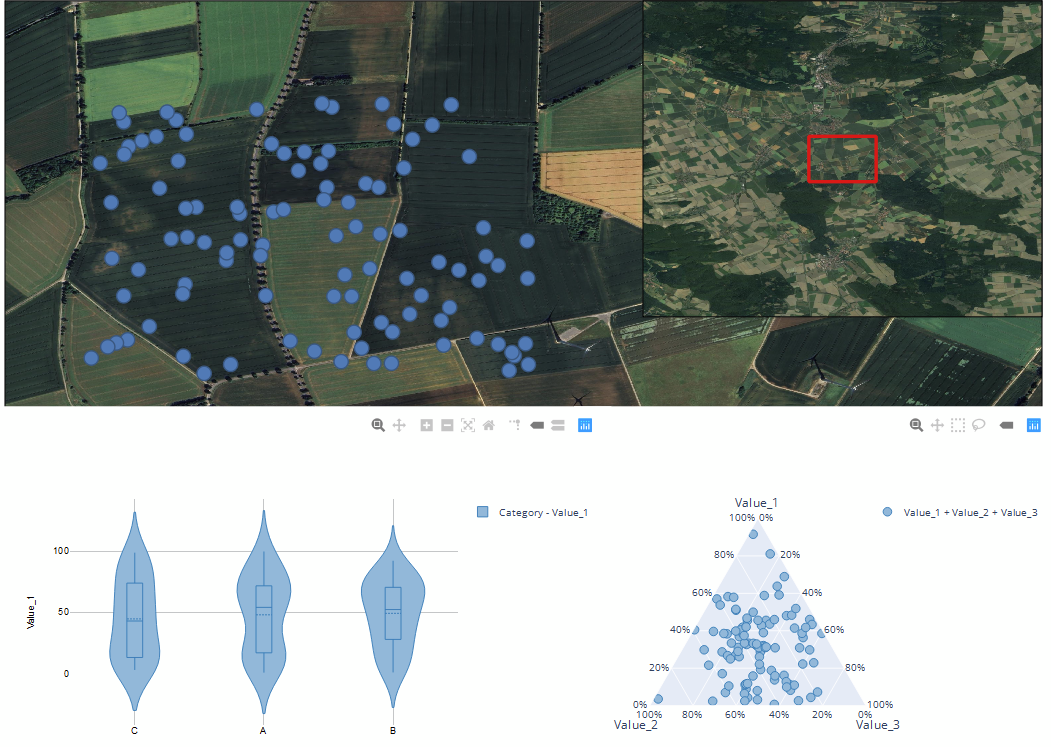
Data Plotly is an exceptional plugin if you want to present complex datasets in a visually appealing and highly interactive way. This plugin integrates advanced plotting capabilities into QGIS, using the Plotly library. It is great for creating interactive, publication-quality charts and graphs directly from your spatial data.
With Data Plotly, you can easily create a variety of D3-like plots—such as scatter plots, bar charts, and histograms—right within QGIS. One of its standout features is the ability to link your plots with the QGIS map canvas. This means that when you select a point on your chart, the corresponding feature on the map is automatically highlighted, making it easier to explore relationships between your data and its geographic context.
More info: https://youtu.be/-fz9wHEBoR4?si=o01EZAgWMiZpfwup
5. TimeManager
For studying temporal patterns through engaging animations
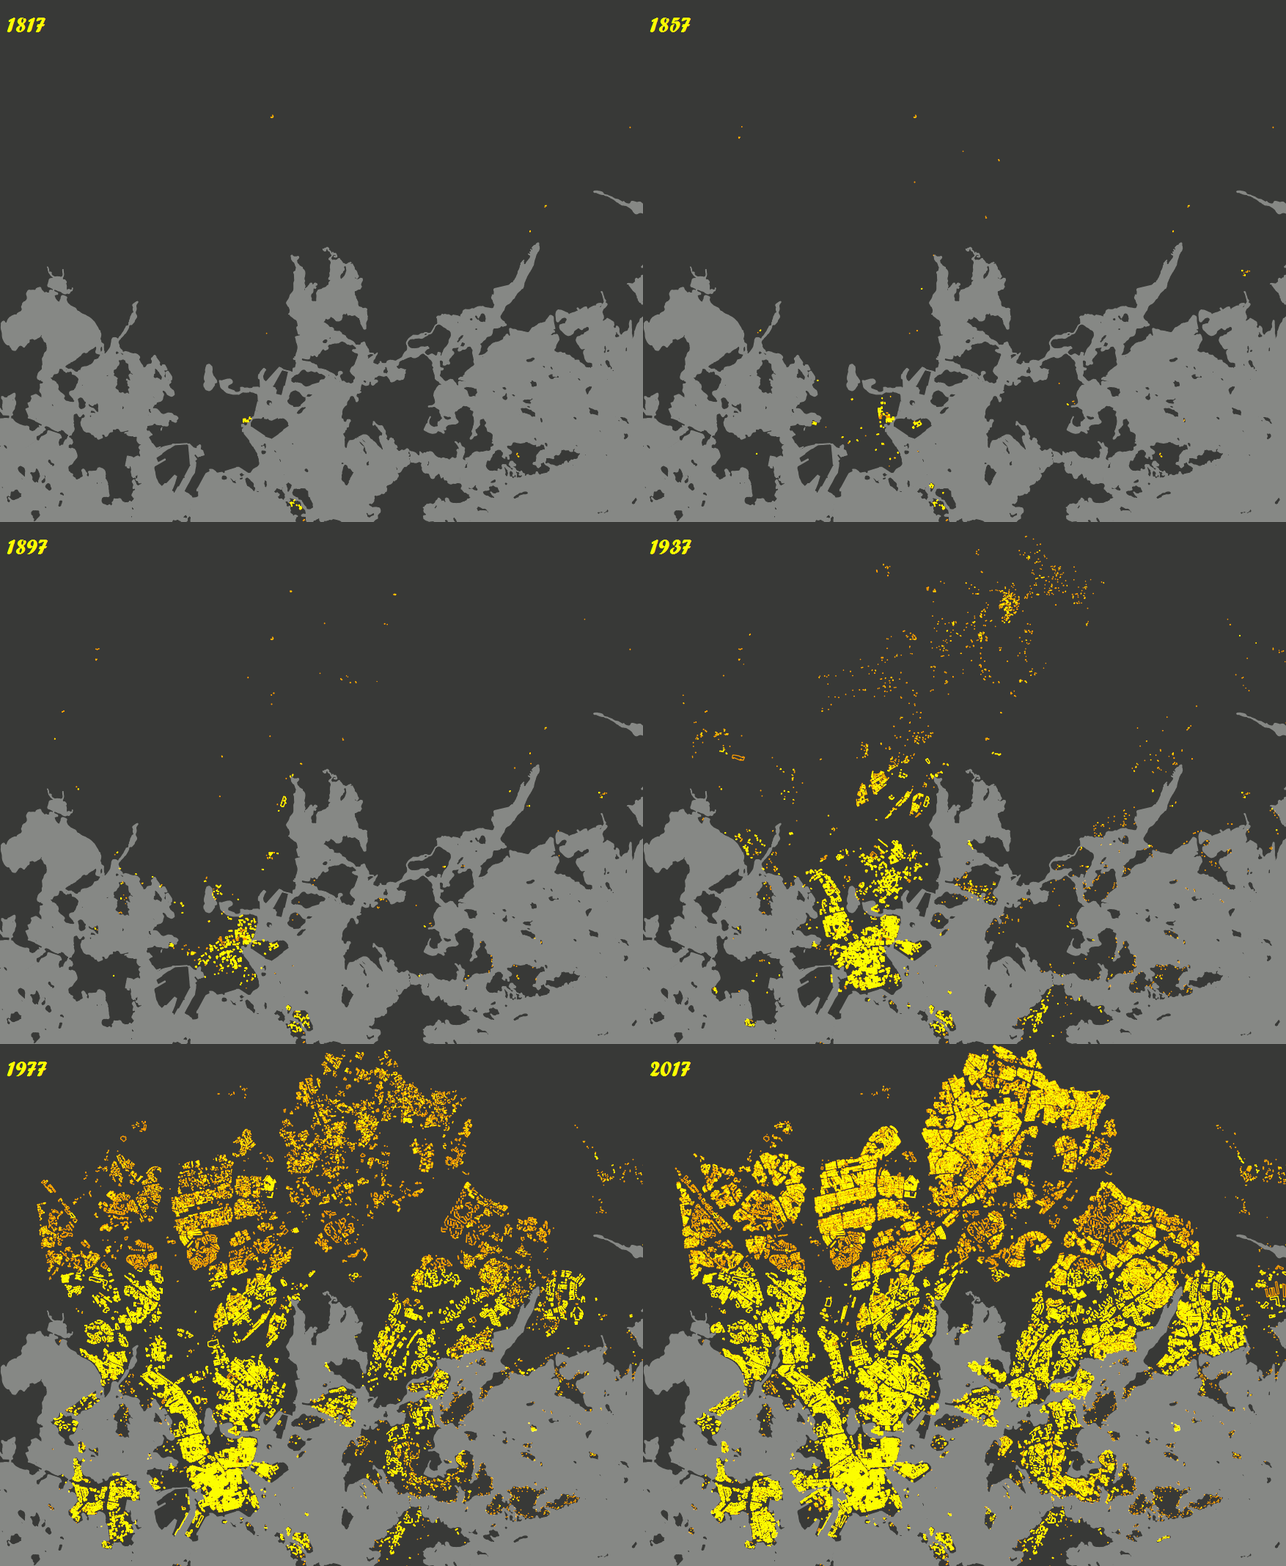
TimeManager is a fantastic plugin that brings a dynamic element to your spatial data by allowing you to analyze and visualize changes over time. Its ability to create engaging animations that showcase how data evolves makes it the perfect tool for researchers, urban planners, and environmental scientists who need to study temporal patterns.
With TimeManager, you can easily set up a time slider that lets you filter your datasets based on specific time intervals. This means you can track the progression of events, such as the spread of urban development or changes in land use, in a visually compelling way. The plugin also allows you to synchronize multiple spatio-temporal layers, giving you full control over the animation speed and step size.
 |
 |
6. Profile Tool
For creating detailed elevation profiles from raster layers to analyze terrain
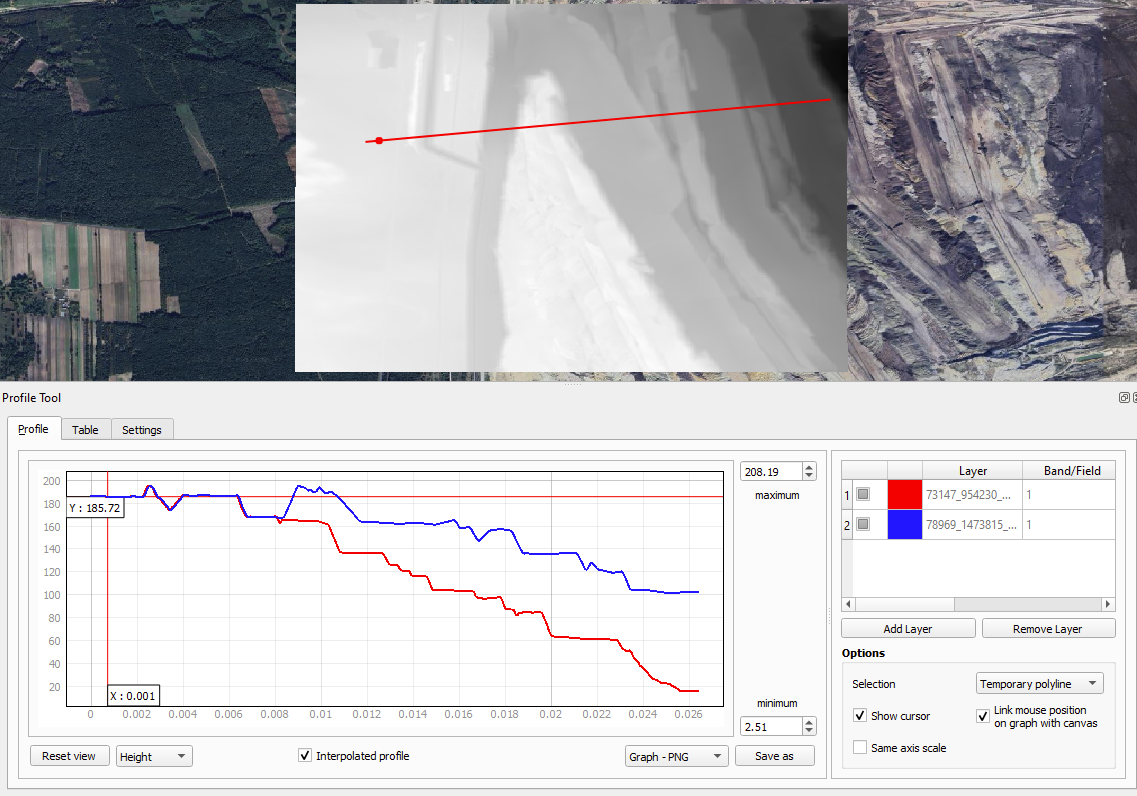
Profile Tool creates elevation profiles from raster layers, making it an essential tool for anyone analyzing terrain. It allows users to see changes in height along a line, giving you a clear understanding of the landscape’s features.
This plugin is particularly useful for geologists, environmental scientists, and urban planners who need to stufy how terrain varies over distance. With Profile Tool, you can simply draw a line on your map where you want to analyze elevation, and it will generate a profile that shows the ups and downs of the terrain along that path. This feature is invaluable for assessing slopes, valleys, and ridges, helping you make informed decisions based on the topography.
7. OSMDownloader
For quickly downloading and importing OpenStreetMap data in a variety of formats
OSMDownloader is a fantastic plugin for QGIS that simplifies the process of downloading and importing OpenStreetMap (OSM) data. Its user-friendly interface allows you to quickly select an area of interest by drawing a rectangle on the map.
Once you’ve defined your area, OSMDownloader handles the rest. It not only downloads the OSM data but also automatically loads it into QGIS as layers. Another highlight of OSMDownloader is its ability to download data in a variety of formats, making it flexible for different project requirements.
8. QGIS2ThreeJS
For creating stunning 3D visualizations using WebGL technology
QGIS2ThreeJS is an impressive plugin that allows users to create stunning 3D visualizations of their QGIS layers using WebGL technology. Use it to transform complex geospatial data into interactive 3D maps that can be easily shared and viewed in any web browser.
For example, with QGIS2ThreeJS, you can visualize Digital Elevation Models (DEMs) and vector data, allowing you to see terrain features and spatial relationships in a whole new dimension. The ability to export these visualizations as HTML files means you can showcase your work in presentations or share it with stakeholders without needing specialized software.
9. SRTM Downloader
For easily downloading SRTM (Shuttle Radar Topography Mission) elevation data
STRM Downloader does exactly what it sounds like it does – it makes it easier to download SRTM elevation data. People who work with terrain and topography will find this plugin very useful because it allows them to obtain elevation data quickly, without needing external tools or complicated procedures.
With SRTM Downloader, you can easily define your area of interest by drawing a rectangle on the map or entering coordinates, and the plugin will automatically download the relevant SRTM data tiles in .hgt format. This means you can get accurate elevation data for your specific project area in just a few clicks.
10. LAS Tools
For batch-processing of LiDAR data directly within QGIS’s processing framework
The LAS Tools plugin allows users to process LiDAR data directly in QGIS. Its robust set of functionalities are specifically designed for working with point cloud data, including classification, thinning, and exporting options.
One of the standout features of LAS Tools is its ability to handle large datasets efficiently. With over 50 powerful tools at your disposal, you can easily perform complex operations like extracting ground points, generating digital elevation models (DEMs), and filtering noise from your LiDAR data. LAS Tool’s batch-processing capabilities allow you to automate repetitive tasks, saving you significant time and effort.
11. Value Tool
For displaying the values of multiple raster layers simultaneously
Value Tool is a handy plugin for QGIS that allows users to display the values of multiple raster layers simultaneously. Its ability to provide real-time data insights right at your mouse’s position on the map makes it incredibly useful for comparative analysis of raster datasets, such as temperature or precipitation layers.
Another standout aspect of Value Tool is its flexibility; it supports not just raster layers but also mesh layers, allowing for a broader range of applications in your analyses.
This plugin is particularly beneficial for researchers, environmental scientists, and anyone involved in spatial analysis who needs to understand how different raster layers interact with one another.

These QGIS plugins show how useful and powerful the QGIS platform is. If you’re a developer, data analyst, or GIS professional, you can improve your work and get better results by using these.
Check out these plugins today to transform your geospatial workflows and push the boundaries of what’s possible with QGIS.
Are you familiar with or have you used any of these tools? Which plugin do you find most useful?
Read more and subscribe to our monthly newsletter!


