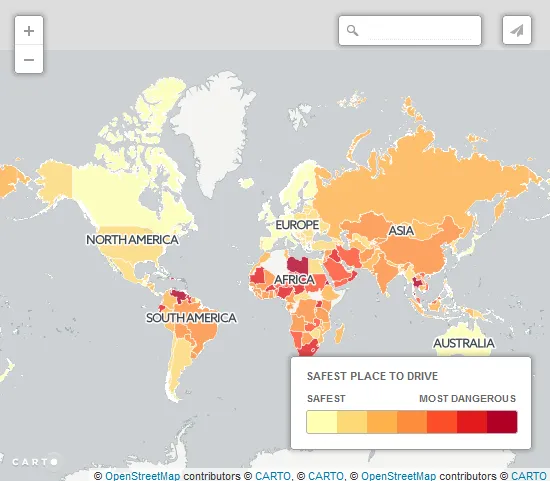
We’ve been always complaining about the way Twitter uses location information. Although a huge number of users geotag their tweets, Twitter was never able to do anything useful with it. The map below created by Mapbox designer Eric Fischer shows over 6 billion geotagged tweets.
We can see that the level of detail is huge… Imagine what could be done with it… Unfortunately as far as we know Twitter was never able to create any significant value for users, advertisers or anyone else besides data researchers and designers. Users could add city-level location tags to their tweets but in order see it you would have to click into a tweet’s detail view (as it was not showed on a timeline). You could than click on city name to see its location-based feed but at that scale it never made any sense. Advertisers could use some geotargeting options on a regional or city level but it was never really detailed enough to bring much traction to the market.
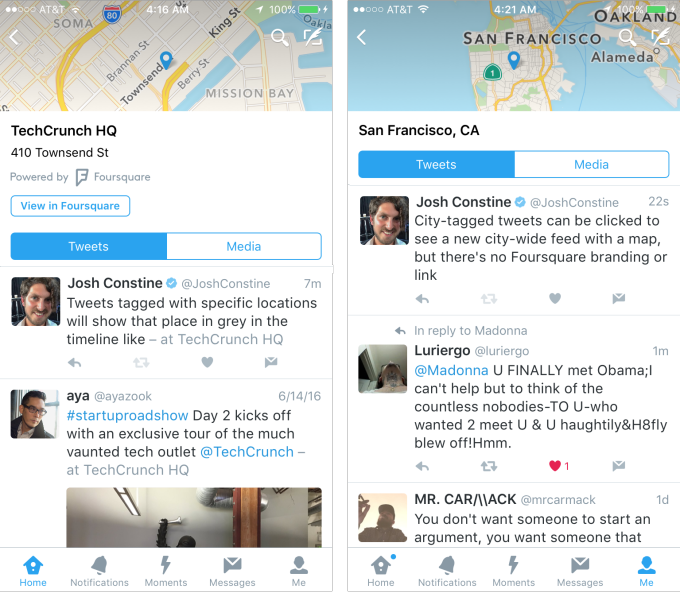
Last year we’ve reported that Twitter had partnered with Foursquare and finally after 15 months we can see the first effects. TechCrunch noticed that Twitter is quietly launching a new feature where users can add specific location information based on places suggested from Foursquare’s database. These geotags are then visible directly on your timeline as people scroll through it. Once you click on a location tag you can view a full location feed of a given venue.

You can see that the cooperation between the two companies is close and beneficial for both parties. Twitter has millions of geographic coordinates from a huge user community but it cannot pinpoint lats and longs to a specific venue. Foursquare which ended up being location intelligence company is an expert in giving a location context to a set of coordinates. Twitter gets access to this knowledge and Fousquare gets a branding, links back, and the access to data to improve its own database. Win win.
Location feeds are being rolled-out country by country on iOS (as the first platform) but the fact that it has not been officially announced suggests that this is only the beginning of the story and indeed we expect much more than that. Adding value to users could inspire more people to share their location and it could be an important part for Twitter’s future revenue stream. It is definitely a step in a right direction!


