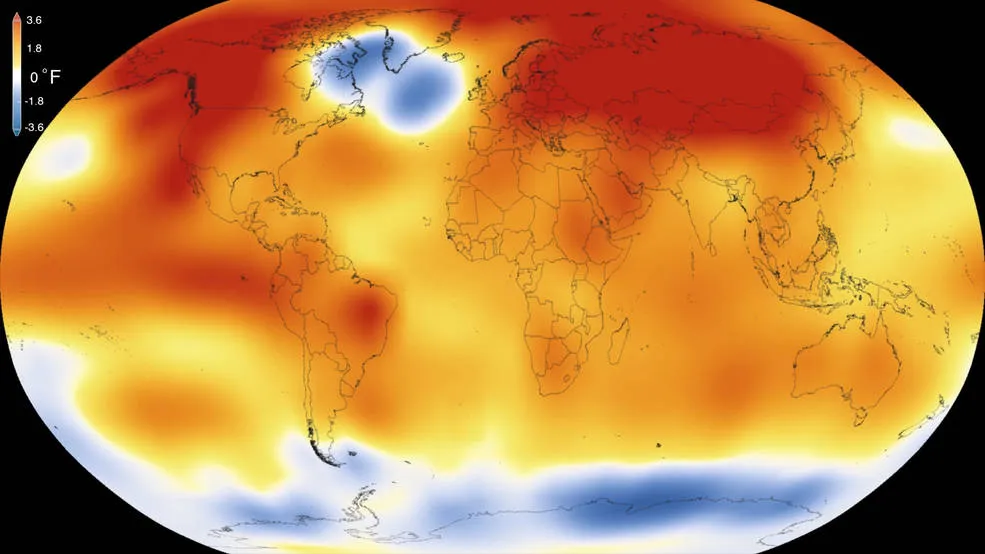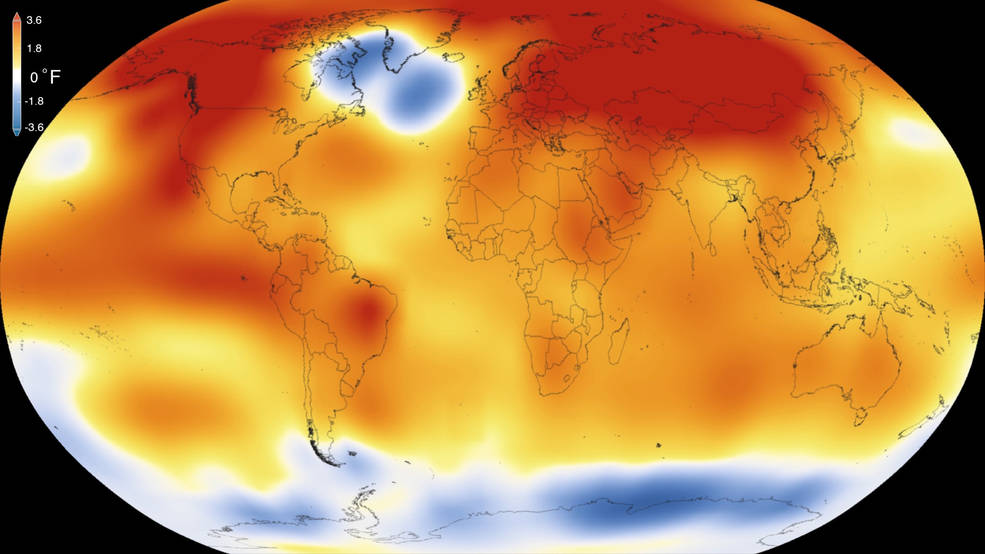
Map showing 135 years of global warming

Last year we’ve reported that 2014 was the warmest year ever recorded. Last week NASA revealed that 2015 was even warmer. Data from NASA and NOAA showed that in 2015, the average temperature across global land and ocean surfaces was 1.62 degrees Fahrenheit (0.90 Celsius) above the 20th century average, surpassing 2014’s record by 0.29 F (0.16 C).
El Niño is partially responsible for the extremely high temperatures recorded around the globe in October, November and December. Still, even before the effects of El Niño were felt, the planet was experiencing considerable temperature anomalies.
The visualisation below shows temperature data between 1880 and 2015.
We can learn from it that most of the warming occurred in the past 35 years, with 15 of the 16 warmest years on record occurring since 2001. Last year was the first time the global average temperatures were 1 degree Celsius or more above the 1880-1899 average.
Climate change. Is it just a temporary situation or a long-term trend? We don’t know yet but it starts to be hard to believe that the global warming is just a myth.


