

Europe’s first satellite for Copernicus (European Earth Observation Program, formerly known as GMES – Global Monitoring for Environment and Security), Sentinel-1A, is almost prepared for its launch on 3 April 2014 at Europe’s Spaceport near Kourou in French Guiana, an overseas department of France. The satellite is going to be carried on a Russian Soyuz rocket, which proofed to be one of the most reliable launchers with more than 1700 performed manned and unmanned missions and is the workhorse of Russia’s space program.
The Sentinel 1 mission of ESA consists of a pair of radar satellites, Sentinel-1A and 1B (to be launched at the beginning of 2015) operating in the name of Copernicus program in order to monitor natural resources and be prepared for disaster response. The radar satellites will scan the Earth’s surface with a C band SAR (synthetic aperture radar) implying a wave length of approximately 6cm, which means that dielectric objects of a size of 6cm or more can be captured. Consequently, clouds can be penetrated by C band radar rendering the Sentinel 1 mission independent of weather conditions, day and night time.
Radar interferometry (information on distance between sensor and surface by extracting phase differences) and polarimetry (validating the backscattered signal) enable a broad use of applications:
Sentinel’s radar will routinely monitor shipping zones, map thickness and types of sea ice, monitor marine environment, provide information on winds and waves for marine traffic, track changes in the way land is being used and monitor subsidence. In crisis situations, it will be used for rapid response to disasters such as floods and earthquakes.
Sentinel-1A satellite will circle the earth at an orbit of 700km passing the poles and therefore generating South-North directed image stripes. Depending on the mode, the satellite will cover a range between 80 and 400km to the side. The four used modi will be (also see figure at the bottom):
1. Strip-Map-Mode: 80 km swath, horizontal resolution of 5m
2. Wide-Swath-Mode: 250 km swath, h. resolution of 5×2 m
3. Extrawide-Swath-Mode: 400 km swath, h. resolution of 20x40m
4. Wave-Mode: sampled images of 20x20km at 100km long orbit alternating into 2 incidence angles, 5x5m resolution (TBC)
The very good news: Sentinel-1 data are going to be publicly available! As far as I know it is the first time that radar data are going to be freely availably!
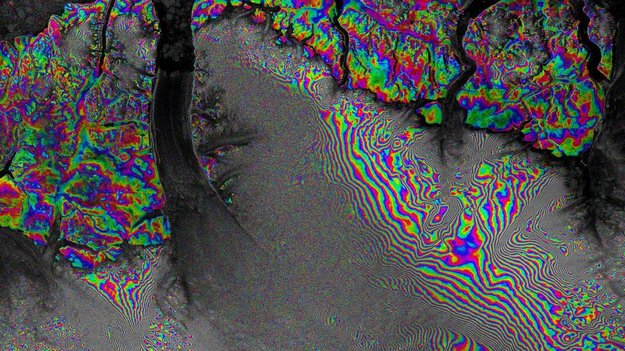
Radar interferometry is powerful to reveal changes of land surface such as subsidence, risings or shifts. The image at hand shows the Petermann Glacier (Greenland) within a time frame of 24 days. The rainbow coloured areas entail zones of subsidence or risings. One colour phase (e.g. from red to red) refers to the absolute number of vertical land surface movement and is half of the radar wave length. Accordingly, the shifts at the middel and bottom right of the image were greater than in the upper or left side. Source: ESA
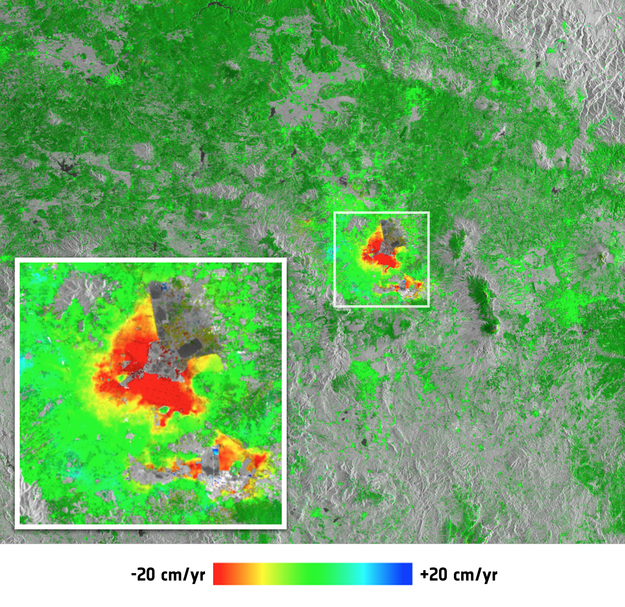
Surface subsidenc in Mexico City. Source: ESA
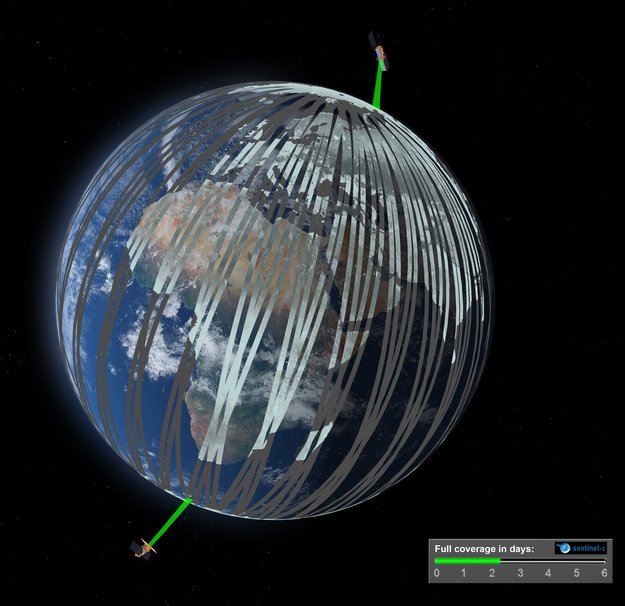
Planned constellation and orbit of Sentinel-1A and 1B: The satellites will pass the poles producing South-North directed image stripes.
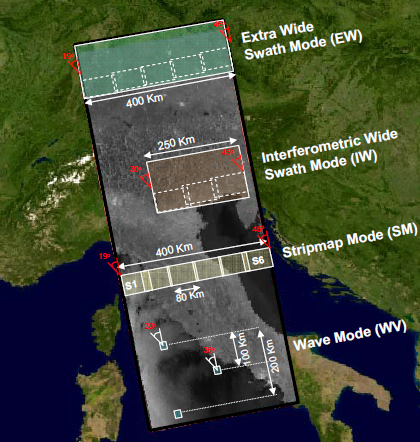
Swath modes of Sentinel-1A and 1B.
Info: ESA
Did you like this post? Read more and subscribe to our monthly newsletter!

#

Next article
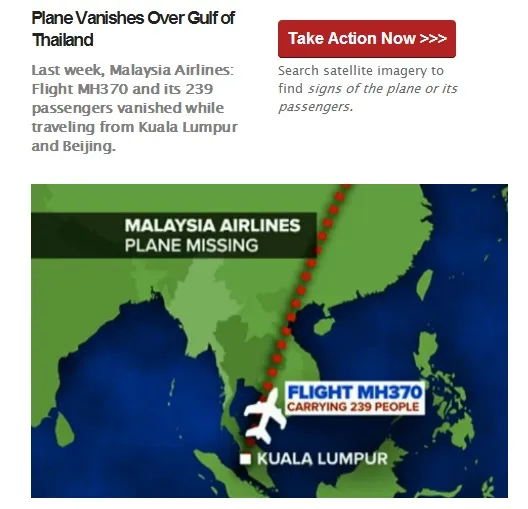

Malaysia Airlines Flight 370, a Boeing 777, mysteriously disappeared on March 8, 2014, while flying from Kuala Lumpur to Beijing with 239 people on board. Recent efforts to locate the aircraft have intensified, with new satellite data and ocean drift analysis guiding the ongoing search operations.
We all are extremely shocked and saddened by seeing a flight vanish. Just like that, it is no where to be found. With all the technology we have, one would definitely expect that there is something that could be done. With 40 ships and 34 aircrafts from nine different countries, we are still not able to locate anything. When we are waiting for someone to do something, here is a chance for us to contribute:

Malaysia Airlines Flight 370 – route
Tomnod is looking for volunteers to contribute their time. Digital globe’s high resolution imageries are one good way to look for any clues, any signs, any debris washing away. When we are talking about thousands and thousands of nautical miles, what is better than having it crowd sourced? Simply tag when you see anything abnormal. Let’s get to work, there is a lot of area to cover. And lot of families and loved ones waiting for an answer…
Did you like this post? Read more and subscribe to our monthly newsletter!

