GOES-R the first of four high advanced weather satellites was launched on November 19, 2016 from Cape Canaveral, Florida. GOES –R, -S, -T and –U will extend the NOAA’s GOES geostationary satellite mission through 2036. After reaching its final orbit at around two weeks, the satellite is going to be renamed to GOES-16, continuing the series of GOES satellites in sequential numbering. GOES-R will become operational only after being calibrated and checked around one year in orbit, when it will begin observing the Western Hemisphere.
What are the highlights of the GOES-R satellite?
- Advanced Baseline Imager: 16 different spectral bands (compared to 5 bands on the current GOES missions) including two visible channels, four near-infrared channels, and ten infrared channels are the primary source for imaging weather, oceans and environment on Earth. – That means a three times greater spectral information, four times greater spatial resolution and five times faster temporal coverage compared to existing GOES missions. Remember that the infrared channels are particularly used to measure cloud properties.
- Extreme Ultraviolet and X-ray Irradiance Sensors: Will monitor solar irradiance in the upper atmosphere and help detecting “solar flares that could interrupt communications and reduce navigational accuracy, affecting satellites, high altitude airlines and power grids on Earth”.
- Geostationary Lightning Mapper: It is a single-channel, near-infrared optical transient sensor that can detect the momentary changes in an optical scene indicating the presence of lightning. The GLM will be the first geostationary lightning mapper and will monitor all types of lightning (in-cloud, cloud-to-cloud and cloud-to-ground) in the American region at a 10km spatial resolution.
- Magnetometer: Will provide measurements of the magnetic field that influences particle dynamics in the outer region of the magnetosphere. – Just think that the Polar Light is a visible phenomenon induced by particles that are deviated by the Earth’s magnetic field. The scope is to provide warnings to customers such as satellite operators and power utilities, for instance in case of magnetic storms.
- Space Environment In-Situ Suite: This instrument contains four sensors that measure proton, electron, and heavy ion fluxes in the magnetosphere. It will assess the risk of electrostatic discharge and radiation hazards to astronauts and satellites. The warnings may also be useful to mitigate damage to radio communication.
- Solar Ultraviolet Imager: It is a telescope that monitors the sun in the extreme ultraviolet wavelength range. The Imager will replace the GOES Solar X-ray Imager and will continue compiling full disk solar images with different spectral coverage and spatial resolution.
Why do we need such a satellite and such sensors?
Generally, the generation of GOES satellites will show an increased performance in terms of spectral and temporal coverage (around five times faster for GEOS-R) and spatial resolution (four times better). The main scope of GOES-R is to enhance the observation and consequently the prediction of local weather situations including thunderstorms, tornadoes, fog, flash floods, and other severe weather events. GOES-R will improve hurricane tracking and intensity forecasts, the prediction and warnings of severe weather, including tornadoes and thunderstorms. Improved rainfall estimates will facilitate more accurate flood warnings. Additionally GOES-R will monitor hazards such as aerosols, dust storms, volcanic eruptions, and forest fires. It is going to provide significantly more data about weather that can be used for meteorology, oceanography, climate monitoring, in-situ data collection, for search and rescue. The enhanced data provision is regarded to be very usefule for remaining resilient to climtic and weather conditions.
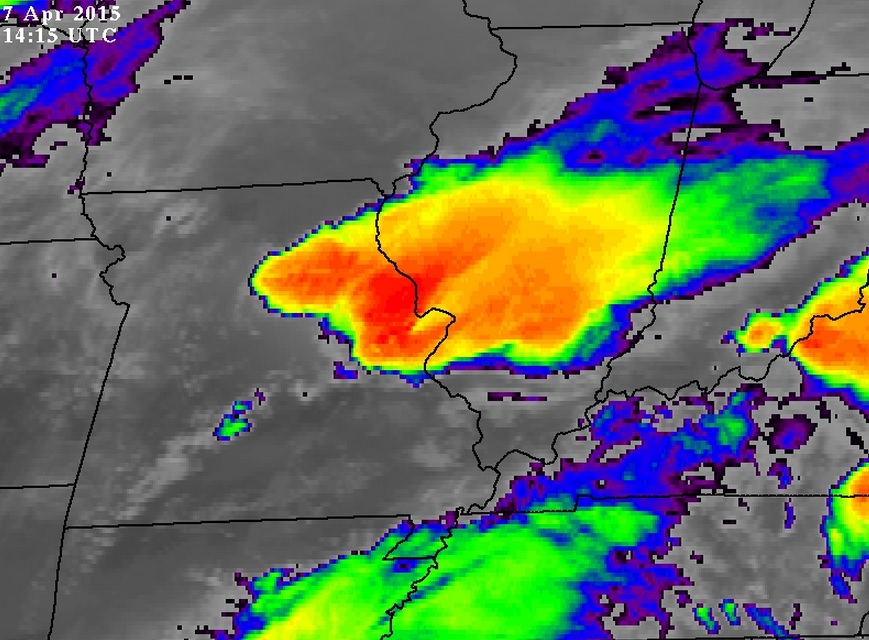
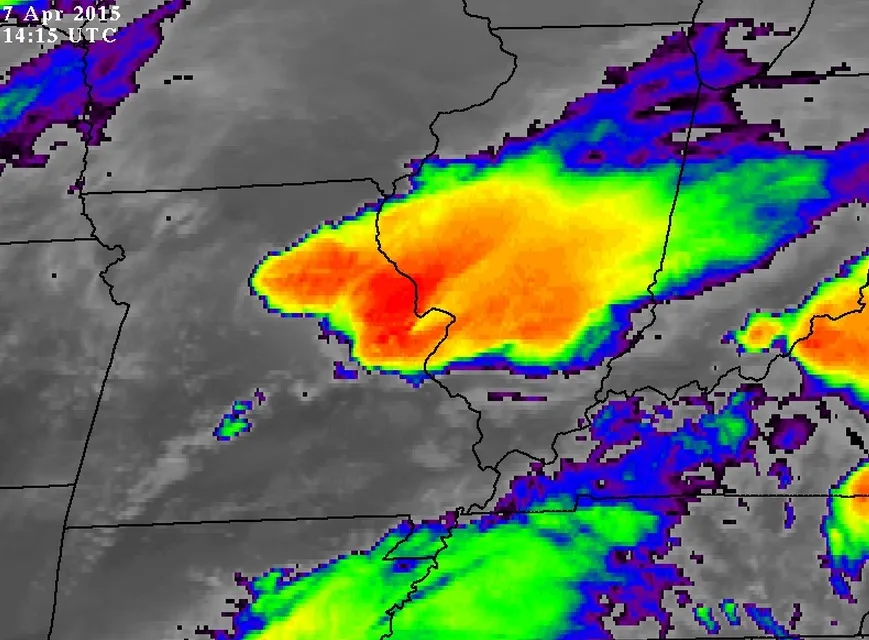
Colorized IR image from a current GOES satellite: Grey indicates warm conditions, blue points to cooler clouds and red colors show the coldest and tallest clouds most likely to produce rain. Source: Earth Science Office
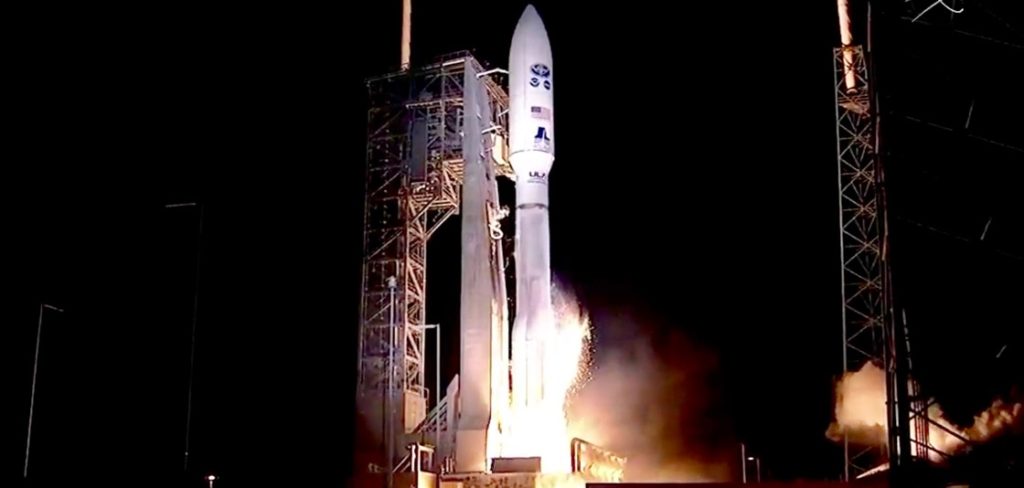
Lauch of GOES-R. Source: NOAA
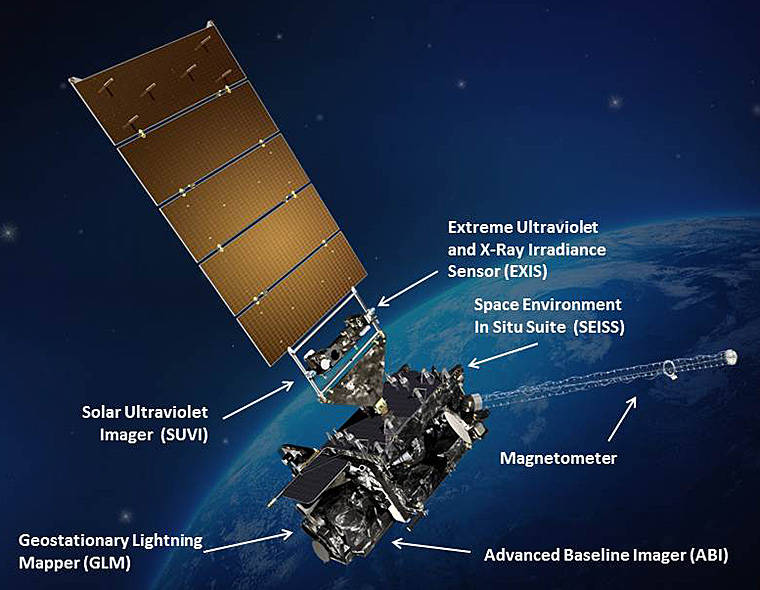
GOES-R with Earth in the background. Source: NASA
Did you like the article? Read more and subscribe to our monthly newsletter!
