In our previous blog post, Geodata for Financial Institutions Part 1, we discussed the difficulty of developing geodata based products and services for new markets that are not necessarily familiar with geodata. We found Financial Institutions (FI) to be an interesting new market for geodata. This blog shows how Satelligence developed a deforestation risk product that is aligned with FI workflows and already used in engaging investees.
Types of Financial Institutions
For this blog, we focus on two types of Financial Institutions:
- Investment Funds
- Asset Managers
Investment Funds raise capital from Asset Managers and other institutional investors (e.g. pension funds and insurance companies) to directly invest (through active, private ownership) in agriculture or forestry companies across the value chain.
Asset Managers raise capital from other institutional (e.g. pension funds and insurance companies) and retail investors (private individuals) to indirectly invest (through public ownership or lending) in agriculture or forestry companies across the value chain.
Financial Institutions, what makes them tick?
To develop a new product for a new market you have to understand the pains and gains of the market, in this case the FI market. What hurts them (pains), like negative publicity from being linked to illegal deforestation, and how money is made (gains), like Return On Investment.
The pains of the FI market are very similar to the pains of the stakeholders in the commodity value chain, consisting of producers, traders, manufacturers and retailers; commodity production linked to illegal deforestation is causing bad PR, loss of important clients and loss of private or public (stock market) value .
But the gains are very different. While stakeholders in a commodity value chain make money directly by handling and selling the commodity in whichever processed form, Financial Institutions make money by profitable handling of money: they invest capital. Asset Managers typically collect cash from different sources (e.g. pension funds, insurance companies and private individuals) and allocate it to different investment categories:
- Bonds
- Equities
- Alternative investments
Bonds, equities, alternative investments
Zooming in on bonds, the worldwide GDP growth is in a downward trend, most likely to continue for the foreseeable future. There is a strong correlation between GDP growth and the returns on government bonds. Hence, it becomes more and more difficult to make money out of bonds.
Therefore, the push to the other two categories, equities and alternative investments, will continue in the mid- to long-term.
If we look at equities, we have seen strong recent peaks in the valuation of listed shares in the last few years. Given that listed shares have become relatively expensive and the worldwide economic outlook is grim, the expected return going forward is (relatively) low. That leaves alternative investments as the most promising option.
Alternative investments are basically an investment in any asset class excluding stocks, bonds, and cash. One of these alternative investments is Agriculture & Forestry with typical annual nominal returns between 6 to 10% (depending on the geography) over the last two decades. Institutional and retail investors are very keen to invest in these assets given the tangible nature, relatively fixed long-term cash flows (from selling crops or timber) and the sustainability angles (e.g. carbon credits). The challenges with these kinds of investments is that they are illiquid (i.e. more difficult to sell quickly compared to e.g. stocks) and only pay off after a certain period (for example a crop has to grow to full maturity before it can be harvested).
What is happening with our investments?
Because of the tangible and long-term profile, Financial Institutions would like to keep track real-time of what is happening with their investments. Such information is not only key for internal (risk) performance evaluation but also external reporting to its clients (institutional and retail investors) on important themes such as deforestation.
Investment Funds have a much more narrowed investment strategy by focussing only on one or a few alternative investment asset classes, such as agriculture and forestry. For internal (risk) performance monitoring and external reporting to clients, real time tracking information on specific themes is key.
In particular, we see a high interest of Investment Funds for specific themes such as land use & restoration, deforestation and carbon (with a total market size of € 35b. Asset managers are mainly interested in the themes of biodiversity, deforestation, carbon and water (with a total market size of € 45b.
From maps to reports
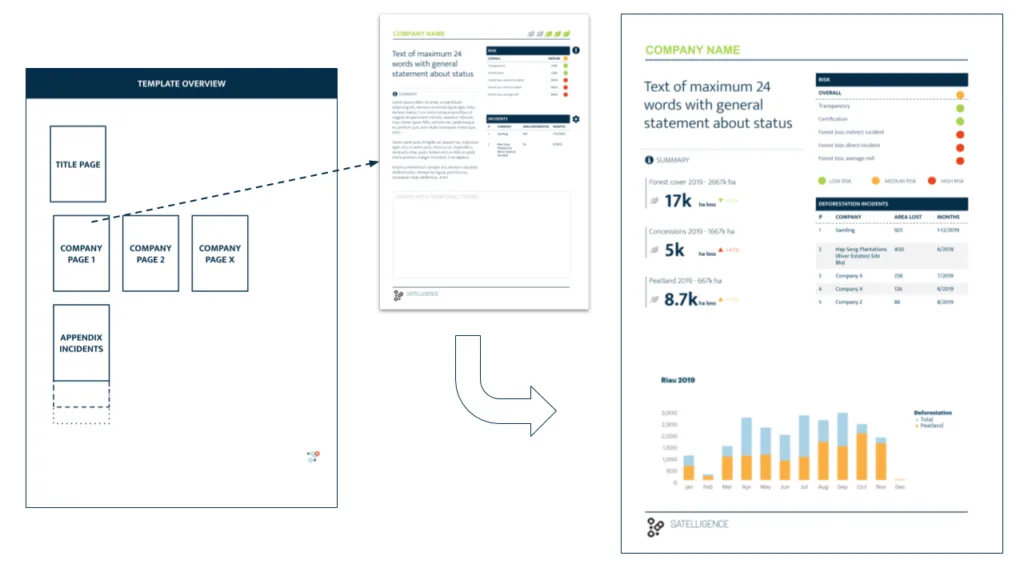
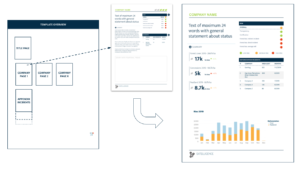
Combining these insights (risk insights in portfolios as well as monitoring assets) with what we do at Satelligence led to the development of concept risk reports that iterated into actionable deforestation risk reports. The data in these reports are exactly the same as the data we present in our online app for supply chain stakeholders. But the perspective (companies) and the way it is presented is different.
The figure below shows an example of one of the iterations of the report. The report is not only based on how we fit our data and technology to the users problem, but also focuses on what and how the user is going to use this report in day to day work; these reports are for example used in bi-weekly portfolio management meetings where companies are screened for risk of being linked to deforestation. If needed, action can be taken to engage such companies and confront them with evidence of illegal deforestation.
Conclusion
By listening to the end user and understanding their context we found that we should build a product that aligns with a financial investment portfolio, of which companies are the building blocks rather than starting from pixels, maps and satellites. Focusing on the whole story, rather than finding a problem to a solution or even stopping at fitting a solution to a problem was key in this process.
Epilogue
The trend of Financial Institutions moving their focus towards sustainable development is not new. And the first initiatives of using alternative data (amongst which geodata) are popping up as well. Those are great trends. At Satelligence we believe an economically sustainable business is an environmentally sustainable business. But we still note a gap between the problem of the market and the solutions service providers offer.
There are two reasons for that gap:
- Solutions are often ‘tools for consultants’ or platforms for data scientists or developers;
- The data sources are either outdated, lacking in quality or not-relevant.
At Satelligence we overcome the ‘building tools & platforms’ flaw by focussing from the very beginning on the workflow and context of the customer: what is the problem and what solution fits best? And then take that one step further: what is the user going to do with our solution? What action will he/she take to get the world one step closer to zero deforestation? If that question cannot be immediately answered, the product is not yet finished.
From satellites to impact
We overcome the low quality geodata by providing first-rate, up-to-date, and relevant information by connecting what happens on the ground (commodity production, illegal deforestation) directly to supply chain models. Our multi-sensor change detection algorithm ensures the highest quality geodata, all the time, anywhere it matters. Processing that data into products that the user understands and, more importantly, uses in their day to day work is key to why our services not only look cool, but are really impactful.
Concluding, with the tailored reporting for Financial Institutions, we developed a product that fits their jargon, world view and day-to-day work. We did that by translating geospatial information into a form that they understand, is easy to read and is actionable.
Did you like the article? Read more and subscribe to our monthly newsletter!
