Adding the Precision in Farming using Remote Sensing

For farmers and land managers, increasing crop yields and reducing costs while minimizing environmental pollution is a constant challenge. To accomplish this goal, many farm managers are looking for new technologies to help them decide when and where to irrigate, fertilize, seed crops, and use herbicides. Using data collected by satellites combined with GIS environments, important agricultural factors like plant health, plant cover and soil moisture can be monitored from space and provide the bigger picture of the land surface that can be combined with other technologies like remote-guided machinery etc., to help reduce costs and increase crop yields.

The long term archiving of Landsat imagery, Copernicus data as well as from local ancillary data (e.g. DEM/DTM, meteorological measurements from ground weather stations, soil fertility measurements, etc.) and yield production datasets gathered in the field by farmers and agronomists present a new opportunity for entrepreneurs and agriculture stakeholders. Using the appropriate data fusion and machine learning techniques, these datasets can allow yield predictions with higher accuracy, spatial and temporal resolution. For example, by using different types of visual data representations (RGB composites, multitemporal NDVI indices), a farm operator can determine the issues affecting their crops and apply appropriate remedies to the affected areas.

Specifically, crop yield monitoring relies primarily on vegetation indices, such as the Normalized Differential Vegetation Index (NDVI), Advanced Vegetation Index (AVI), Normalized Difference Water Index (NDWI) in order to monitor crop phenology. By examining and analyzing multitemporal values of the NDVI indices, it is feasible to monitor the vegetation growth, the fruit/seed status and the maturity of each crop.

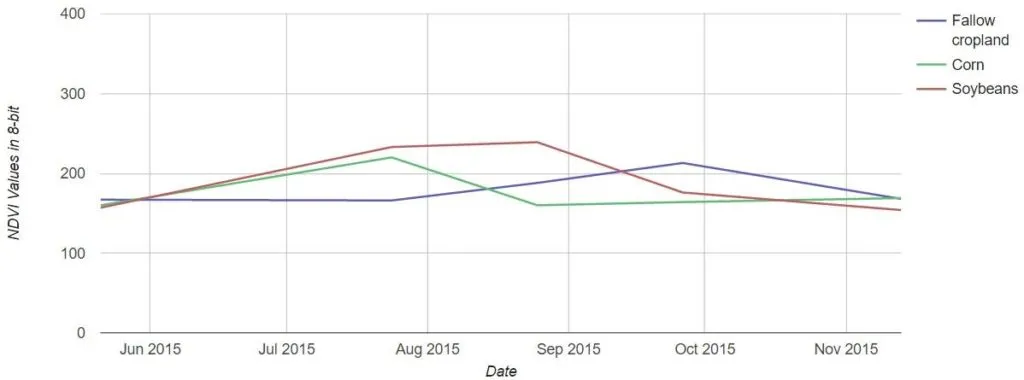
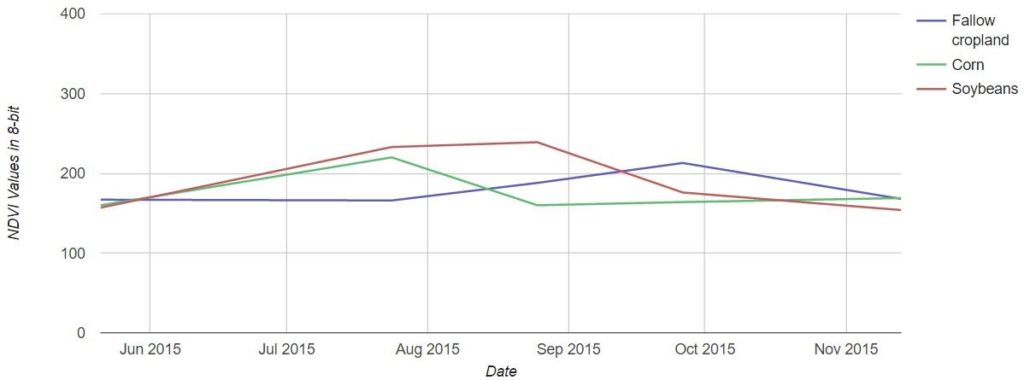
According to the chart below, a multitemporal NDVI analysis was performed using Landsat 8 products from Spaceye Platform, in order to identify the different crop species and study their phenological features in relation to their growth in the region of Illinois USA. We can see that the Soybeans during the summer period are on their highest growth, whereas the Fallow cropland is on its lowest growth. It can also be observed that it is feasible to accurately discriminate all the different types of crops in at least 3 different time periods between the time ranges of 05/2015 to 12/2015.

Precision in Farming - charts

Source: SpaceAnalyer

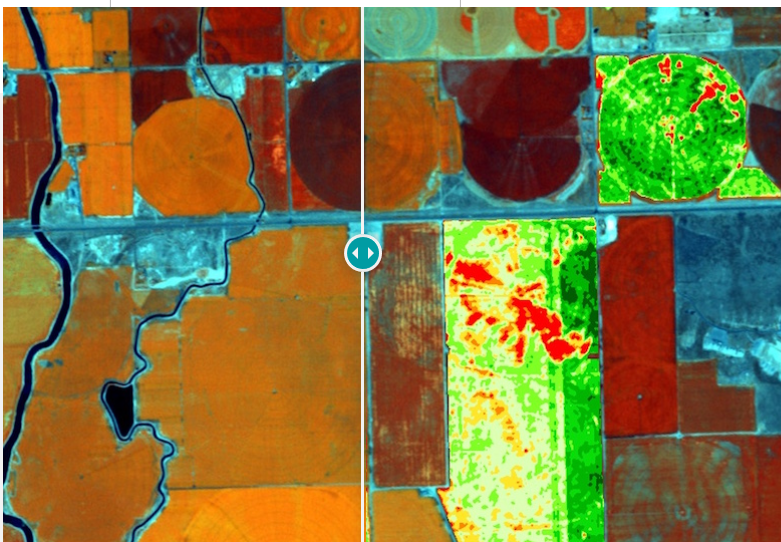
Another use case from Sinergise demonstrating the usage of Sentinel data and NDVI indices in order to monitor the annual changes of agricultural production and vegetation development and health is illustrated below. Specifically, the green colored zones have the most robust and volume of vegetation while the yellow and red zones represent less vegetation. This information can be used to make management decisions on the application of inputs like fertilizer and fungicide.

Precision in Farming - map visualization

Precision farming – spectral imagery Source: Sentinel-hub

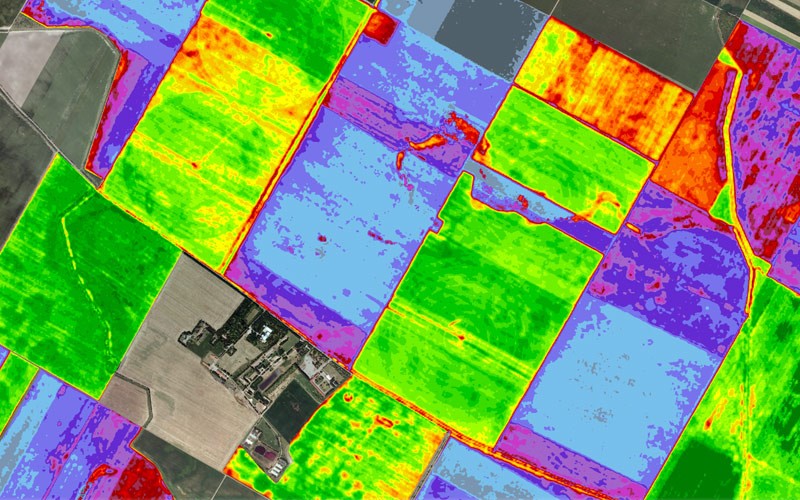
Finally, Planet’s high-frequency imaging satellites deliver a constant stream of current information making possible the multitemporal production of vegetation indices in order calculate the relative chlorophyll content and correlate it with vegetation vigor and productivity. The vegetation index displayed on the image below represents relative chlorophyll content, which correlates with vegetation vigor and productivity. The red tones represent low relative chlorophyll content while the green ones show high relative chlorophyll content.

Precision farming – spectral imagery. Source: Planet Labs

In conclusion, the long archive of Landsat program (dated from 1984) allows us to perform robust time series analysis and examine the crop phenology in order to differentiate specific crop types. In addition, recent freely satellite data from Landsat 8 and Sentinel 2 as well as from Very High Resolution (VHR) satellites give us the ability to provide near real-time estimation of crops health, pinpoint signs of crop stress, monitor vegetation growth as well determine actual rates of evaporation.


Did you like the article about precision farming? Read more and subscribe to our monthly newsletter!

Say thanks for this article (0)
The community is supported by:
Become a sponsor
#
#Agriculture #Construction #Energy #Environmental Protection #ESG #Financial Services #Geospatial for Good #Government #Health Care #Real Estate #Satellite tasking #Transportation
Simplifying the Process of Tasking a Satellite
Avatar for Barry Morisse
Barry Morisse 05.29.2024
AWESOME 5
#Featured #Ground stations #Satellites
Ground Stations Explained: How Does Satellite Data Travel from Space to Earth?
Nikita Marwaha Kraetzig 02.29.2024
AWESOME 9
#Agriculture #Construction #Energy #Environment #Environmental Protection #Financial Services #GeoDev #Government #Humanitarian #Ideas #Natural Resources #Orthorectification #Satellites #Transportation
Why Orthorectification is Key for Real-World Terrain Mapping and How To Use It
Nikita Marwaha Kraetzig 10.14.2024
AWESOME 2
Next article

How Machine Learning is helping Google to enhance wind prediction

When Google first launched its moonshot “Project Loon” to provide internet connectivity to farthest corners of the world by launching dozens of balloons, the thought process was, as one balloon drifted away, another would be ready to take its place. A continuous stream of balloons was to circumnavigate the world on a daily basis. The project which was unofficially started back in 2011 is now much closer to reality than it ever was, all thanks to – Machine Learning! 

Project Loon – Google

Machine Learning for wind prediction

One of the biggest hurdles for the success of Project Loon was the number of balloons Google would have had to launch if they were to maintain internet connectivity over a particular location. Over time, the team behind Project Loon figured that with updates to their navigation technology, they were able to maximize the time a balloon spend over areas internet connectivity was required.

“We wondered, what if instead of circling the world, we could ride these winds in small enough loops to cluster balloons over a single area? Forget a ring around the world – just hang out!” – Project Loon – Improving Navigation

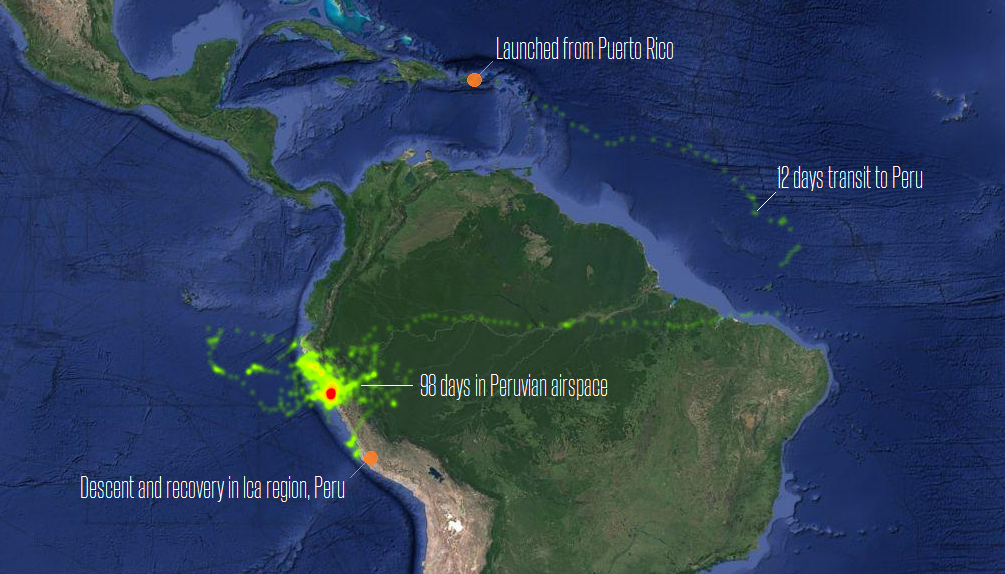
At 20 Kilometers above the Earth’s surface in the Stratosphere where the Ballons are traveling, the winds are stratified with each layer of wind varying in velocity. Google’s team began using predictive models of the winds and decision-making algorithms to move each balloon up or down into a layer of wind blowing in the right direction, to get the Ballons to go where they wanted them to go. Last summer, they put those updates to the test in Peru, managing to keep the balloons drifting within Peruvian airspace for a total of 98 days!

wind prediction with ML

Wind prediction – Flight Path of the Peru test flight – Google

It’s amazing to see how Google’s engineers were able to use Machine Learning algorithms to predict wind patterns with such accuracy. Many weather researchers would love to get their hands on the data and algorithm. Apparently, the navigation system onboard the balloons were able to predict the wind patterns using relatively small amounts of data using an artificial intelligence technique known as Gaussian Processes. (Related: AI Is About to Learn More Like Humans—with a Little Uncertainty)

For now, most of what machine learning can accomplish takes place in the purely digital realm. But as the Project Loon experiment shows, these systems have the potential to play a role not only online but in the physical world, too. And not just with driverless cars. – Wired

It’s true that Machine Learning has largely been used to analyze phenomena that are purely in the digital realm but perhaps the biggest benefits of using Machine Learning will be in the physical world. It will not be long before Machine Learning algorithms are able to predict the weather better than our current systems, helping us farm better and help feed the 7 billion people that call the Earth their home.


Did you like this article about ML and wind prediction? Read more and subscribe to our monthly newsletter!
Read on
Search