Aerosols in Air: Earth science data cubes for determining potential factors engendering aerosols
In this article, we will demonstrate the use of earth observation data cubes for effective monitoring of aerosols. It will also showcase the underlying factors and its possible effects on the environment, therefore highlighting the use of earth observation to mitigate these factors.
Have you have ever wondered the possible reasons behind climate change? Well, there are multiple factors contributing towards it and aerosols are one of them. Now one may wonder what aerosols are: these are tiny, suspended particles in the air which can occur both naturally and anthropogenically. The natural sources include ash from forest fires, airborne salts due to ocean waves, dust particles due to winds and volcanic eruption. On the contrary, burning of crop fields and fossil fuels, vehicle exhaust and industrial pollution are the anthropogenic sources of aerosols. These particles vary in size and shape, nevertheless their presence can reduce the visibility causing haze. They play an important role in climate prediction, therefore the variability in spatio-temporal mapping of optical properties of aerosols is of crucial importance.
Now that we have established the contribution of aerosols, the questions arise that how exactly they contribute to global climate change. Aerosols can contribute in the form of atmospheric climate forcing, air quality degradation, hydrological cycle and precipitation processes. Aerosol particles affect the troposphere directly by scattering and absorbing incoming solar radiation from space. Furthermore, they can also indirectly affect the Earth’s radiation budget by altering cloud microphysical properties. These can include the size of cloud particles, changing reflection and absorption properties of clouds.
So, all we have to do is monitor them, right? For that purpose, the most commonly used instrument is known as Aerosol Robotic NETwork (AERONET) which includes around 200 calibrated sun-photometers installed by NASA across the globe. The direct sun measurements are recorded at 15-min intervals with a 1.2⁰ full field of view at 340, 380, 440, 500, 675, 870, 940, 1020 nm wavelengths. The most comprehensive optical property is the Aerosol Optical Depth (AOD), which is a measure of the amount of light that particles scatter and absorb in the atmosphere (and generally prevent from reaching the surface). AOD of 1 denotes hazy conditions, while an optical depth of less than 0.05 suggests a clear sky with the fewest particles and maximum visibility. Aerosol concentrations are relatively high at optical depths exceeding 2 or 3.

AERONET is a global network of sun photometers that measures aerosols from the ground, such as this station in the Canadian Arctic (top). The Global Hawk Uninhabited Aerial Vehicle (bottom) can carry several instruments to measure aerosols from the air. Photograph by Ovidiu Pancrati, ©2007 CANDAC.
As much as it sounds fancy, this is still not enough to meet the requirements as it gathers point-based information only. So, aerosol monitoring is not a simple task as the optical properties of the generated aerosols differ a lot depending on their origin, and they have very broad spatial and temporal distributions. Although aerosols are generated largely in specific locations, they tend to spread across the globe. As a result, surges of aerosols can enter the atmosphere anywhere on earth, depending upon the climatic conditions of the area.
Since the distribution of aerosols vary in space and time, hence remote sensing based sensors are required for timely monitoring at large scales. Although these ground-based instruments provide continuous information, their spatial coverage is very limited. Therefore, satellite-based data cubes are used for continuous and synoptic view of aerosol concentration. These are called data cubes as they contain continuous data (daily in most cases) and cover the majority of the globe. They also obtain information in various spectral bands, hence this multi-dimensionality of data leads to the naming convention of data cubes.

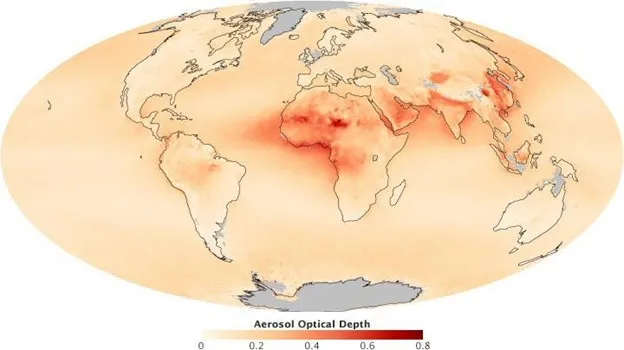
This map shows the average distribution of aerosols from June 2000 through May 2010, measured by the Multi-angle Imaging Spectroradiometer (MISR). Red indicates high concentrations of aerosols, beige indicates low concentrations. (NASA map by Robert Simmon, based on MISR data.)
There are a variety of earth observation satellites that can be used for aerosol monitoring. For example, beginning in the late 1970s, the Advanced Very High Resolution Radiometer (AVHRR), the first satellite instrument capable of crudely monitoring aerosol optical depth from space, recovered optical depth from data in the visible and near-infrared spectra. Using the deep ocean as a background, the passive radiometer AVHRR measured the brightness of sunlight as it reflected off particles.

Satellite instruments such as CALIPSO can measure the distribution of aerosols in a vertical slice of the atmosphere. This image shows a dust plume off the west coast of Africa on April 22, 2010. (NASA image by Jesse Allen and Robert Simmon, based on data from MODIS and CALIPSO.)
More recent radiometers, such the Moderate Resolution Imaging Spectroradiometer (MODIS) and the Multi-angle Imaging Spectroradiometer (MISR), can view aerosols at a greater variety of angles and wavelengths, yielding more accurate data. These datasets can be easily viewed using platforms such as Orbify. One such example can be visualized below.
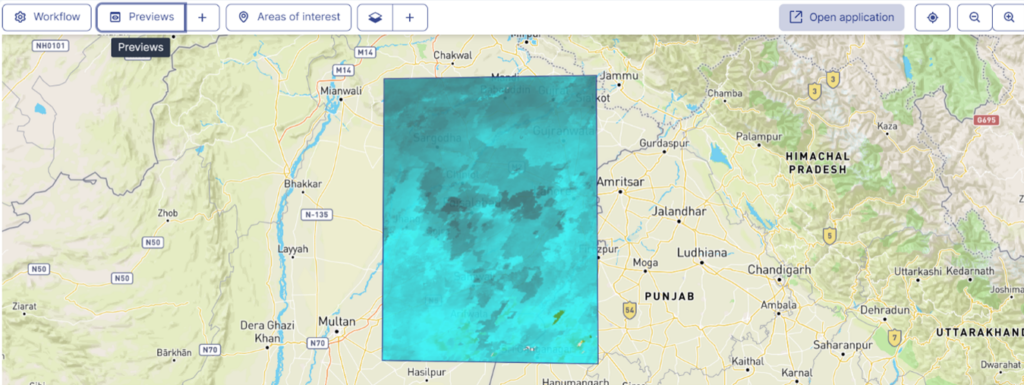
An example showing the interface of Orbify application where users can define their area of interest and visualize the results in a matter of seconds.
The dataset used in this example is of MODIS visualizing the AOD. As mentioned above the larger value of AOD indicates lower number of aerosols in the air. This platform can also be used to perform analysis over different time periods. The figure below shows the AOD levels over Punjab on June 2020, June 2021 and June 2022. As can be clearly seen the results from these three years can be related to the lockdown effects due to COVID. The figure on the left (June 2020) indicates high values of AOD (shown in red) which are increased in June 2021 specially over urban areas. Lastly the figure on the right (June 2022) shows decreased amounts of AOD after life is back to normal as it now includes all sources of traffic and industrial pollution.

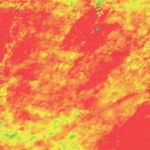
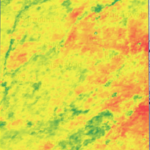
This figure compares the AOD levels over Punjab from a couple months after lockdown in June 2020 (left), a year of lockdown and decreased transportation in June 2021 (middle), after lockdown in June 2022 (right)
Additionally, Orbify can be used to visualize the change in land use and land cover over time to correlate with the changing aerosol concentration over that area. For example, urban expansion might be causing increased aerosols due to vehicle exhaust, hence can be considered as a factor for increased aerosol concentration. Platforms like Orbify can aid in generating applications where users can define a specific study area and generate results with a single click.
Although satellites offer a crucial global viewpoint for comprehending how aerosols affect Earth’s climate, many uncertainties still exist regarding the conflicting effects of aerosols, despite significant advances. Cloud particle measurement is still difficult. It is possible for various particle kinds to group together to create ambiguous hybrids. Variations in humidity or temperature can have a significant impact on the behavior of some aerosols and their interactions with cloud droplets.
Most notably, it is necessary to lessen the quantitative uncertainty in aerosol attributes and quantity. Only better measurements will give scientists the crucial data they need to completely include aerosol influences into climate models and lessen uncertainty about how the climate will change, along with the more complex computer modelling such measurements make feasible.
By monitoring different aerosol optical properties on temporal and spatial fluctuations on both local and global dimensions, remote sensing data are frequently employed to monitor and research the interaction of particles with solar radiation. Due to its extensive spatial and temporal coverage, satellite-based remote sensing enables us to obtain retrievals or measurements at any given spatial position using platforms like Orbify.
Did you like the article? Read more and subscribe to our monthly newsletter!
