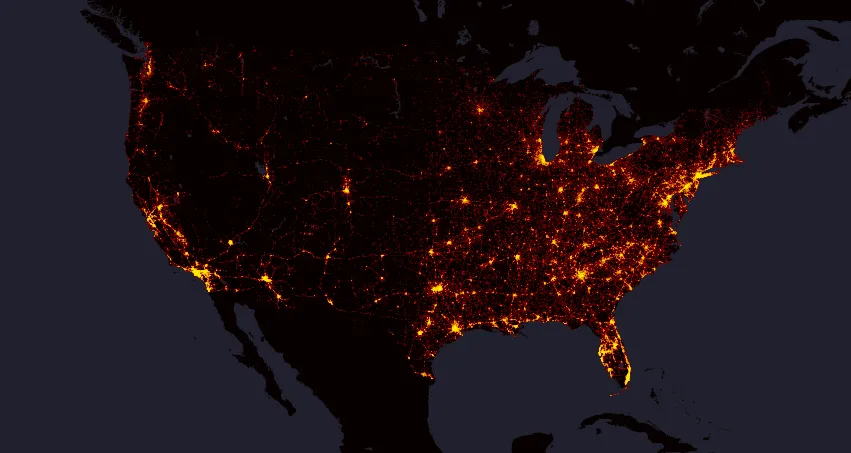
10 years of fatal traffic accidents on a single map
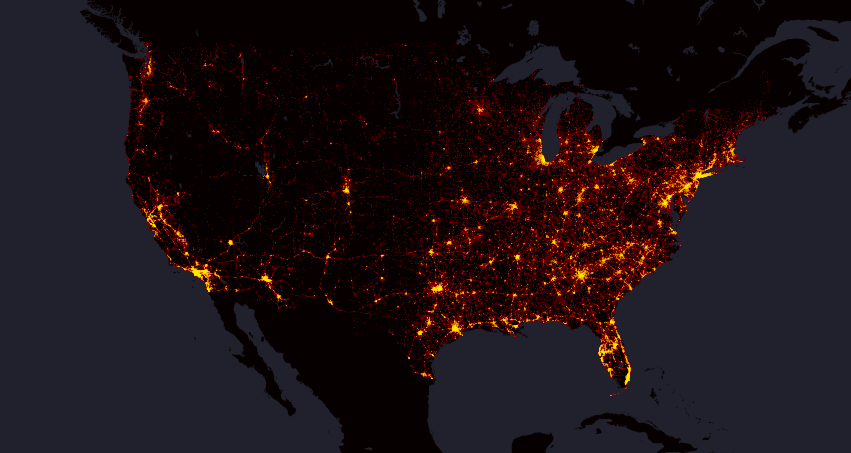
Interesting mapping project shows location of every fatal traffic accident in the US between 2004 and 2013. Based on data from the Department of Transportation’s Fatality Analysis Reporting System (FARS) the map visualizes 373377 data points in total.
The map has been created by Max Galka, a “data cruncher” who cofounded real-estate venture Reevaluate. At the national level the map is similar to any human activity map e.g. Tweets Map by Mapbox.
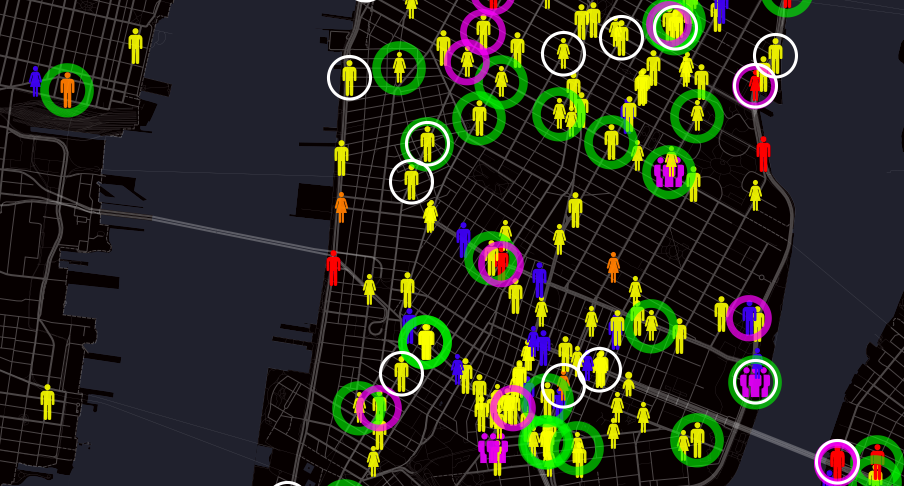
When zoomed in, each icon’s shape and color represent information about a particular victim. Icons represent women, men, and children and different colors identifies whether the person was a driver, a passenger, a pedestrian or a cyclist. Galka also highlights accidents which happened as a result of 3 main fatal accident caused: alcohol, speeding, or distracted driving.
It’s really striking. Check out the interactive map online.


