Why Earth Observation is Drowning in Data but Starving for Decision- Ready Intelligence

The Earth observation (EO) industry is navigating a mid-life crisis of utility. We have more eyes in the sky than ever, yet a persistent gap remains between the data we produce and how it is used in real-world decisions.
The disconnect is structural. Data is still priced and delivered under assumptions of scarcity that no longer reflect current reality. For decades, charging by the square kilometer made sense in a supply-constrained market. That logic is now breaking down.
The shift is already visible in the numbers. The EO sector reached $5.4 billion in 2024, with value-added services growing at 7-8% annually. Growth is shifting downstream, while standalone imagery is becoming less aligned with how the market creates value.
At the same time, the upside remains significant. Industry estimates suggest the total addressable market could nearly double by 2034. But that growth will not come from more satellites alone. It depends on moving beyond raw imagery to interoperable data streams that fit into operational workflows.
This is already reshaping competition. As medium- and high-resolution imagery becomes more widely available, differentiation based purely on spatial resolution or revisit frequency is narrowing. Value is shifting away from the image itself and toward the reliability of the information derived from it.
The Hidden Cost of Inconsistency
The legacy “tasking” model, where a customer pays for a specific capture of a specific coordinate, was designed for reconnaissance. It does not translate well to commercial use. Monitoring supply chains or carbon sequestration at scale requires consistent data over time. A single image is an observation, an anecdote, not a usable signal.
The problem is that imagery is inherently variable. It is shaped by sensor bias, orbital geometry, and atmospheric conditions. When the industry sells images, it transfers the burden of normalization to the customer. At an operational scale, it becomes a constraint.
Variations from atmosphere, illumination, and viewing geometry routinely reach several percentage points in radiometric difference—often rivaling the underlying signal in applications like vegetation monitoring or soil moisture estimation.
The idea of a “geospatial tax”, as described by Marc Prioleau, Executive Director of the Overture Maps Foundation, captures this hidden cost. In many enterprise workflows, preparing data for analysis now rivals or exceeds acquisition costs. When analysts spend 80% of their time on cleaning data, the result is an expensive image rather than decision-ready intelligence.
This friction helps explain why EO has struggled to scale commercially, despite rapid growth in data availability. It also exposes the limits of the legacy “price per square kilometer” model, which assumes that data is a fungible commodity. As multi-sensor datasets are combined and time-series extend, inconsistencies amplify rather than resolve, creating a compounding barrier to entry for non-specialized industries.
Analytics is a Symptom, Not the Solution
As any imagery analyst can attest, two images of the same location are not directly comparable without correction. As time-series grow and datasets from multiple sensors are combined, these inconsistencies build rather than disappear. More data does not solve the problem; it makes it harder to manage.
This matters because the fastest growth in the EO market is happening in analytics and decision-support systems. In sectors such as agriculture, insurance, and energy, imagery is used to feed automated workflows. The requirement is to track change reliably across time.
The industry often presents “analytics as a service” as a move up the value chain. In practice, it is a workaround. Users are not simply outsourcing interpretation, but the burden of making inconsistent data usable.
What appears to be an analytics problem is, in most cases, a data quality problem.
This is why frameworks such as CEOS Analysis Ready Data (ARD) have gained traction. Without radiometric consistency, geometric alignment, and traceability, scaling analytics becomes difficult. Artificial intelligence makes this constraint clearer. Machine learning models depend on stable inputs; when data varies, outputs drift or degrade.
From Imagery to Measurement
The shift underway is from imagery to measurement. Imagery captures how the Earth looks; measurement captures how it changes, and by how much. The distinction matters because measurement requires consistency across time, sensors, and conditions. Delivering that consistency demands system design that prioritizes calibration, signal-to-noise performance, and spectral depth over visual quality.
This shift is also reshaping where value sits in the market. As satellite capacity has expanded, standard optical imagery in the visible spectrum has come under increasing price pressure. What remains differentiated is not simply resolution, but the ability to extract physically meaningful signals.
That is where the “invisible” spectrum becomes critical. Shortwave Infrared (SWIR) and Thermal Infrared (TIR) bands provide direct insight into moisture stress, material properties, and heat signatures that RGB imagery cannot capture.
But accessing these signals requires a level of radiometric precision, calibration stability, and system-level consistency that is difficult to achieve at scale. This creates a meaningful barrier to entry and reinforces the shift toward systems built to produce stable, comparable measurements over time.
This transition is already underway. New orbital architectures are being designed not as imaging platforms, but as measurement systems, built to deliver consistent, analysis-ready data streams for AI-driven workflows and large-scale operations.
Trading Pixels for Proven Signals
As Earth observation becomes embedded in decision-making, its value is no longer defined by how much data is delivered, but how reliably it supports high-consequence outcomes. A $100-million decision does not depend on access to imagery; it depends on the integrity and consistency of the signal behind it.
Revenue models are evolving accordingly, with one-off image sales giving way to subscriptions, APIs, and analytics because imagery no longer functions as the endpoint in operational workflows.
The industry has largely solved for access, but it has not yet solved for trust. Producing consistent, comparable measurements at scale requires calibration, stability, and system-level coordination that are not reflected in legacy pricing models or in systems optimized for collection alone.
The image is no longer the product. The signal is.
Earth observation will transition from a niche data source to an indispensable utility only when measurement, not imagery, defines both the product and the price. Until then, increasing data volumes will continue to outpace the market’s ability to use them reliably.


#Featured


Next article
Mapping the global seabed is essential for understanding our planet and its climate. Yet with roughly 75% of the ocean floor still unmapped, vast areas of our oceans remain largely unexplored.
For everyday life, coastal zones are especially critical. To monitor and anticipate coastal change, we require accurate, large-scale measurements of key parameters such as bathymetry. However, nearly half of the world’s coastal waters remain unsurveyed today.
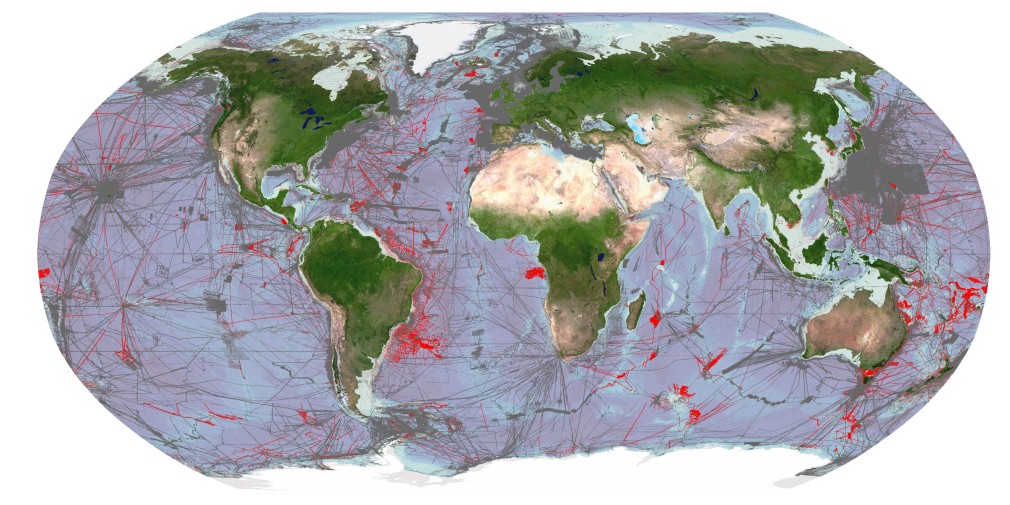
Image showing areas of global seafloor considered to be mapped by General Bathymetric Chart of the Oceans (GEBCO). Grey areas depict coverage of as of 2021, red areas are additions for 2022. Credit: The Nippon Foundation-GEBCO Seabed 2030 Global Center (GDACC) on behalf of Seabed 2030; Source: seabed2030.org
Our vital coastal regions
Shallow coastal waters are home to about 10% of the global population and include many megacities. These low-lying areas are crucial for industrial activities such as maritime navigation, as well as for coastal protection and resource management. At the same time, they are highly dynamic and vulnerable to both natural and human-driven pressures, including erosion, extreme weather, sea-level rise, and demographic shifts. Continuous coastal monitoring is therefore indispensable.
Collecting bathymetric data in shallow waters has long been challenging. Conventional techniques like sonar surveys or airborne LiDAR are expensive, time-intensive, and logistically complex. As a result, data for many coastal regions is either outdated or entirely missing.
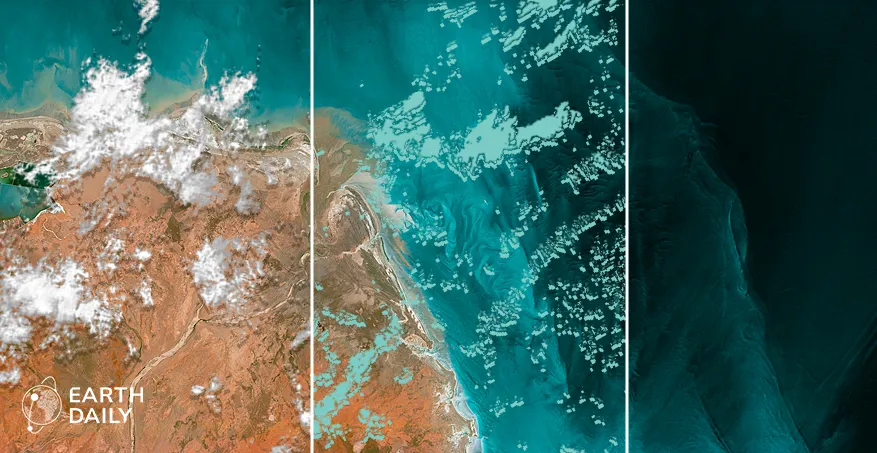
A promising way to close this gap is satellite-derived bathymetry (SDB), which leverages multispectral optical imagery to estimate water depth in nearshore areas.
How does it work?
Satellite data has been used to map the ocean floor for several decades using techniques such as radar altimetry, wave kinematic, and even space-based lasers. Such methods allowed scientists to generate an approximate model of the ocean floor but the resolution of such methods are not enough for shallow waters (down to a depth of 30m).
Satellite-derived bathymetry uses optical image data to try to estimate the depth of the water in a given place. One of the most effective algorithms to do that is called multispectral signal attenuation, which involves analyzing imagery using a combination of spectral bands. As different wavelengths penetrate the water to a greater or lesser degree, the light attenuation can be measured, and elevation ratios are created by analyzing the colour profile and spectral characteristics of coastal areas with known depths. Algorithms are then used to infer water depth from new spectral information by comparing it to known depths of similar areas. With this approach, it is possible to estimate the depth of the water, even down to 30 meters, with a high level of accuracy.
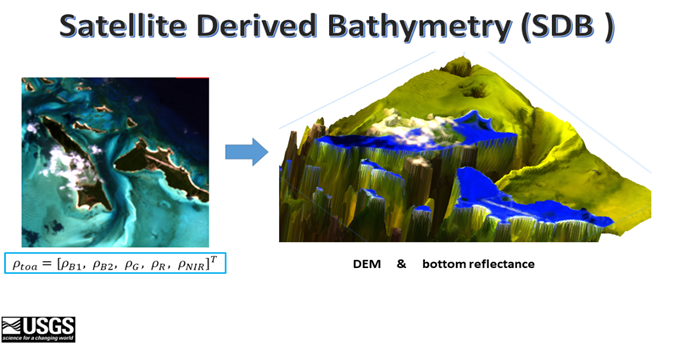
Source: USGS: https://www.usgs.gov/special-topics/coastal-national-elevation-database-%28coned%29-applications-project/science/satellite
The better the resolution and the more spectral bands used in the data, the more accurate the results will be, but even lower resolution data can provide valuable information.
Today, data for SDB is measured from various satellite sources, such as Landsat 8 (NASA), Sentinel-2 (ESA), and Pleiades and Pleiades Neo (Airbus). Pleiades Neo features a new spectral band called deep blue with wavelengths of 400-450 nm, specifically designed for satellite-derived bathymetry and atmospheric corrections. This new spectral band allows for much better interpretation of optical data for shallow waters than previously possible.
What are the benefits of SDB?
SDB is a cost-effective and time-efficient alternative to traditional on-site methods. It doesn’t require ships or human divers, making it a safer method for data collection, and also dramatically reducing the environmental impact caused by more intrusive methods.
Airborne LiDAR bathymetry is another technique to measure the seafloor from the skies. It uses an active sensor which beams a green laser light, as opposed to a passive optical satellite sensor. The use of LiDAR gives higher accuracy than SDB, but at a much higher cost, as it requires dedicated airborne survey and only produces data for a relatively small area. SDB, on the other hand, utilizes existing satellite infrastructure, the images cover a wider area, and data can be captured multiple times a day, meaning it has both repeatability and scalability. It is also time-efficient and can provide near-real time monitoring, making it ideal for regular oceanographic management.
SDB is not without its disadvantages. For instance, it can lack spatial resolution when compared to other methods. Depending on the type of technology used, satellite imagery may be affected by weather conditions, water quality, and the presence of vegetation. It has limited effectiveness in deeper waters. Despite these limitations, SDB is a powerful tool for measuring shallow waters, and can be used very effectively in combination with other methods—above all because the data can be captured with such regularity.
Source: https://business.esa.int/projects/international-satellite-derived-shallow-water-bathymetry-service
Applications of SDB
SDB in coastal regions can play a key role in a variety of practical applications that are essential to our current way of life and preservation of our future.
Bathymetry is an important tool for many industries. In terms of trade and logistics, accurate bathymetric data is essential for ships and port authorities to ensure safe navigation. Sea transportation is an essential component in over 90% of international trade, and the ships used to transport these goods are growing ever bigger. Understanding the shape of the ocean floor is a vital input for models of ocean currents and waves, and therefore bathymetry can help to improve sea-state monitoring, including wave prediction and more. For the telecommunications industry, bathymetry is used to plan the routes of subsea fiber-optic cables, avoiding coral reefs, shipwrecks, sensitive areas and geological obstructions. Around 474 of these cables are responsible for transmitting 99% of international data (according to TeleGeography, 2021).
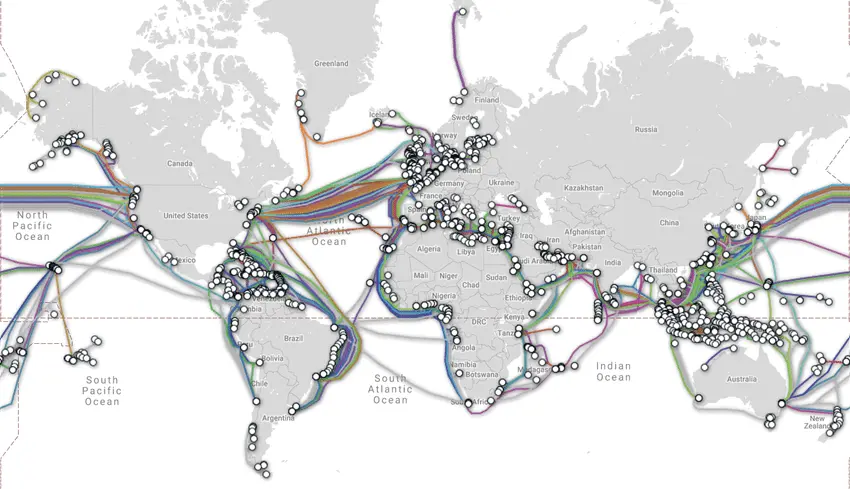
Map of global subsea fiberoptic cables. Source: www.submarinecablemap.com
Energy companies also rely on bathymetry to explore and extract oil and gas, as well as using it to secure new energy resources like wind and ocean energy. It is also used to monitor sedimentary movements in the corridor between the coast and the energy exploitation site to ensure the integrity of cables connecting wind turbines to the shore. These cables are a critical part of the infrastructure for wind energy—which is the fastest growing blue economy sector, as of 2019.
Bathymetry is also used to estimate and control the volume of materials extracted from the seabed and monitor changes caused by dredging activities. Dredging is essential for many industrial and civil engineering applications, but can contribute to coastal erosion and environmental damage if not carefully managed. More broadly, bathymetry is used to better understand coastal erosion caused by both natural and human factors, and can aid in better management of our coasts, including the development of innovative coastal defense systems for risk mitigation and post-crisis analysis.
Accurate and precise knowledge of the seabed is also key in protecting undersea conservation sites and archaeological areas. One way that bathymetry data can help with this is by modelling underwater noise caused by human activity. Furthermore, the technology contributes to food security, helping to identify locations for offshore aquaculture cages, habitat mapping and impact modeling to meet the increasing demand for seafood.
Bathymetry even aids in issues of sovereignty: sovereign waters are defined by the limits of the continental shelf, as dictated by the United Nations Convention on the Law of the Sea (UNCLOS). Bathymetry helps to establish these boundaries and justify the rights of a coastal state to explore (and exploit) its maritime territory.
Satellite-Derived Bathymetry: An essential tool for the future
As climate change intensifies and coastal zones face increasing pressure, monitoring shallow waters is becoming more critical than ever. Satellite-derived bathymetry is emerging as a key instrument for hydrographers and coastal managers as the technology advances.
Its strengths—remote deployment, cost efficiency, safety, scalability, and minimal environmental impact—make SDB a compelling alternative to conventional surveys. Although accuracy and depth limitations remain, ongoing innovation promises substantial improvements.
The rise of affordable small satellites and expanded spectral capabilities—such as Pléiades Neo’s Deep Blue band—are accelerating SDB’s development. Future integration with computer vision and deep learning models is likely to further enhance performance.
With its ability to monitor coastal waters remotely, efficiently, and at scale, SDB is set to become a cornerstone technology for understanding and managing one of our planet’s most vital and vulnerable environments.
Did you like this post? Follow us on our social media channels!
Read more and subscribe to our monthly newsletter!

