Researchers from the Graduate Center at the City University of New York decided to analyze geotagged Instagram photos taken in Manhattan in the search of inequalities within the city. In their project called Inequaligram they’ve analyzed location of 7.5 million publicly shared photos between March and July 2014. Researchers divided the photos into two groups: those taken by visitors—assumed tourists— and those snapped by New Yorkers.

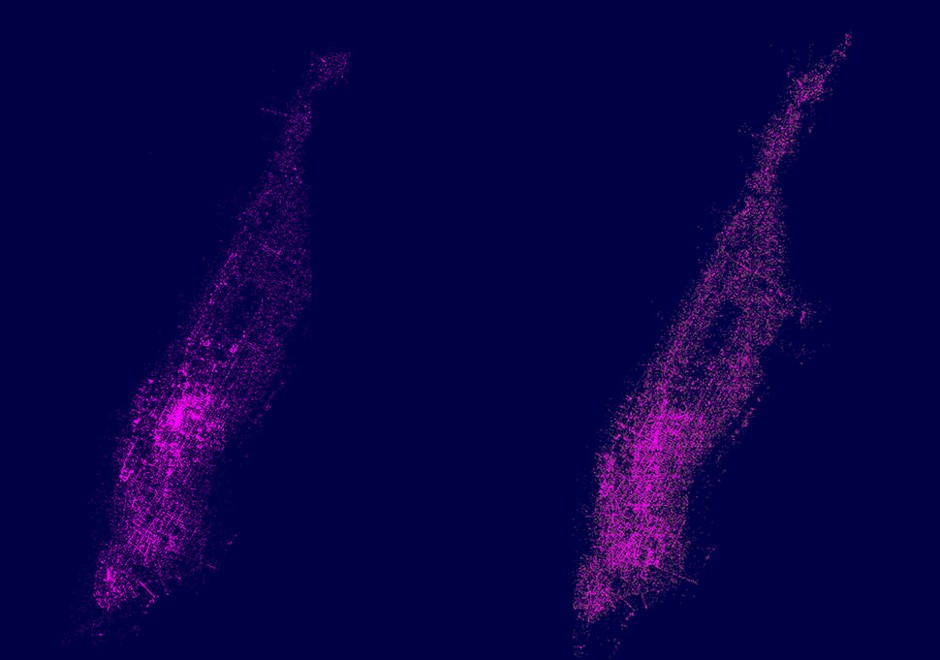
Distribution of photos shared by visitor (left) and locals (right).
The map reveals that images shared by visitors are heavily concentrated in midtown with a few just a few areas downtown that also received attention. Everything above 110th street is almost invisible. Images shared by locals are more evenly distributed around the city with more areas visible and no very heavy hotspots. What is however clear is that areas above 110th street are also less tractive to share among New Yorkers.
To measure social media inequality, the researchers used the Gini index which is the standard measure of inequality adopted for example in economics to analyze income or wealth inequalities. Gini indexes for numbers of images shared on Instagram in Manhattan is 0.494 by locals versus 0.669 by visitors. We need to take into account that according to U.S. Census Bureau, there were 1,636,268 people residing in Manhattan compared to 56.4 million people visited New York City in 2015.
The method, although a bit controversial when it comes to measuring the inequality itself, can give an idea of how people feel about certain areas of the city. This can help city planners and businesses to make better decisions and shape their strategy based on measurable spatial data. Cool project!
Check out other project that analyzes locations of Flickr photos around the world.


 The change coincided with another unpopular decisions. Niantic decided to get rid of the partly broken tracking feature that players used to find out the approximate distance to nearby monsters. The company also killed the apps’ battery-saving mode on iOS. All these decisions have angered and upset Pokémon Go fans around the world. It doesn’t mean that the app features won’t come back in a better and improved form but today you’ll have to live without them.