
Every map tells a story, but only if it knows where it is. Coordinate systems are the framework that makes spatial data meaningful. They allow satellites to position a ship in the middle of the Pacific, help surveyors align construction plans, and enable global companies to run location-based services at a planetary scale. Without them, spatial data is just a scattered set of numbers.
This article explores the foundations of coordinate reference systems (CRSs), the technologies that support them, and the growing ecosystem of organizations, tools, and portals that keep the world aligned.
What Is a Coordinate Reference System?
A coordinate reference system defines how locations on Earth are measured, represented, and stored. It encodes mathematical rules so that latitude/longitude values correspond to real-world points, or planar grid coordinates reliably map to the same ground location every time.
The global registry of such definitions is maintained via the EPSG Geodetic Parameter Dataset, widely used in GIS software as the source of canonical CRS definitions including datums, ellipsoids, and transformation parameters.
The Globe vs. the Map Sheet
A helpful analogy is the difference between a globe and a paper map. The globe represents Earth’s true shape. A map sheet is a flattened version created for convenience. Both describe the same world, but they follow different mathematical rules.
A coordinate reference system ties those two representations together so that data captured on a curved planet can be used on flat screens, printed plans, navigation devices, and analysis tools.
GCS vs. PCS: Why Both Exist
CRSs generally fall into two categories: Geographic Coordinate Systems (GCSs) and Projected Coordinate Systems (PCSs). Understanding why both exist helps explain many of the everyday challenges geospatial professionals face.
Geographic Coordinate Systems
These use angular measurements (latitude and longitude) to describe positions on the Earth’s surface. When navigation apps or global datasets reference “WGS84,” they mean a geographic system based on a mathematical ellipsoid that approximates Earth’s shape.
A GCS is ideal for global datasets, satellite imagery, and any workflow where distortions must be minimal over long distances.
Projected Coordinate Systems
A PCS translates the Earth’s curved surface into planar coordinates, usually in meters. This makes it easier to measure distances, calculate areas, and work with engineering or planning applications that demand precision in the local context.
Examples include UTM zones, British National Grid, State Plane systems in the United States, and national grids used by many surveying agencies.
Why We Need Both
Sometimes you need the “big picture,” such as tracking flights or modeling climate patterns. Other times, you need precise, flat measurements for infrastructure, construction, or utilities. CRSs bridge these two modes of mapping, allowing datasets to move between global and local needs without losing meaning.
Datums and Ellipsoids: WGS84, NAD83, and Friends
A datum defines the origin and orientation of a coordinate system. It answers questions like: Where is Earth’s “zero point”? How is the ellipsoid positioned relative to the planet’s geoid?
Most CRSs rely on a datum paired with an ellipsoid: a smooth mathematical surface that approximates Earth’s slightly flattened shape.
Well-Known Datums
- WGS84 – The global standard used by GPS, satellites, and most international datasets.
- NAD83 – Widely used in North America, especially for engineering, utilities, and surveying.
- ETRS89 – The reference frame for Europe, stable relative to the Eurasian tectonic plate.
- GDA2020 – Australia’s updated datum aligned with modern satellite positioning.
EPSG Codes and Tools
The geospatial community relies on EPSG codes, a standardized catalog of CRSs maintained through a global registry. Codes like EPSG:4326 (WGS84) or EPSG:3857 (Web Mercator) act as shorthand for complex definitions. Modern coordinate systems are supported by an ecosystem of open and commercial tools:
EPSG.io – A search portal for finding CRSs by region, keyword, or code.
PROJ – A widely used open-source library for performing coordinate transformations.
GDAL – A foundational toolset that applies CRS definitions to geospatial datasets.
QGIS, ArcGIS, PostGIS – Platforms that consume and manage CRS definitions for analysis.
Global Companies and Their Role in Keeping Coordinate Systems Modern
A growing number of global companies influence how CRSs evolve and how they are used at scale. These organizations not only consume CRSs; they also help shape best practices, support open standards, and develop new approaches for global-scale spatial alignment.
- Google, Apple, and Microsoft rely on global coordinate standards for routing, geocoding, and 3D mapping.
- Esri and Hexagon integrate CRS tools deep into enterprise GIS systems.
- OpenStreetMap depends on consistent coordinate alignment to crowdsource global mapping.
- Airbus, Maxar/Vantor, Planet, and Satellogic produce massive volumes of Earth observation imagery that rely on accurate CRSs for stitching, calibration, and downstream analytics.
- Mapbox, CARTO, and Safe Software offer location platforms that automatically handle CRS transformations for developers.
Unique and Unusual Coordinate Systems
Most people know global and national CRSs, but a few unusual or niche systems highlight the diversity of mapping:
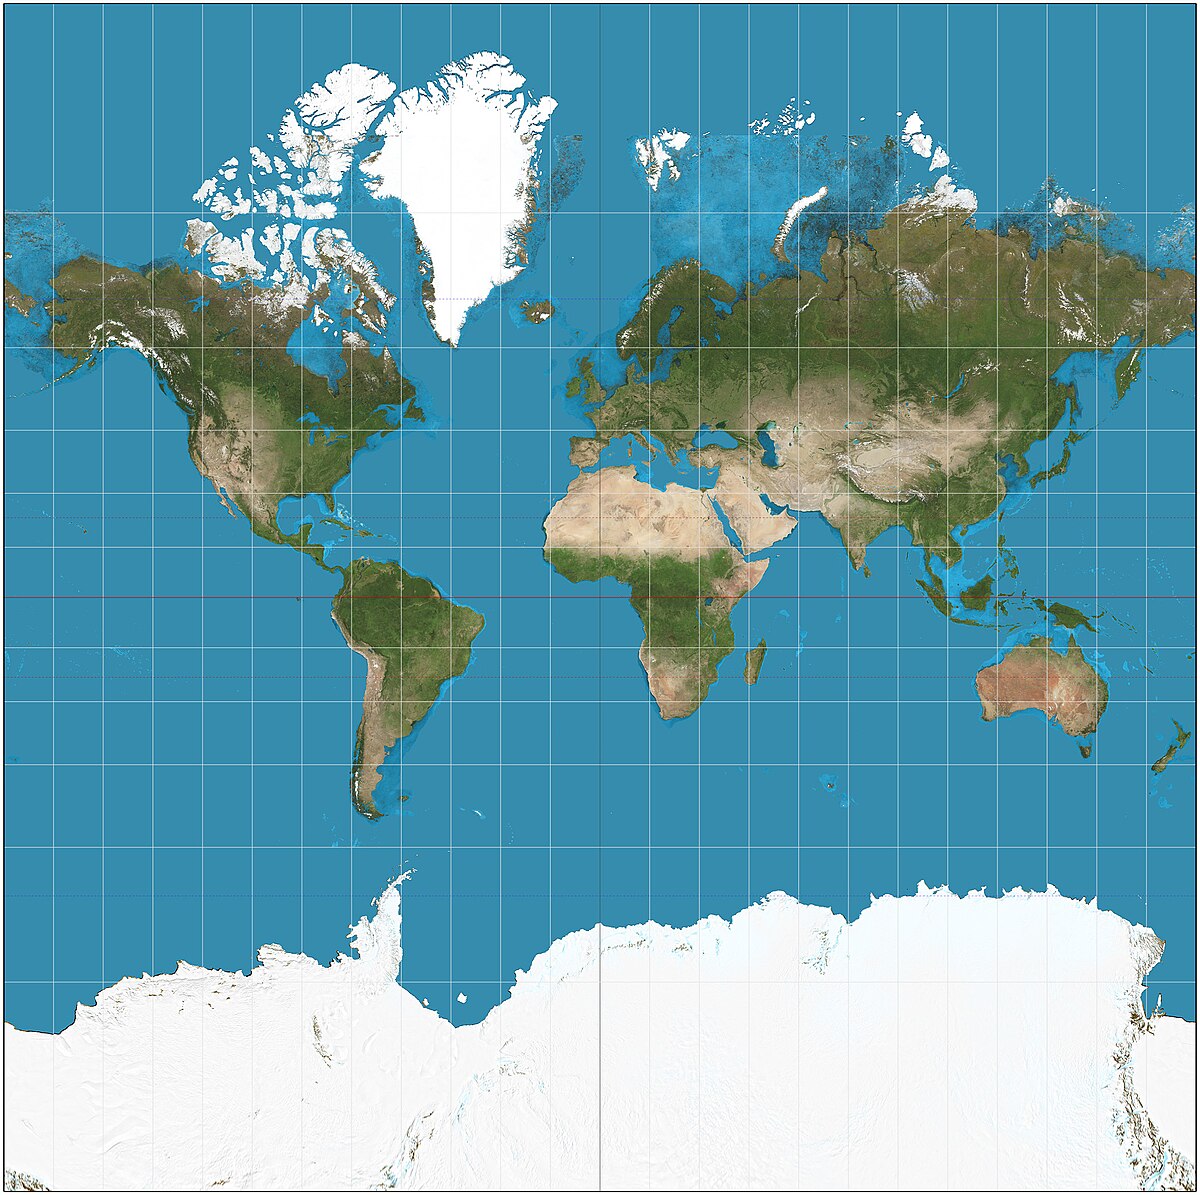
Web Mercator (EPSG:3857) – A distorted projection used by almost every web map. It looks familiar but inflates areas near the poles, making Greenland appear larger than Africa.
GCJ-02 and BD-09 (China) – Encrypted coordinate systems required for commercial mapping, introducing offsets from WGS84.
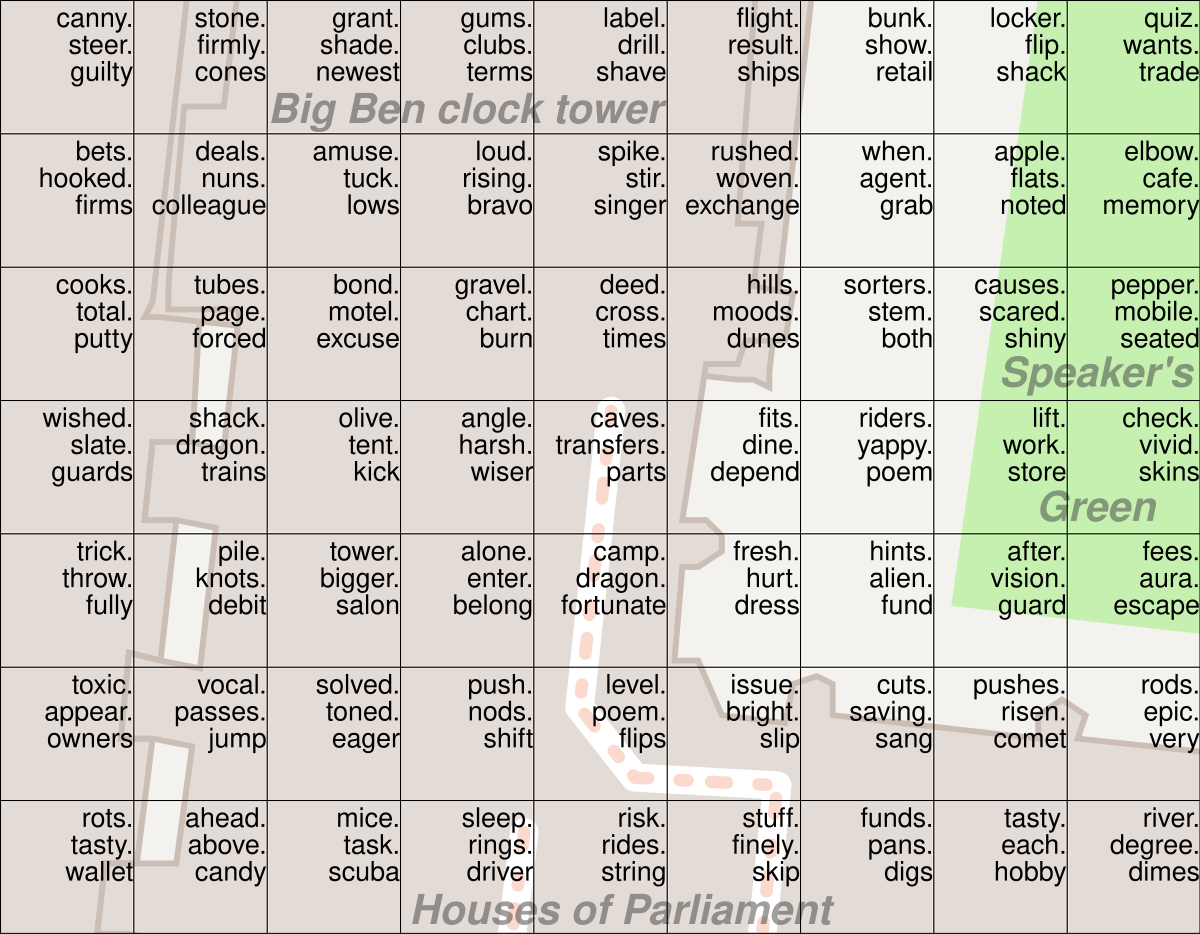
What3Words – Converts the planet into 3-meter squares labeled with unique three-word combinations.
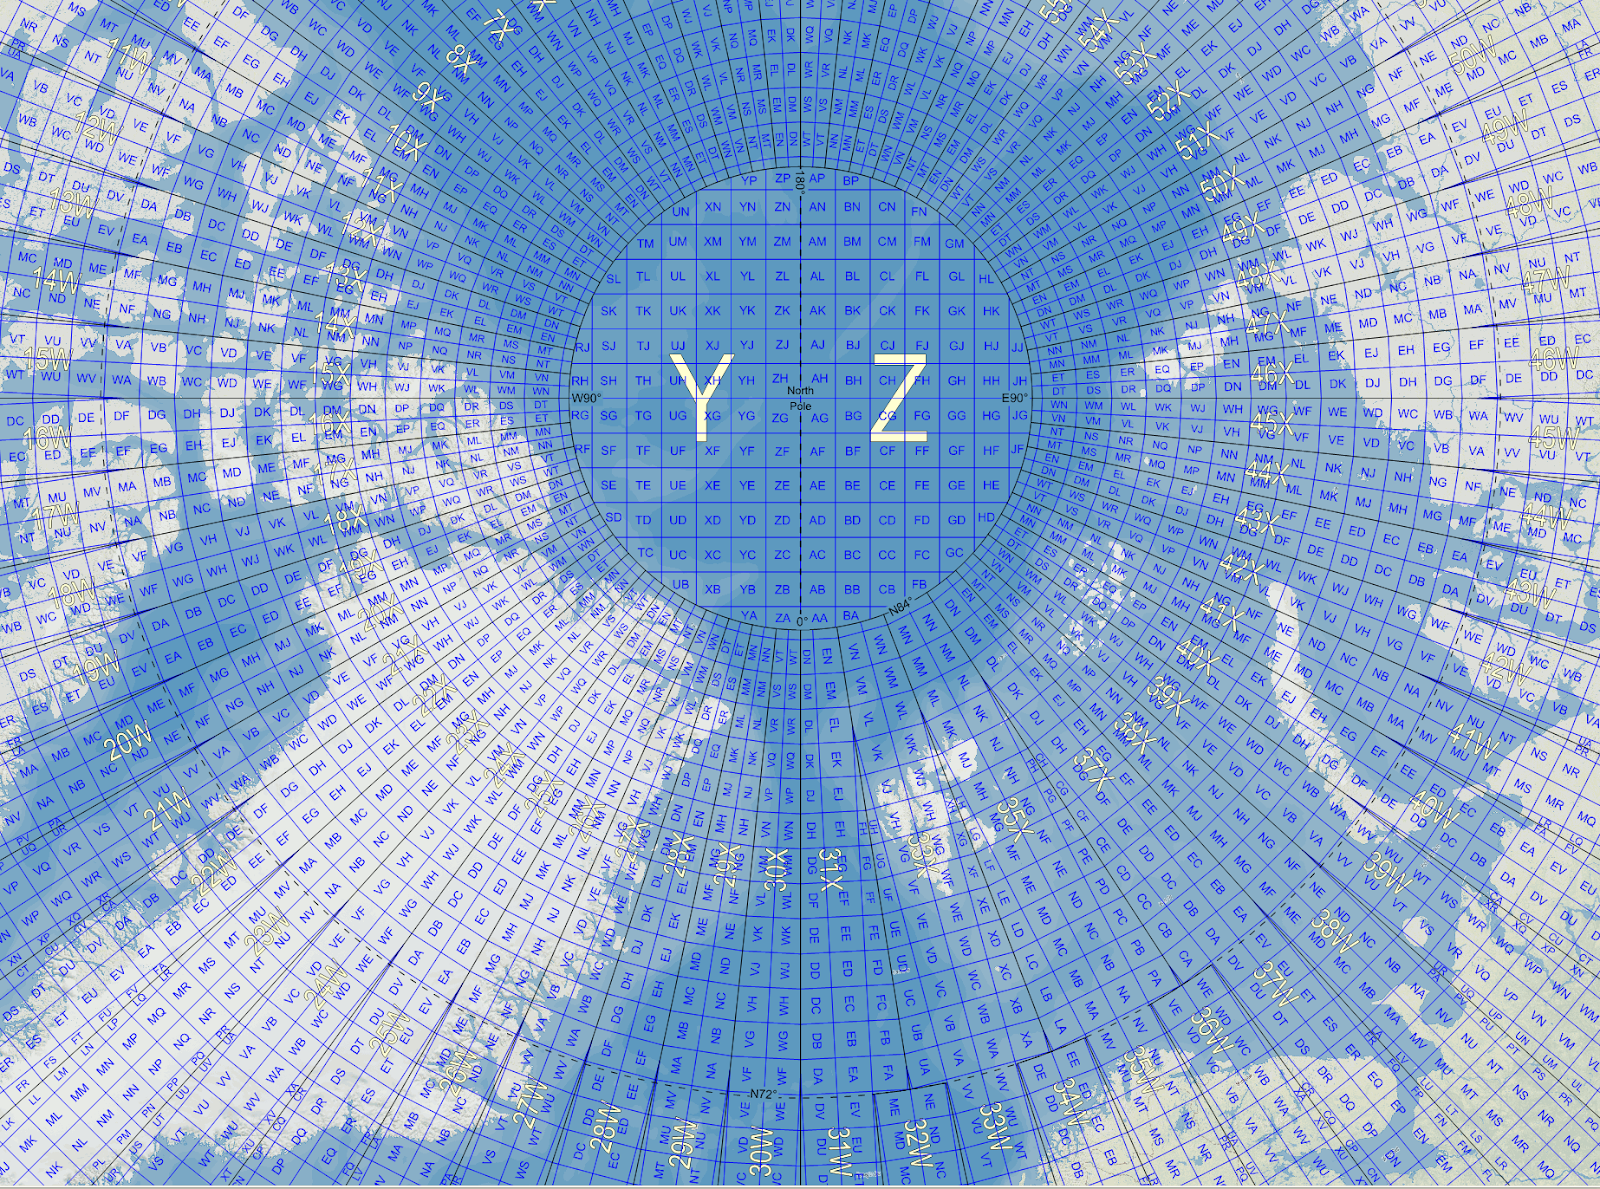
Military Grid Reference System (MGRS) – A global alphanumeric grid used in defense and emergency response.
These systems show how coordinate design reflects political, technical, and cultural choices.
Where the Field Is Heading
Modern coordinate systems are becoming more dynamic, more automated, and better suited to an Earth that is constantly moving.
Two major trends are shaping the future:
- Dynamic datums – Instead of fixed frames, next-generation CRSs can shift over time to reflect tectonic movement. Agencies in Australia, New Zealand, and the U.S. are already preparing for broader adoption.
- Real-time transformations – Cloud mapping platforms increasingly apply CRS transformations automatically, allowing users to work across regions and systems without manual intervention.
In parallel, global companies are standardizing pipelines that integrate satellite data, sensor networks, and AI, creating spatial frameworks that operate at a massive scale.
Interactive Resources:
For readers who want to experiment with map projections, the D3 Geo collection on Observable offers live notebooks that demonstrate everything from Mercator to Orthographic, with sliders for rotation, scale, and translation. These notebooks are fully interactive and allow you to visualize distortions and projection behavior in real time.
Coordinate systems are the invisible architecture of the geospatial world. They ensure datasets align, maps remain consistent, and decisions can be trusted. CRSs play a role in modeling cities, planning infrastructure, analyzing climate trends, and building global mapping platforms. Understanding how they work and selecting the right one for each task is one of the most valuable skills in geospatial practice today.
Related resources:
Geo‑Projections.com – interactive projection reference and demos
Did you like this post? Read more and subscribe to our monthly newsletter!


#GeoDev

Next article
Why 3D Gaussian Splatting Matters for Mapping, Planning, and Simulation
Cities, drones, and mapping teams now capture huge volumes of high-resolution imagery every day. Turning all of that into smooth, interactive 3D scenes is increasingly difficult, while planners, engineers, and surveyors expect fast updates and real-time tools. This demand keeps growing, supported by a geospatial analytics market projected to reach 118 billion USD by 2032 and a wider geospatial solutions market moving toward over 2 trillion USD by 2034.
Traditional 3D reconstruction pipelines struggle to keep up because they are slow to generate and often heavy to render. This gap has created interest in 3D Gaussian Splatting (3DGS), a technique that offers fast, clean, and highly interactive 3D views of real-world places. It is now used across digital twins, drone mapping, and immersive applications.
This article covers what 3D Gaussian Splatting is, why it matters, how it compares to other techniques, and its limitations
How Gaussian Splatting Really Works
Although the name sounds technical, the idea is easy to grasp. Think of a 3D scene built from millions of soft little blobs. Each blob has a position, a color, and a shape. When you blend them all, you get a smooth and detailed representation of the world.
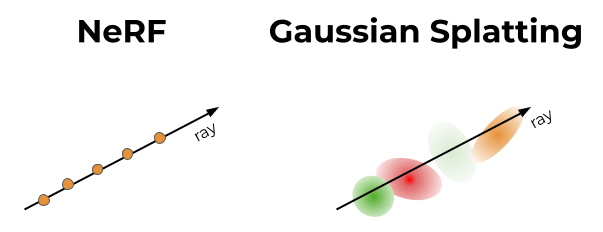
These blobs are called Gaussians. They behave like tiny flexible dots that carry local information about the surface. Instead of stitching triangles like a mesh or training a big AI network like Neural Radiance Field(NeRF), the model builds the world out of overlapping splats.
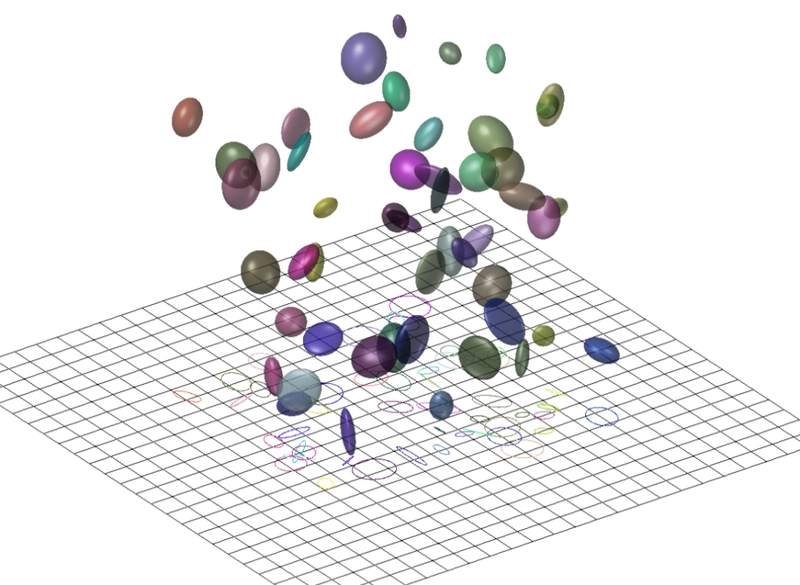
Representation of Gaussians in 3D. Source: Case Studies in Hightopo 3D and Gaussian Splatting
The process begins familiarly. You start with a set of images. Structure from Motion (photogrammetric algorithm) produces a sparse point cloud. Each point becomes the center of one Gaussian (read more here). The system then optimizes the blobs so they match the input photos from every angle. The optimization uses simple techniques like gradient descent, which keeps the pipeline manageable.
Source: Case Studies in Hightopo 3D and Gaussian Splatting
The real benefit comes from how the scene is rendered. Instead of ray marching through a neural field, 3DGS projects all Gaussians into the camera view and blends them. This technique aligns well with how modern GPUs work. Researchers demonstrated this in efficient rendering studies. The result feels similar to viewing a point cloud, but much smoother and far more photorealistic. Its accuracy is measurable because each splat has a precise 3D position that can be compared with GCPs, photogrammetric point clouds, or LiDAR.
Why It Matters for Geospatial Applications
Gaussian Splatting stands out in geospatial work because it delivers smooth, real-time performance that traditional photogrammetry and NeRF-based methods struggle to match. Since splats are rendered through a GPU-friendly process, navigation feels instant and interactive. This makes it easier to walk through drone surveys, inspect reconstruction outputs, or explore city models without the slowdowns common in older pipelines. Studies on real-time reconstruction highlight how this speed helps VR and planning environments where fluid motion is essential.
Another advantage is its ability to preserve complex or thin structures. Classic mesh algorithms often break on cables, railings, scaffolding, and crane jibs, which leads to missing or distorted geometry. Gaussian Splatting adapts better because it models each part of the scene as a flexible splat that aligns with local details. This results in cleaner and more reliable outputs, especially in industrial or construction settings. Examples from PIX4Dcloud show how splatting preserves elements that photogrammetry often struggles with, which helps inspections, documentation, and QA checks.
The method also fits well with dense drone imagery, which many survey teams already collect. With good overlap, splatting produces stable models quickly, reducing the time between capture and review in construction and planning. Comparisons in this photogrammetry overview show how splatting offers a more interactive viewing experience while still maintaining high fidelity.
Comparison with Existing Techniques
Point-based methods
Point clouds preserve raw measurements but lack smoothness, often causing flicker and noise. Gaussian Splatting extends the idea of point clouds by adding volume and color structure while blending smoothly, producing a cleaner and more stable viewing experience. Several comparisons show the limitations of raw point clouds for visualization.
Mesh reconstruction
Meshes remain essential for GIS analysis, urban modeling, and CAD workflows because they offer explicit surfaces that support measurements and editing. Gaussian Splatting does not replace that. It lacks well-defined geometry, a limitation highlighted in earlier mesh comparisons, so splat-based models are best used for visualization rather than technical operations that require topological accuracy.
Neural Radiance Fields
Neural Radiance Fields (NeRFs) gained attention for generating realistic views from new angles, but they are slow due to the heavy ray-marching process. Gaussian Splatting avoids this by blending splats directly, which makes it far faster and easier to scale. NeRFs may capture subtle lighting effects well, but splatting delivers the performance needed for real-time scenes.
Source: Towards Data Science
In short:
Point clouds are simple but raw.
Meshes are accurate but heavy.
NeRFs are slow but photorealistic.
Gaussian splatting brings speed and clarity, perfect for real-time viewing.
Applications in Terrain and Urban Environments
Gaussian Splatting is already being tested across several geospatial workflows. In drone mapping and infrastructure inspections, it helps preserve thin structures like cables and scaffolding, as shown in PIX4Dcloud examples. City-scale digital twins benefit from their smooth real-time navigation, making it easier to explore dense urban environments. It is also gaining traction in immersive and VR applications, where studies on volumetric video show how splatting enables fluid six-degree-of-freedom movement. Even environmental teams are using it for canopy modeling and MRV workflows, supported by recent forest monitoring research that demonstrates how drones and 3DGS can replace costlier scanning methods.
Challenges and limitations
Despite its strengths, Gaussian Splatting comes with practical challenges that matter for large geospatial projects. One of the main issues is memory. Each splat stores several parameters, and outdoor scenes can contain millions of them. This makes files heavy and puts pressure on GPU memory during training and viewing. GPU memory, often called VRAM, is the dedicated memory on a graphics card used to load and display 3D scenes. When VRAM limits are reached, the model cannot grow in detail, which affects the reconstruction of large urban areas.
Another limitation appears when the input imagery is sparse. Splatting depends on a reliable point cloud from Structure from Motion, so low overlap produces unstable geometry and floating blobs at incorrect depths. These artifacts, described in sparse view research, make scenes look broken. Workarounds like pseudo views and adaptive densification help, but they add complexity and do not fully solve the problem for wide area mapping.
A final challenge is integration with everyday GIS and BIM workflows. Gaussian Splatting is a visualization method, not a geometric one, so it lacks the surfaces and edges needed for spatial analysis, engineering measurements, or editing. Without explicit geometry, standard operations like buffering, line of sight, intersections, or CAD adjustments are hard to perform. The ecosystem is also young. While some platforms like PIX4Dcloud show early integration of splat models, support across mainstream GIS tools is still limited.
Future Directions in the Field
Researchers are exploring ways to scale Gaussian Splatting to larger scenes. One direction is multi-GPU systems that distribute millions of splats across several machines. These setups allow training at higher fidelity than a single GPU system. Another research path introduces semantic guidance, such as PG SAG, which segments buildings or terrain and optimizes them in parallel to improve geometry and reduce memory load.
A second focus aims to make splat models easier to store and stream. Raw files can be large, so several teams work on neural compression that treats splats like structured point clouds and achieves very high reduction ratios. Streaming research also continues to grow, combining tiling, saliency detection, and adaptive quality to send only key parts of a scene over the network, enabling smoother viewing even when bandwidth is limited.
The long-term goal is to bridge the gap between splats and the explicit geometry needed for GIS and BIM tools. Research into extracting surfaces, depth maps, or consistent meshes from splat models is ongoing. If successful, these methods could combine the speed of splatting with the analytical power of structured geometry.
Explore Gaussian Splatting Yourself
Gaussian Splatting is much easier to understand once you see it in motion. A good starting point is the 3DGS demo viewer, where you can rotate and zoom real scenes reconstructed with splats. It shows how the model stays smooth and responsive while you move around the environment.
For short explanations, What is 3D Gaussian Splatting? gives a clear overview of what the method does and where it is used, and 3D Gaussian Splatting! – Computerphile walks through the core idea with simple visuals and examples. If you want to see pure visuals without much theory, you can watch 3D Gaussian Splatting Demo or similar demo clips that show real scenes reconstructed from photos.
If you are ready to try it yourself, the open source Gaussian Splatting repository provides code and sample data so you can run a basic pipeline locally. It is not a one-click tool, but it gives you a practical feel for how images turn into splats and how the resulting model behaves during navigation.
3D Gaussian Splatting offers a new way to explore geospatial datasets. It is fast, detailed, and smooth. It keeps complex structures intact and feels natural in motion. For drone operators, planners, and digital twin teams, it creates a more interactive way to engage with large sites.
It will not replace meshes or point clouds. Those formats remain vital for engineering tasks and spatial analysis. Instead, splatting acts as a high-performance visualization layer. It speeds up decision-making and makes exploration easier. As compression improves, as hybrid workflows develop, and as geometry extraction matures, 3DGS may become a standard part of geospatial toolkits.
For now, it is a promising and practical technique that helps teams move faster while working with real-world imagery.
Did you like this post? Read more and subscribe to our monthly newsletter!

