Using SWOT Mission Data: Monitoring South Asian Rivers During Monsoon Season
The Surface Water and Ocean Topography (SWOT) mission is transforming our ability to monitor global surface water and ocean dynamics.
Launched on December 16, 2022, this collaborative project between NASA and the French space agency CNES provides a new perspective on Earth’s lakes, rivers, and oceans— enabling researchers to study water resources and climate change with greater detail and accuracy.
SWOT’s Mission Objectives: A Closer Look at Earth’s Water
SWOT aims to fill data gaps by providing high-resolution measurements of surface water elevations and inundation extents for rivers, lakes, reservoirs, and wetlands, as well as detailed observations of ocean currents and water whirlpools. The mission’s primary objectives are:
- Create a detailed water map with high spatial resolution
SWOT is drawing the most precise picture yet of Earth’s water bodies. It’s measuring the heights of rivers, lakes, and wetlands with incredible accuracy, showing us exactly where water is and how much of it there is too.
- Enhance our understanding of ocean currents and small-scale dynamics
The mission is diving deep into understanding ocean currents and tiny water swirls that were previously too small to see from space. These small-scale dynamics shed light onto things that were previously unseen. SWOT is helping us to better grasp how oceans move heat and affect our climate.
- Support water management
By providing us with a clearer picture of our water resources, SWOT gives decision-makers, stakeholders, and policymakers alike, new tools. This could lead to better decisions about how we use and protect our water supplies.
SWOT Products and Data Overview
The SWOT data is categorized into three primary products: L2_HR_Raster, L2_HR_RiverSP, and L2_HR_LakeSP. Essentially:
- Raster images: Think of these as detailed water maps.
- River snapshots: Focused data on river changes over time.
- Lake insights: Detailed information about lakes and reservoirs.
Each product includes variables like water surface elevation (WSE), river and lake surface area, and derived discharge, allowing researchers to monitor changes in water bodies. The datasets are available in formats such as NetCDF-4 and shapefiles, making them compatible with most geospatial tools. Scientists and water managers can use this information to track changes in our water resources over time.
Data Access and Availability
The SWOT data can be accessed through platforms, primarily via NASA’s Physical Oceanography Distributed Active Archive Center (PO.DAAC) and the Earthdata Search portal.
Users can download the datasets in different formats, depending on the product type and their specific research needs. For advanced users, data can also be accessed directly through cloud services such as AWS S3, ensuring efficient and scalable data handling.
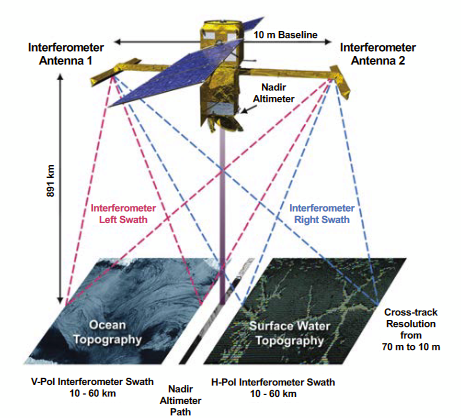
Overview of SWOT Measurement System
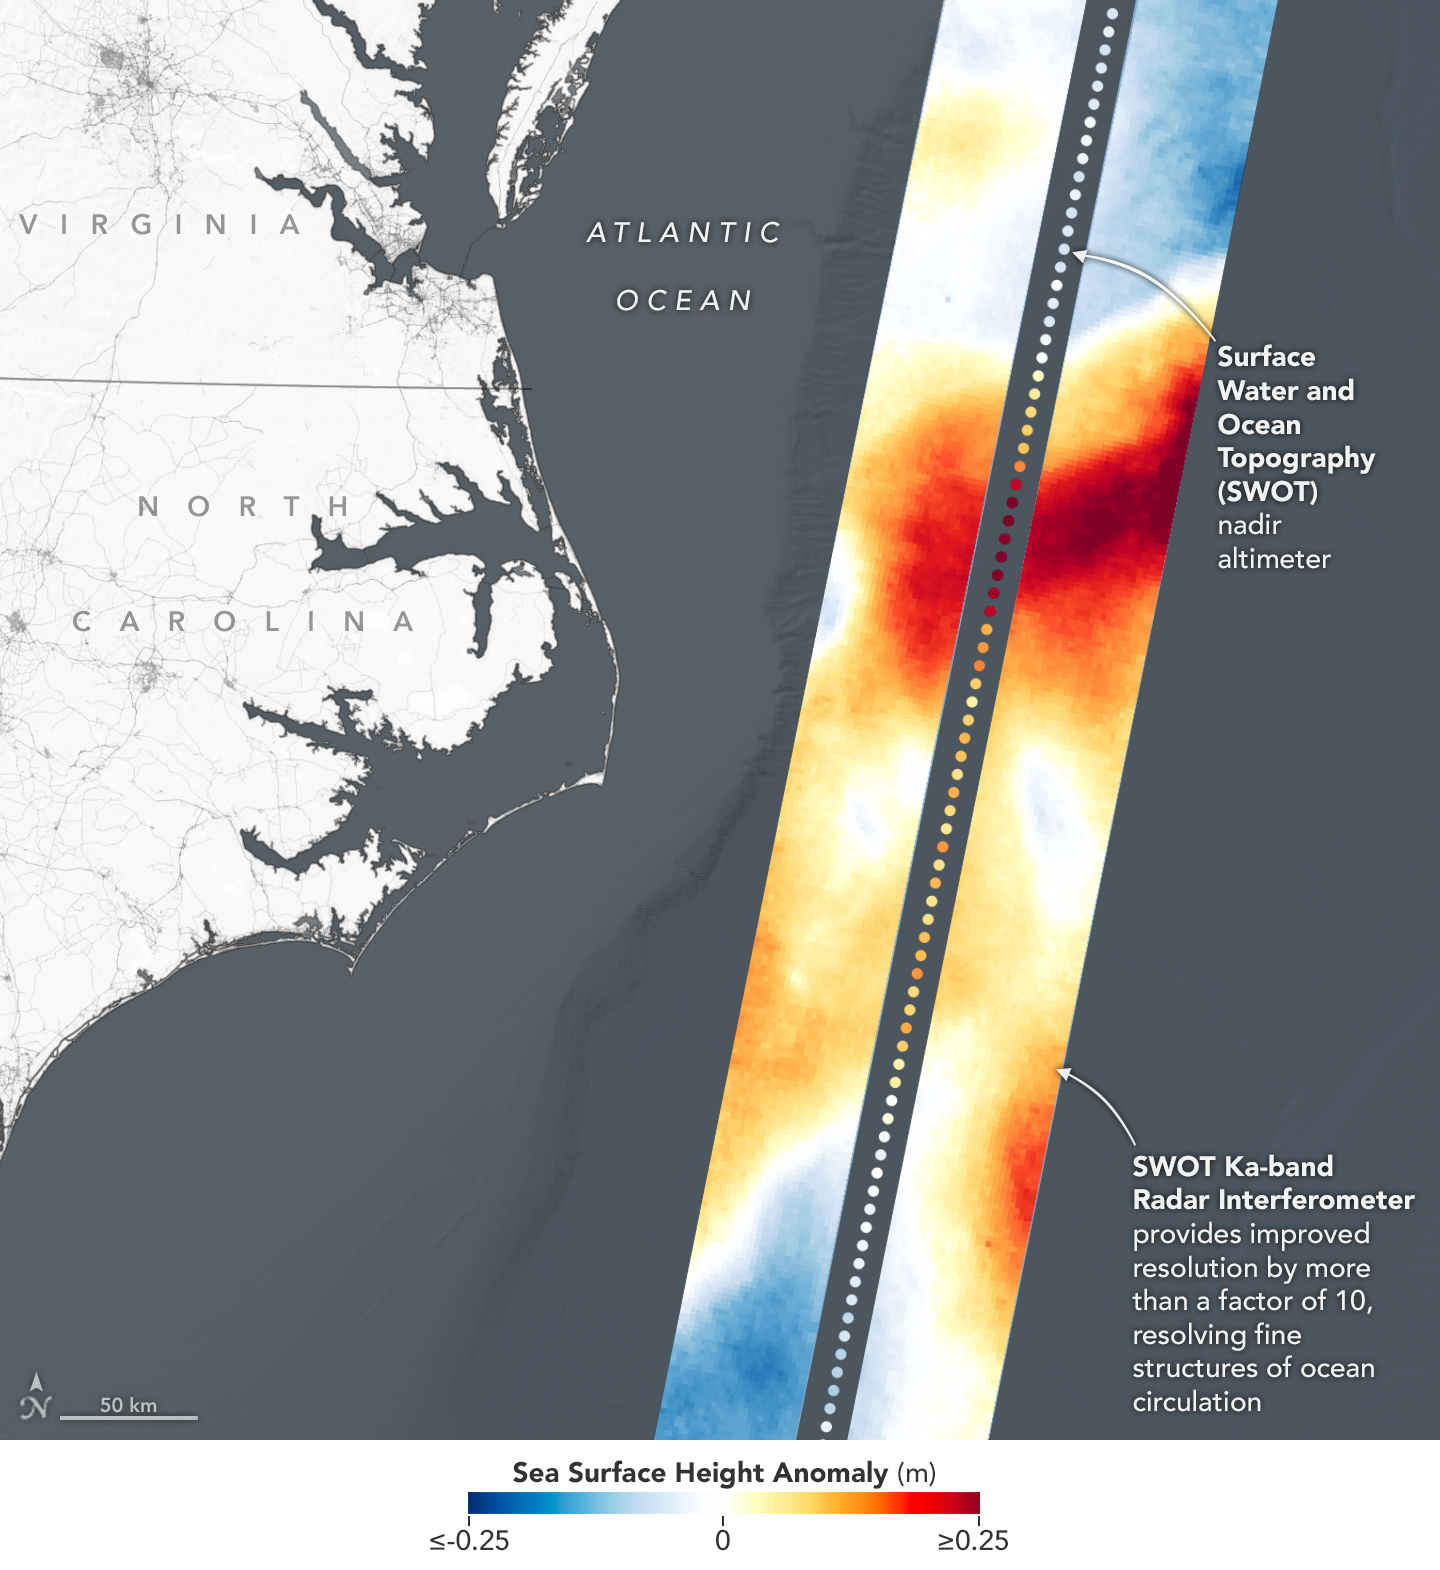
SWOT raster data by NASA
Case Study: Monitoring Indian and Pakistanian Rivers During Monsoon Using SWOT Data
A small study using SWOT data was conducted to monitor changes in the width and Water Surface Elevation (WSE) of major Indian and Pakistanian rivers during the monsoon season.
Data
Two SWOT datasets were used: one from the peak monsoon period (July 2023/August 2023) and one from the non-monsoon period (December 2023/January 2024). Researchers wanted to see how these rivers swelled and shrank with the rains.
Processing
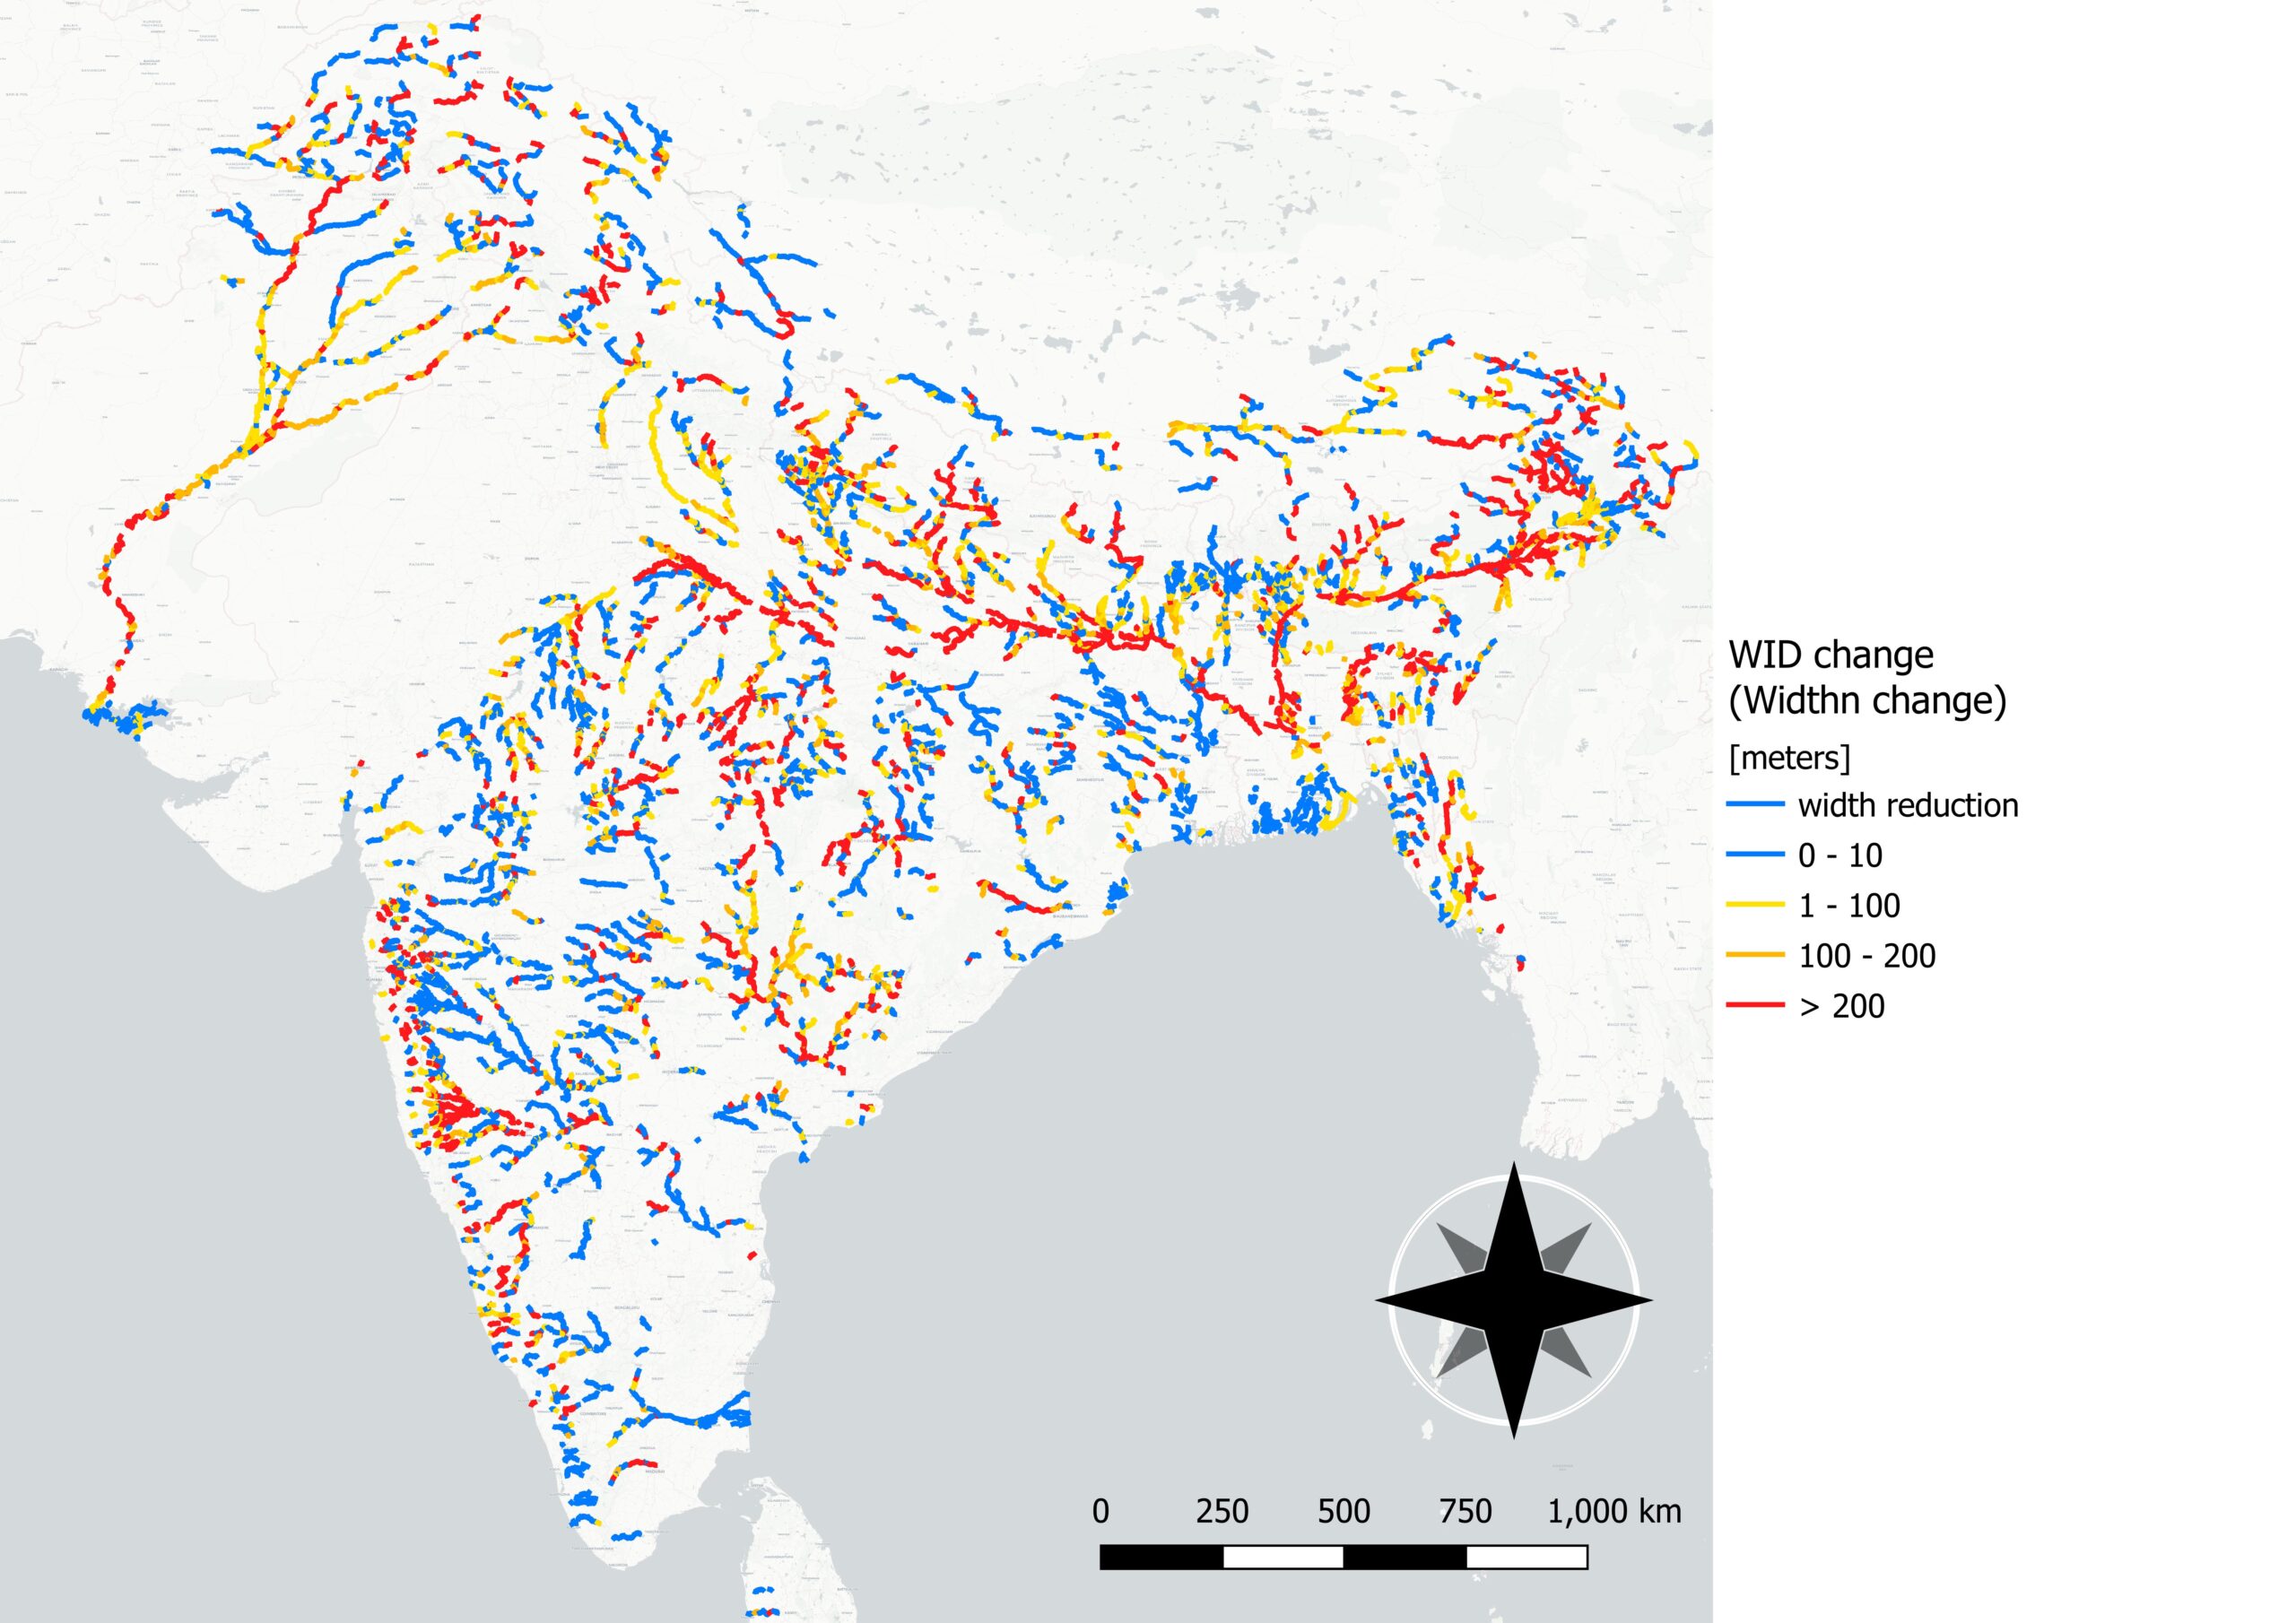
To ensure data reliability, river segments with high uncertainty values were excluded, leaving only those with relatively low uncertainty for analysis. The selected data attributes, such as width, WSE, and slope, were integrated into a single table for a comprehensive view of the river changes. Differences in WSE and width were calculated by comparing the monsoon and non-monsoon datasets. Visualizations were created using QGIS software, showcasing the spatial distribution of these changes across different river basins. These maps show exactly where rivers expanded the most, where water levels rose dramatically, and how different river basins responded to the monsoon rains.
Results
The Indus River showed a significant increase in water level, with WSE values rising by at least 3 meters during the monsoon compared to the non-monsoon period. The width of the Indus also expanded considerably, reaching over 200 meters wider in certain segments.
In contrast, the changes observed in the rivers flowing over the Deccan Plateau, such as the Godavari, were relatively minor, with only slight increases in both width and WSE. These visualizations clearly illustrated the correlation between intense monsoon rainfall and rising water levels in the Ganges and Brahmaputra. These rivers swelled dramatically with monsoon rains.
One of the study’s key insights was identifying river segments prone to high seasonal variability, which are crucial for flood risk management.
Continuous monitoring and comparison of SWOT datasets over several years could help us understand the rivers of South Asia like never before. This knowledge could reveal how climate change is affecting these vital waterways, making a significant difference in flood preparation for high-risk areas and water management overall.

Conclusion
The SWOT mission is a groundbreaking initiative that bridges the gap between hydrology and oceanography by providing high-resolution, global measurements of surface water and ocean topography.
With its advanced Ka-band Radar Interferometer (KaRIn) sensor, SWOT delivers critical data that enhances water resource management, informs climate change research, and improves disaster response efforts.
As the mission progresses, the insights gained from SWOT will continue to shape our understanding of Earth’s water systems, contributing to more effective management and preservation of this precious resource.
Did you like this post? Read more and subscribe to our monthly newsletter!


#Contributing Writers

Next article
Hey, Geoawesome community! We’re excited to introduce an original series called “You Are #Geoawesome” where we invite you to share what makes geospatial and remote sensing technology truly amazing. This is your chance to showcase your passion and inspire others, and we want to make it as easy as possible for you to participate! Here’s everything you need to know to get started:
✨ What is the “You Are #Geoawesome” Series?
The series is all about highlighting the people who make our community special. Whether you’re a GIS expert, a drone enthusiast, or simply someone who loves working with geospatial technology, we want to hear your story! Share a video that showcases your enthusiasm for the field—maybe it’s about a favorite tool you use, a unique project you’ve worked on, or an inspiring colleague who has made an impact on your career.
? How to Record Your Video:
-
Plan Your Content:
Decide what you want to talk about. It could be your personal experience in the geospatial industry, a cool project you’ve been part of, or why you think geospatial technology is changing the world.
-
Record the Video:
- Keep it under 3 minutes.
- Use any device you’re comfortable with, it can be your phone, camera, or laptop.
- There’s no need to worry about adding music or graphics; keep it simple and authentic. Our team will handle all the post-production work, including editing, adding background music, and inserting graphics. You can add your comments or upload your graphic if you’d love to! We’ll do the rest!
-
What to Include:
- Introduction: Start by introducing yourself (e.g., your name, job title, and location).
- Your Geoawesome Story: Talk about your background and share why you think geospatial is awesome. It could be a personal story, your experience with a tool, or a project that left an impact.
- End with Enthusiasm: Close with a shoutout to the Geoawesome community or mention why you love being a part of it.
-
Video Quality Tips:
- Good Lighting: Make sure your face is well-lit.
- Clear Sound: Record in a quiet place to avoid background noise.
- Camera Position: Keep the camera steady and at eye level.
? How to Submit:
Once you’re happy with your video, simply email it to us at info@geoawesome.com. Include your name, job title, and a brief description of what your video is about. Our team will review it, and if selected, it will be featured on our website and social media channels.
? Example Video:
To get an idea of what we’re looking for, check out the first video by our Team Support Employee, Sebastian! His story highlights how geospatial technology has influenced his career choice and what makes the field so inspiring. Watch his recording on our website or social media pages (e.g. YouTube).
? Get Involved and Be Featured!
We’re extremely happy to see what makes geospatial technology special for you. This is your chance to inspire others, make connections, and celebrate the innovation within our community. So, grab your camera, share your story, and become a part of the “You Are #Geoawesome” series!
? Connect with Us:
? info@geoawesome.com
? Geoawesome Website
FB: /geoawesome.digital
IG: /geoawesome.digital
X: @geoawesome_dgtl
LN: /geoawesome
Let’s keep the #Geoawesome spirit alive!
Did you like this post? Read more and subscribe to our monthly newsletter!

