Today is the fourth Thursday of November which means that people in the US celebrate Thanksgiving. This compilation of maps, charts and infographics is trying to capture the numbers and geographies behind the holiday. But what Thanksgiving is truly about? Coming together and seeking peace, despite our differences.
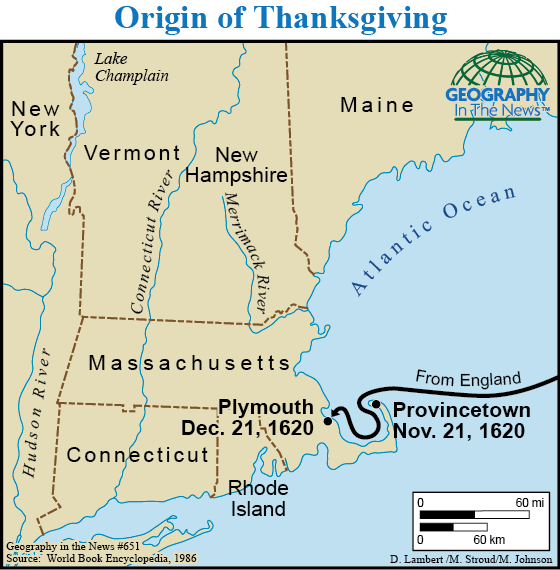
1. The origins of Thanksgiving
source: NatGeo Education
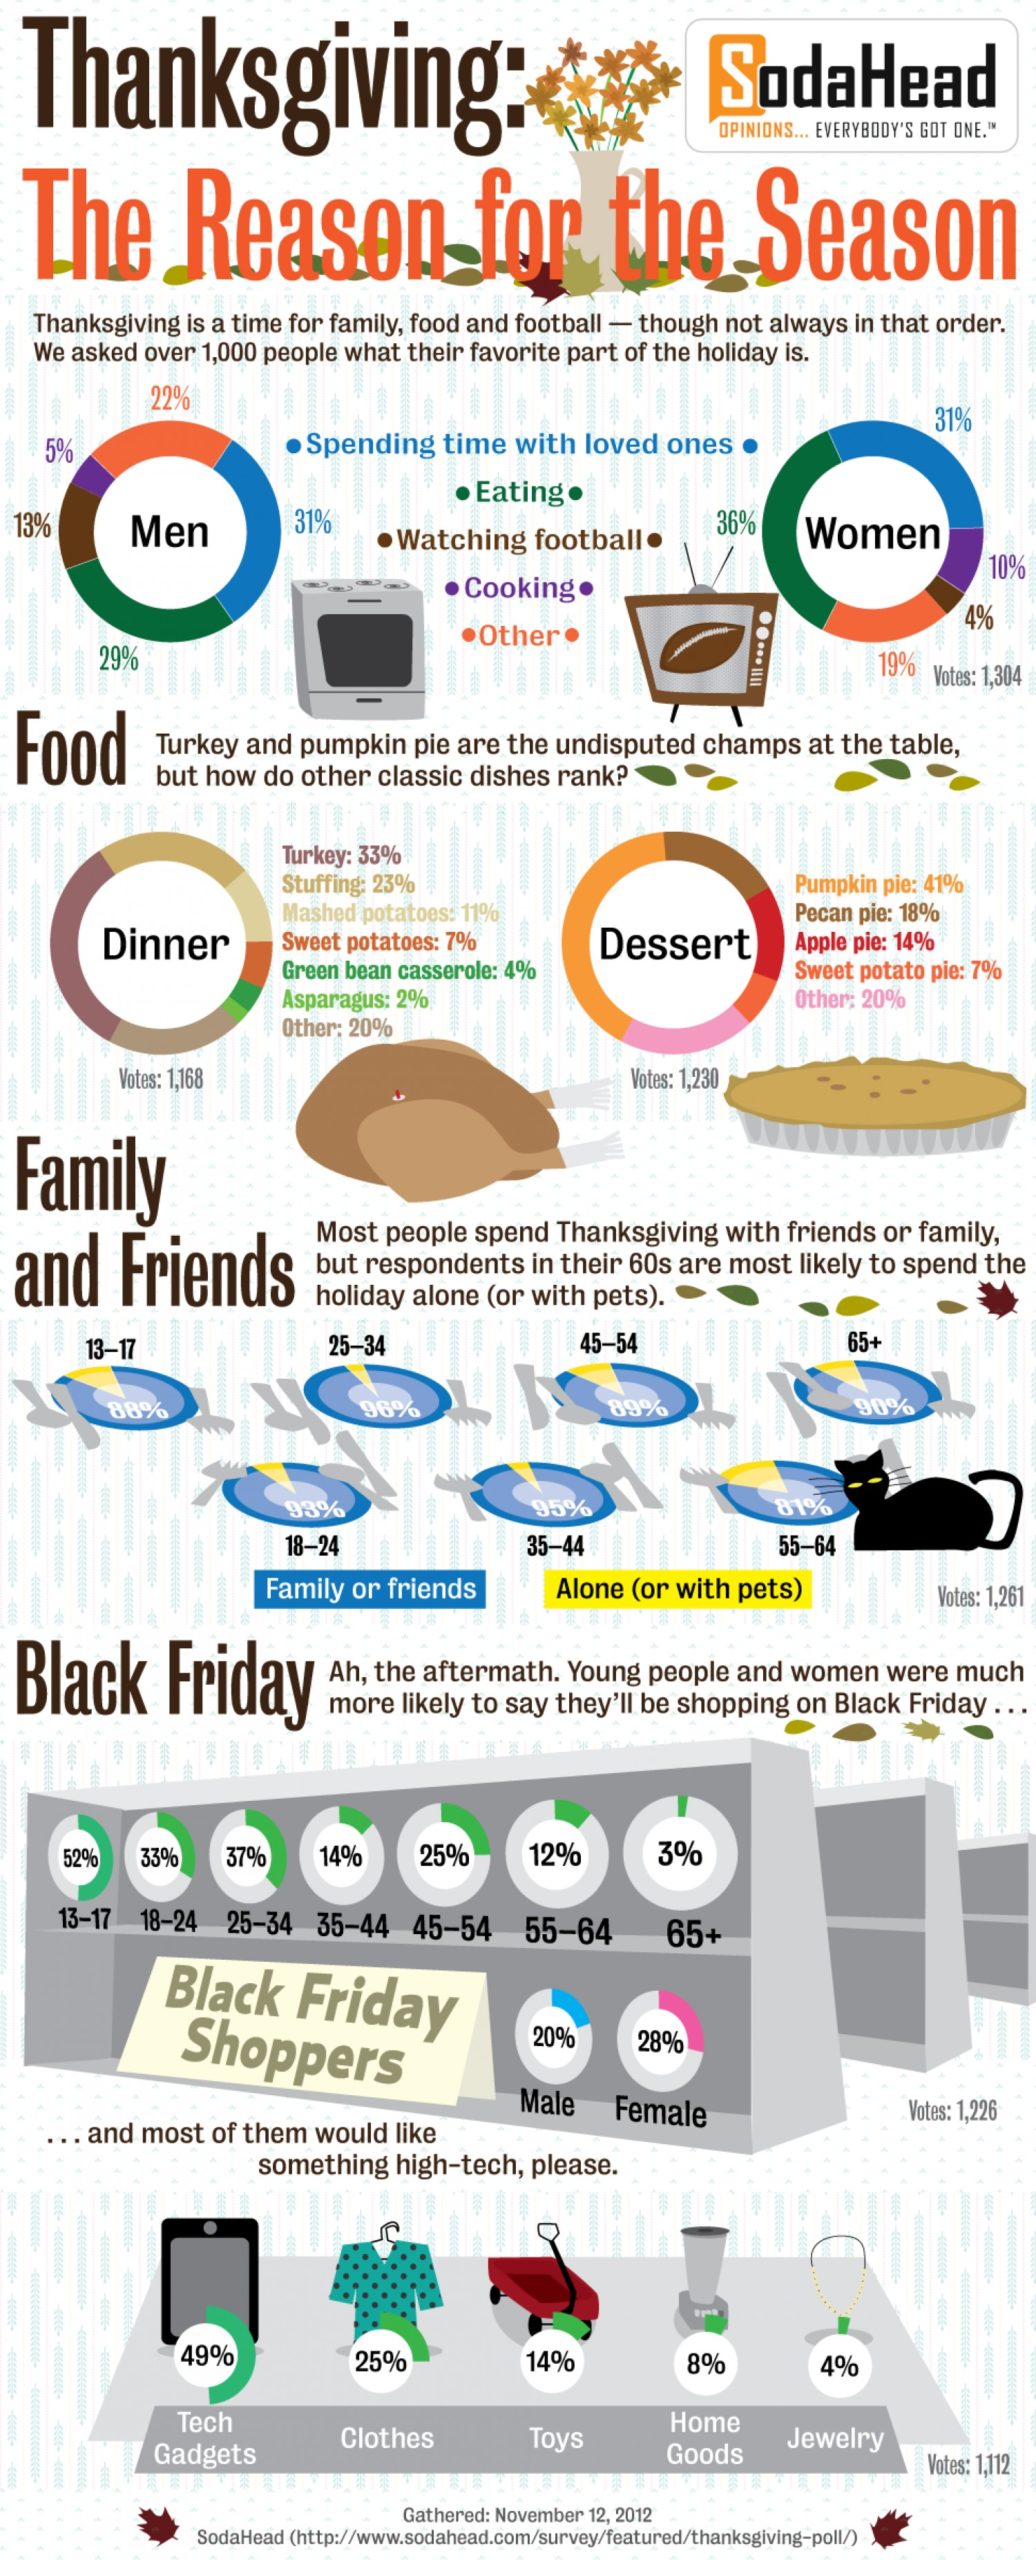
2. Thanksgiving: The Reason for the Season
source: Visually
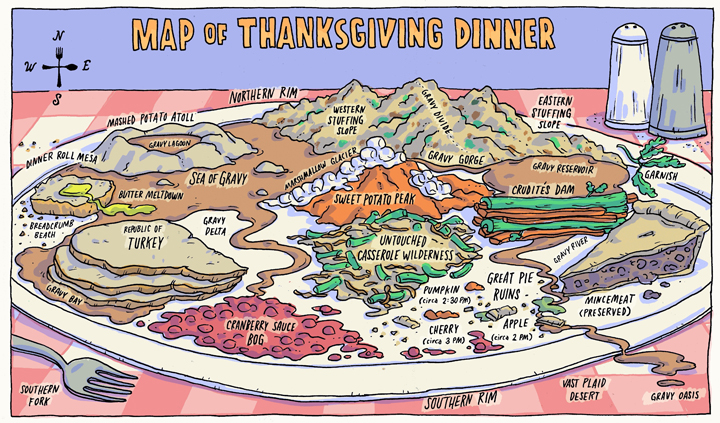
3. Map of Thanksgiving Dinner plate
Source: Incidental Comics
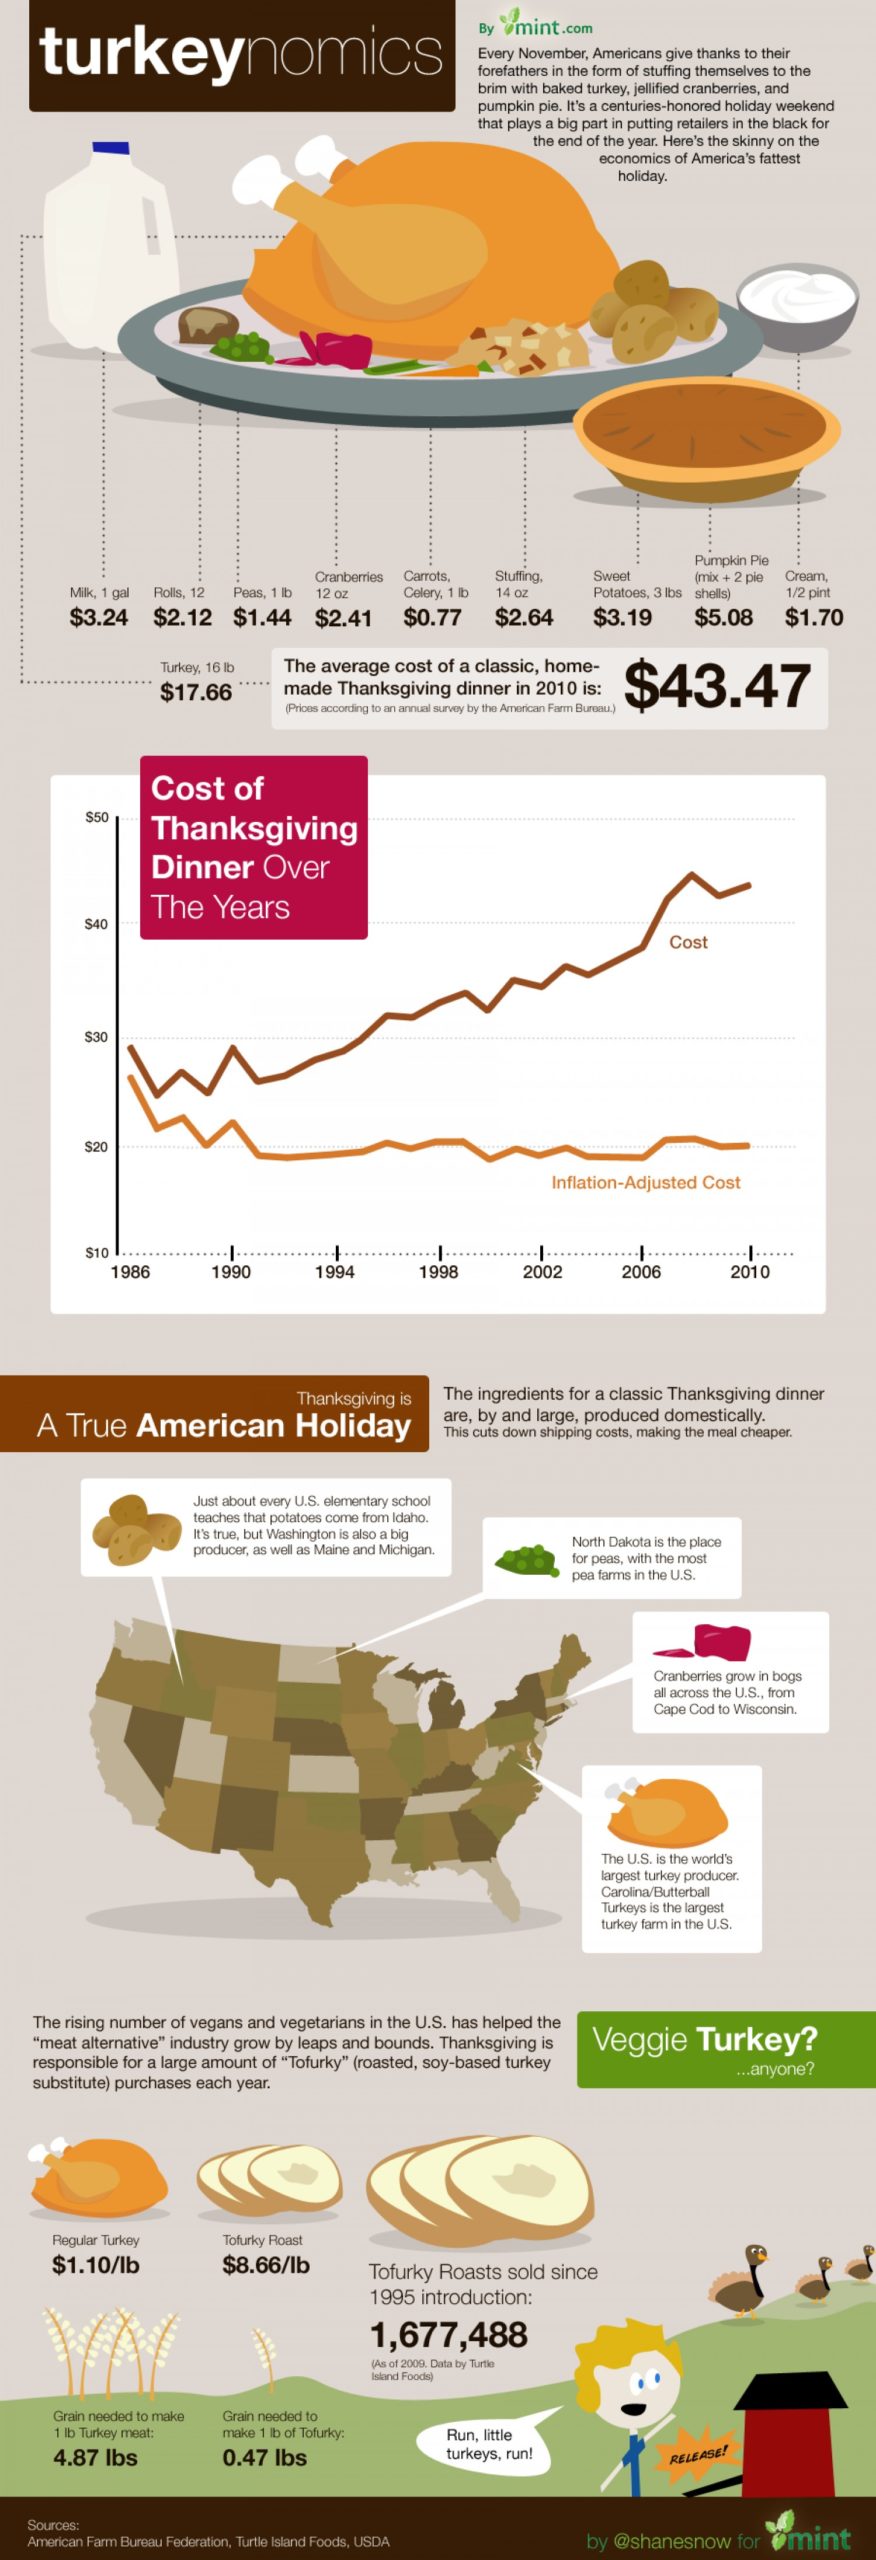
4. Cost of Thanksgiving dinner
source: Mint Blog
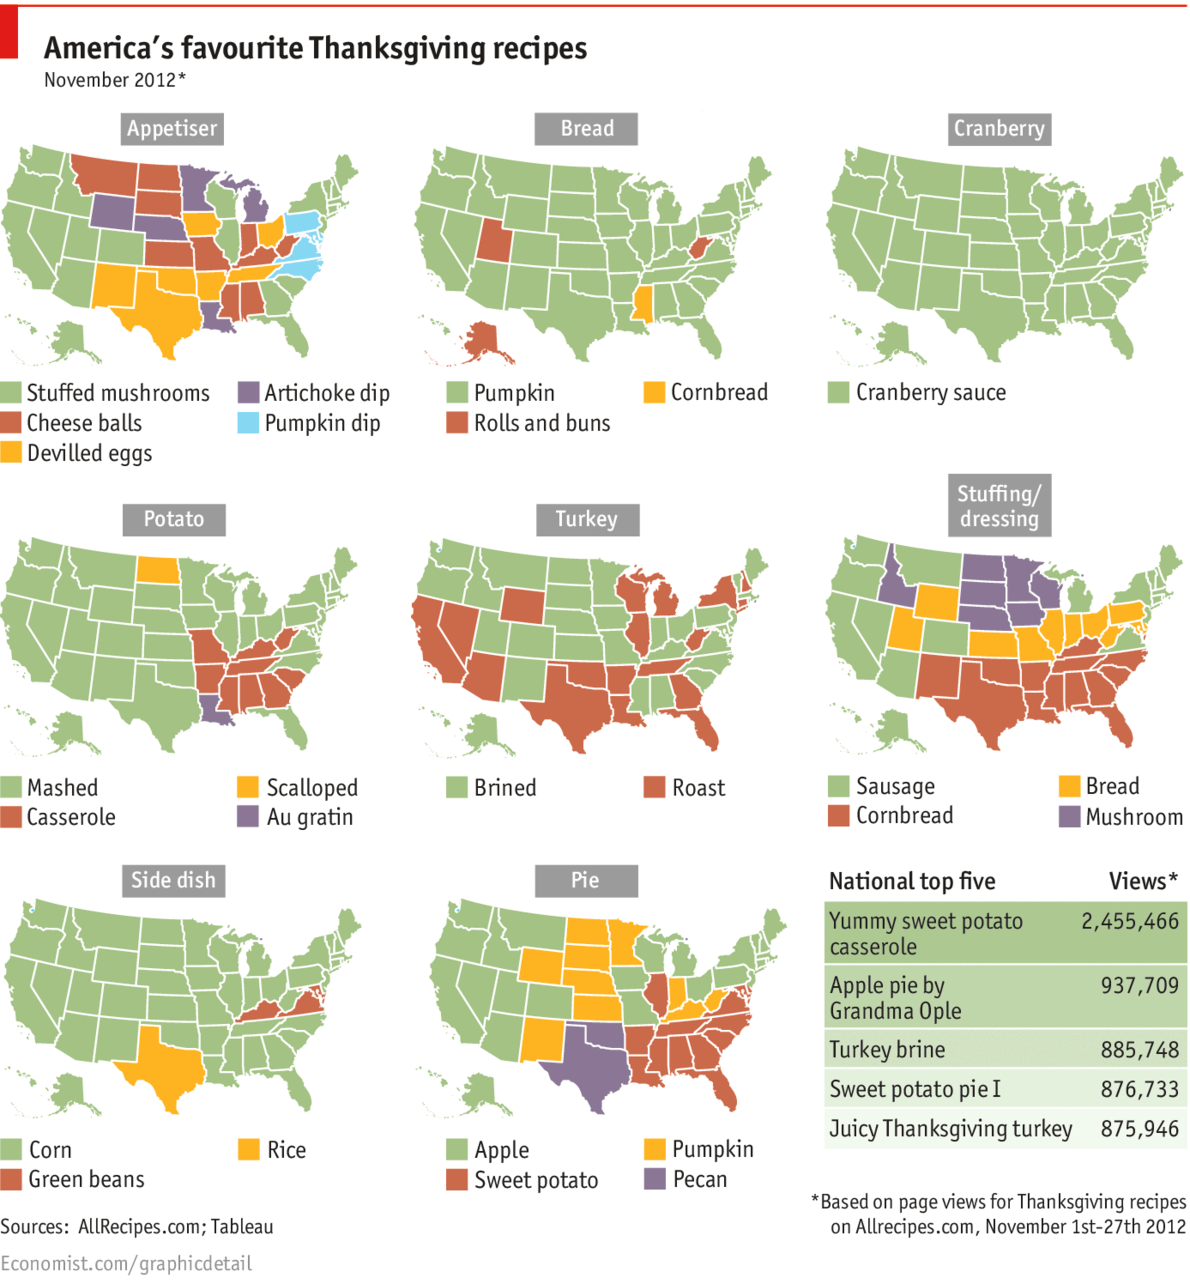
5. America’s favourite Thanksgiving recipes
source: Economist
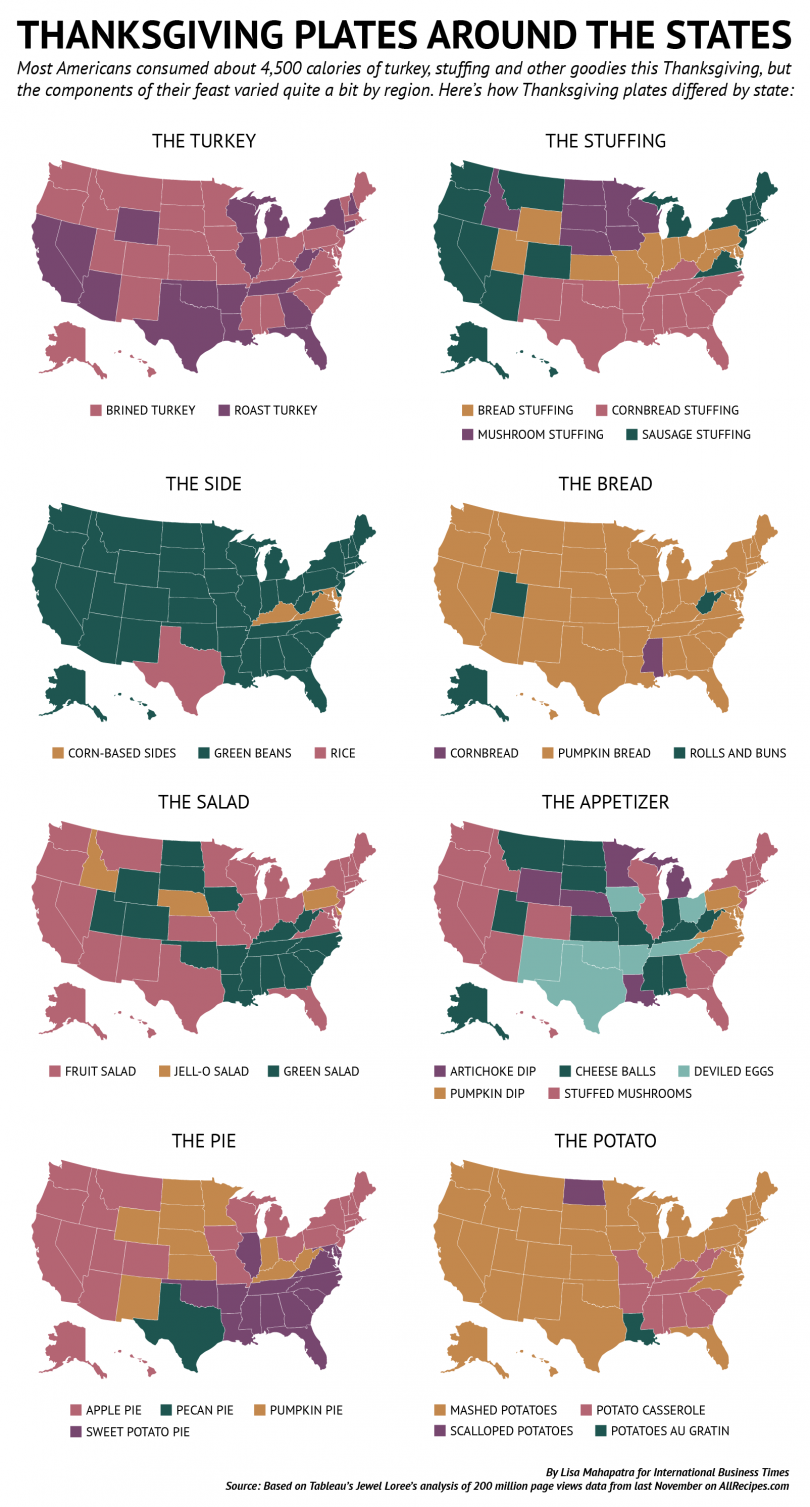
6. Here’s How Thanksgiving Plates Differed From State To State
source: IB Times
7. Where does your Thanksgiving dinner grow?
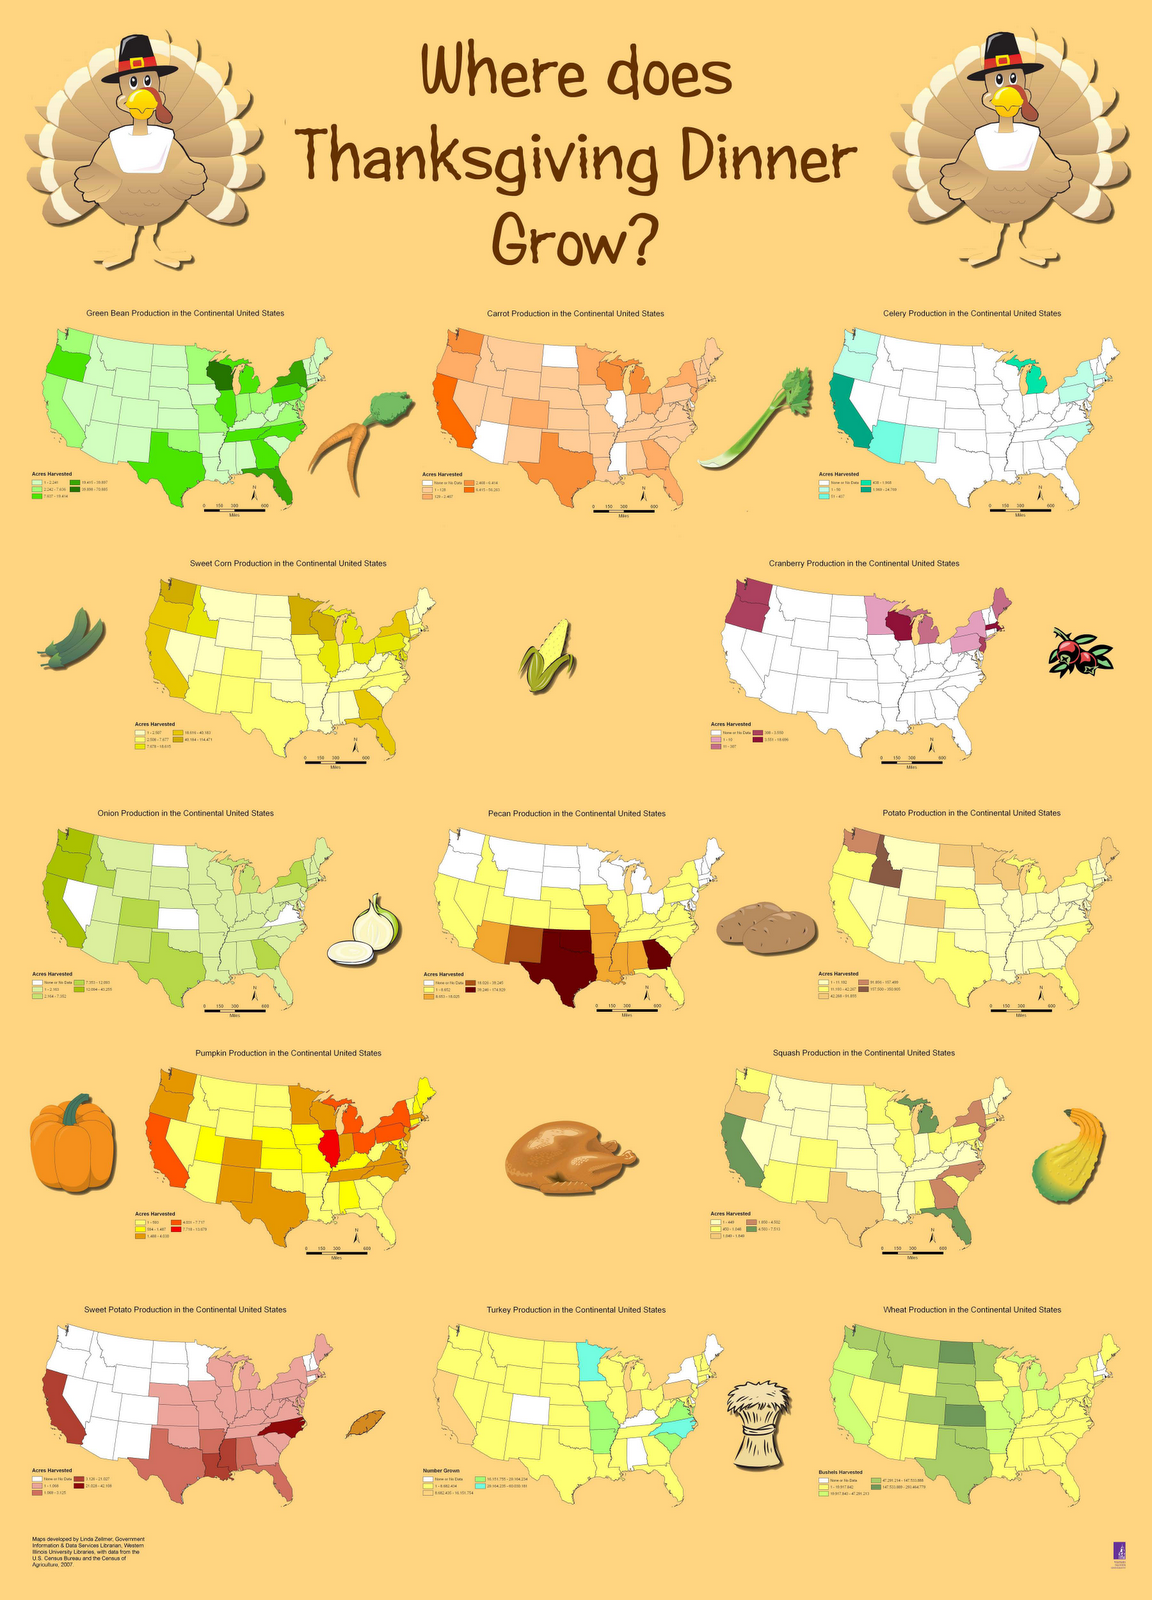 source: WIU
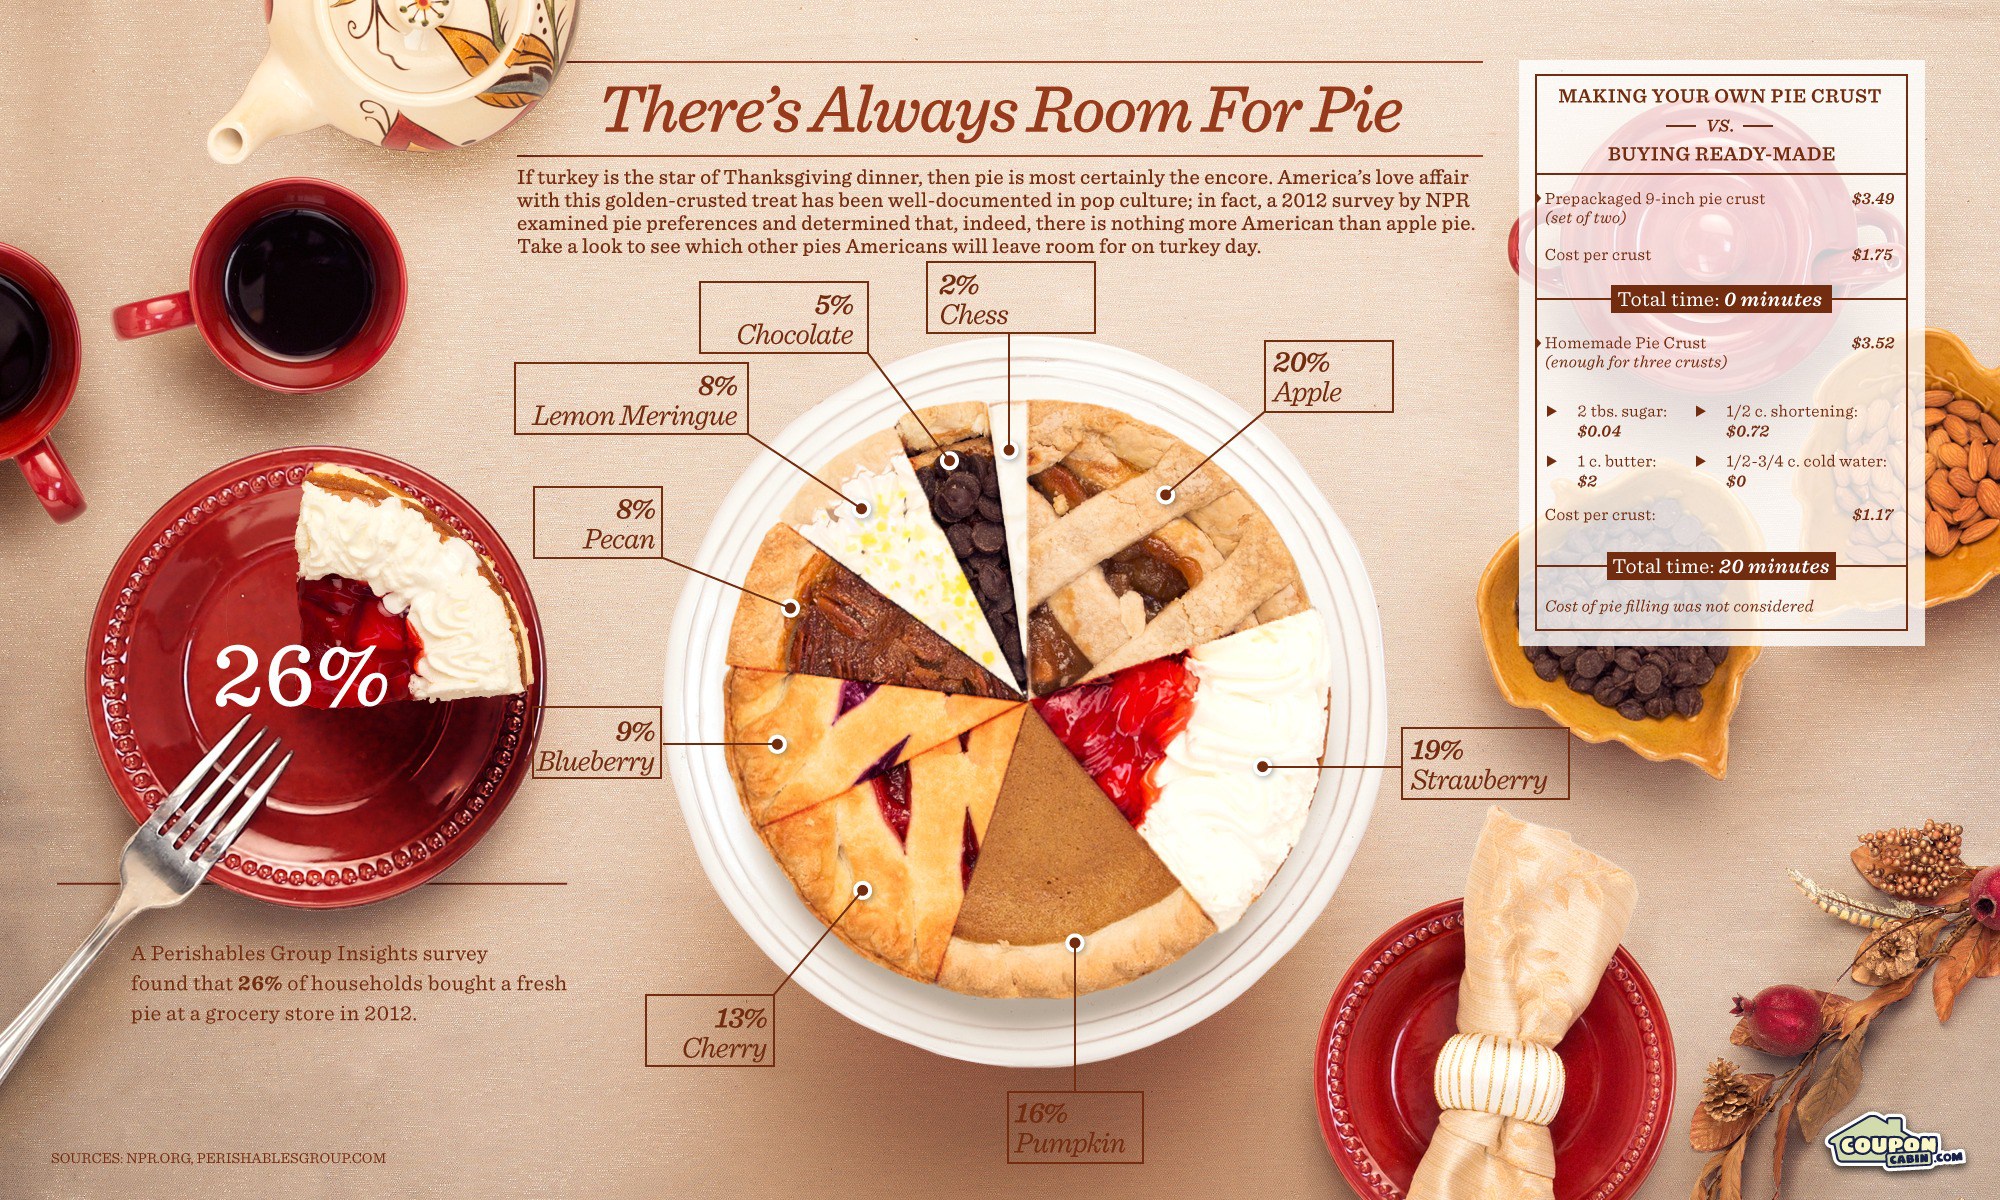
8. A pie pie chart with the most popular pies to have on Thanksgiving
source: The Huffington Post
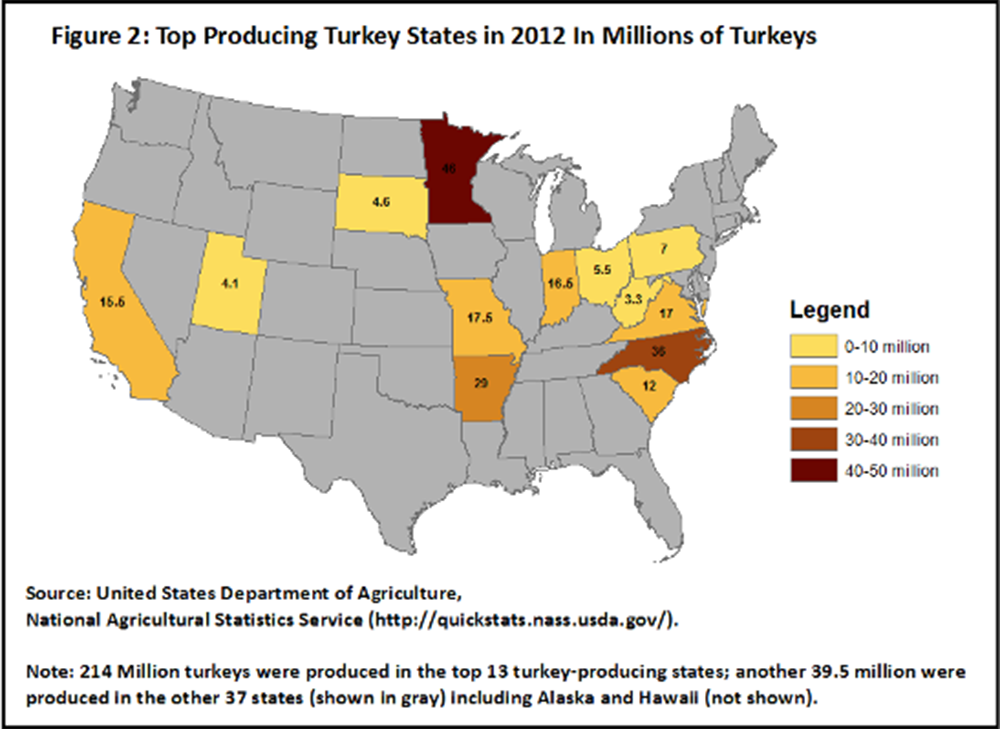
9. Turkey production per state
source: US Department of Commerce
10. A Visual Guide to Roasting Your First Turkey
source: Visually
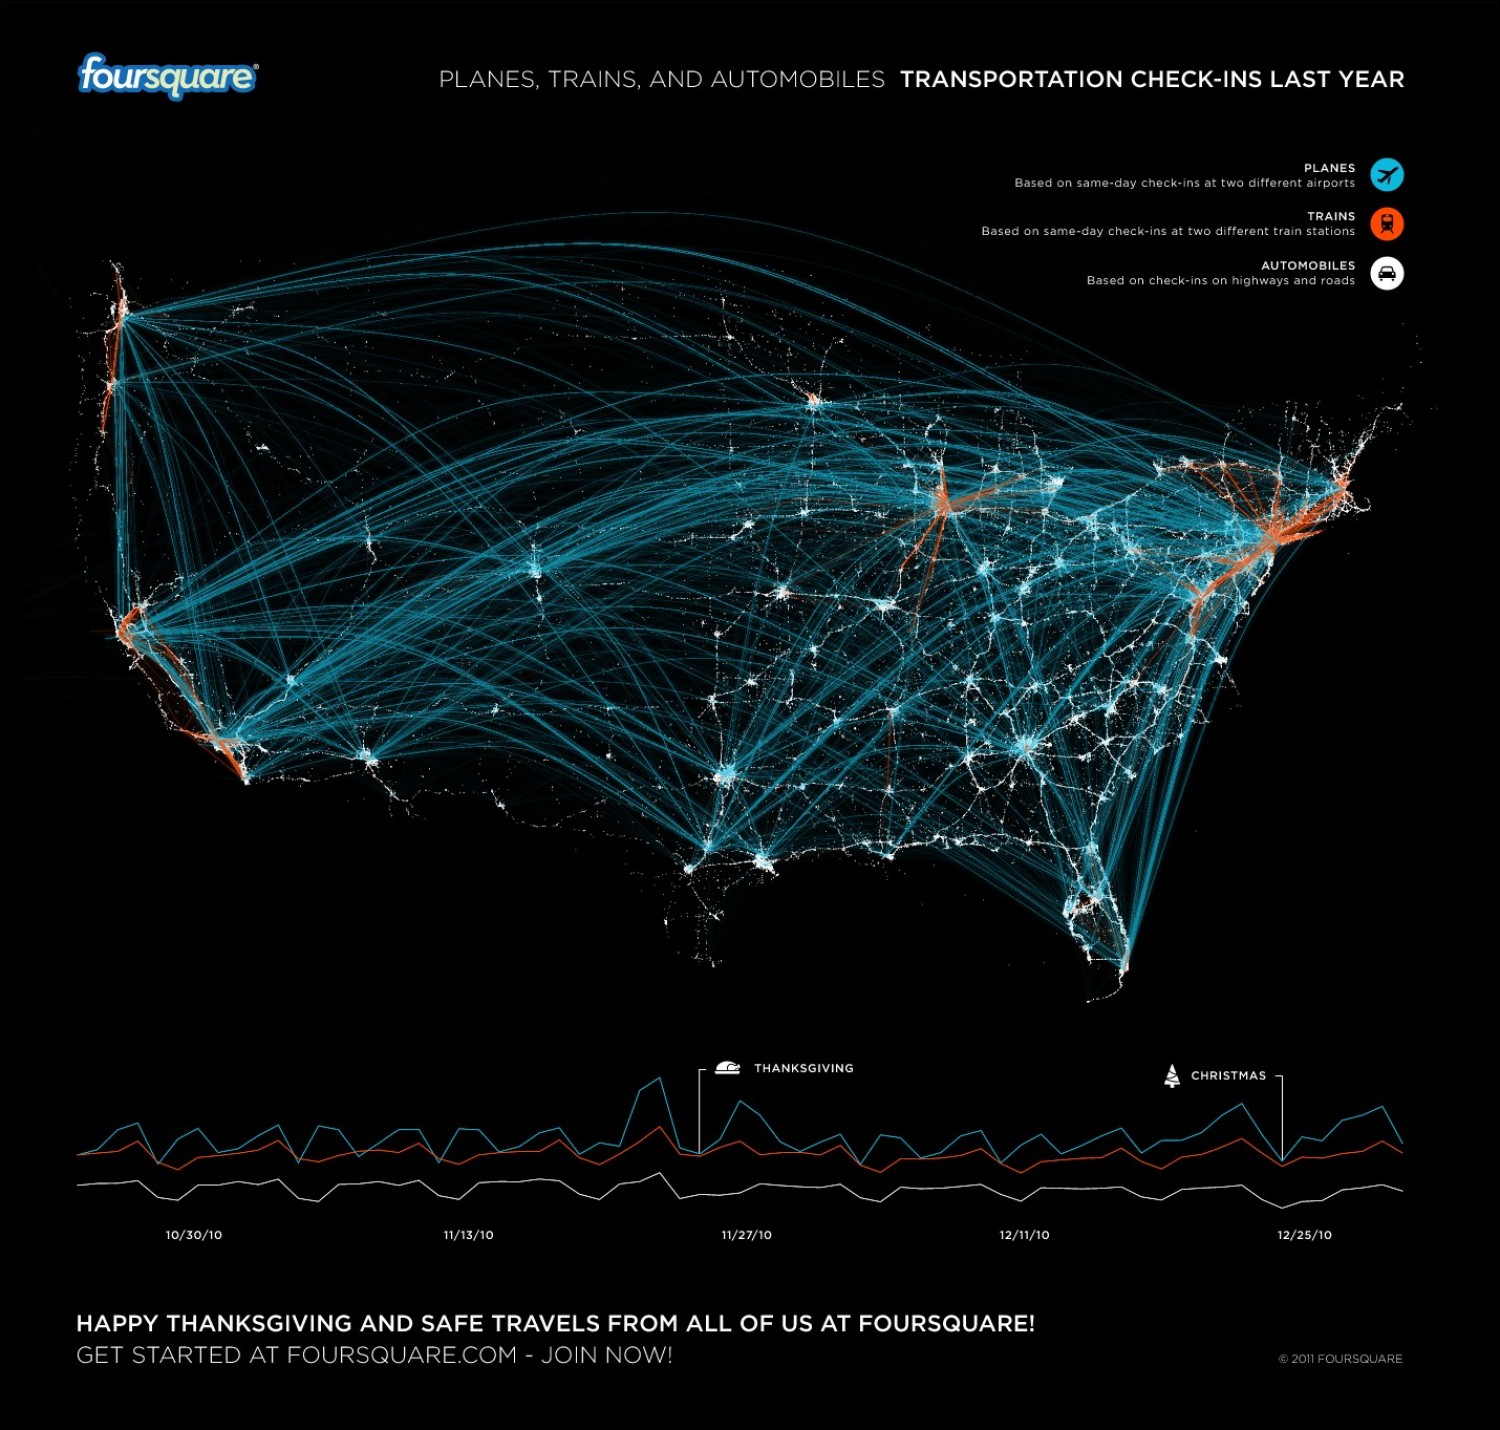
11. Thanksgiving travel patterns
source: Foursquare
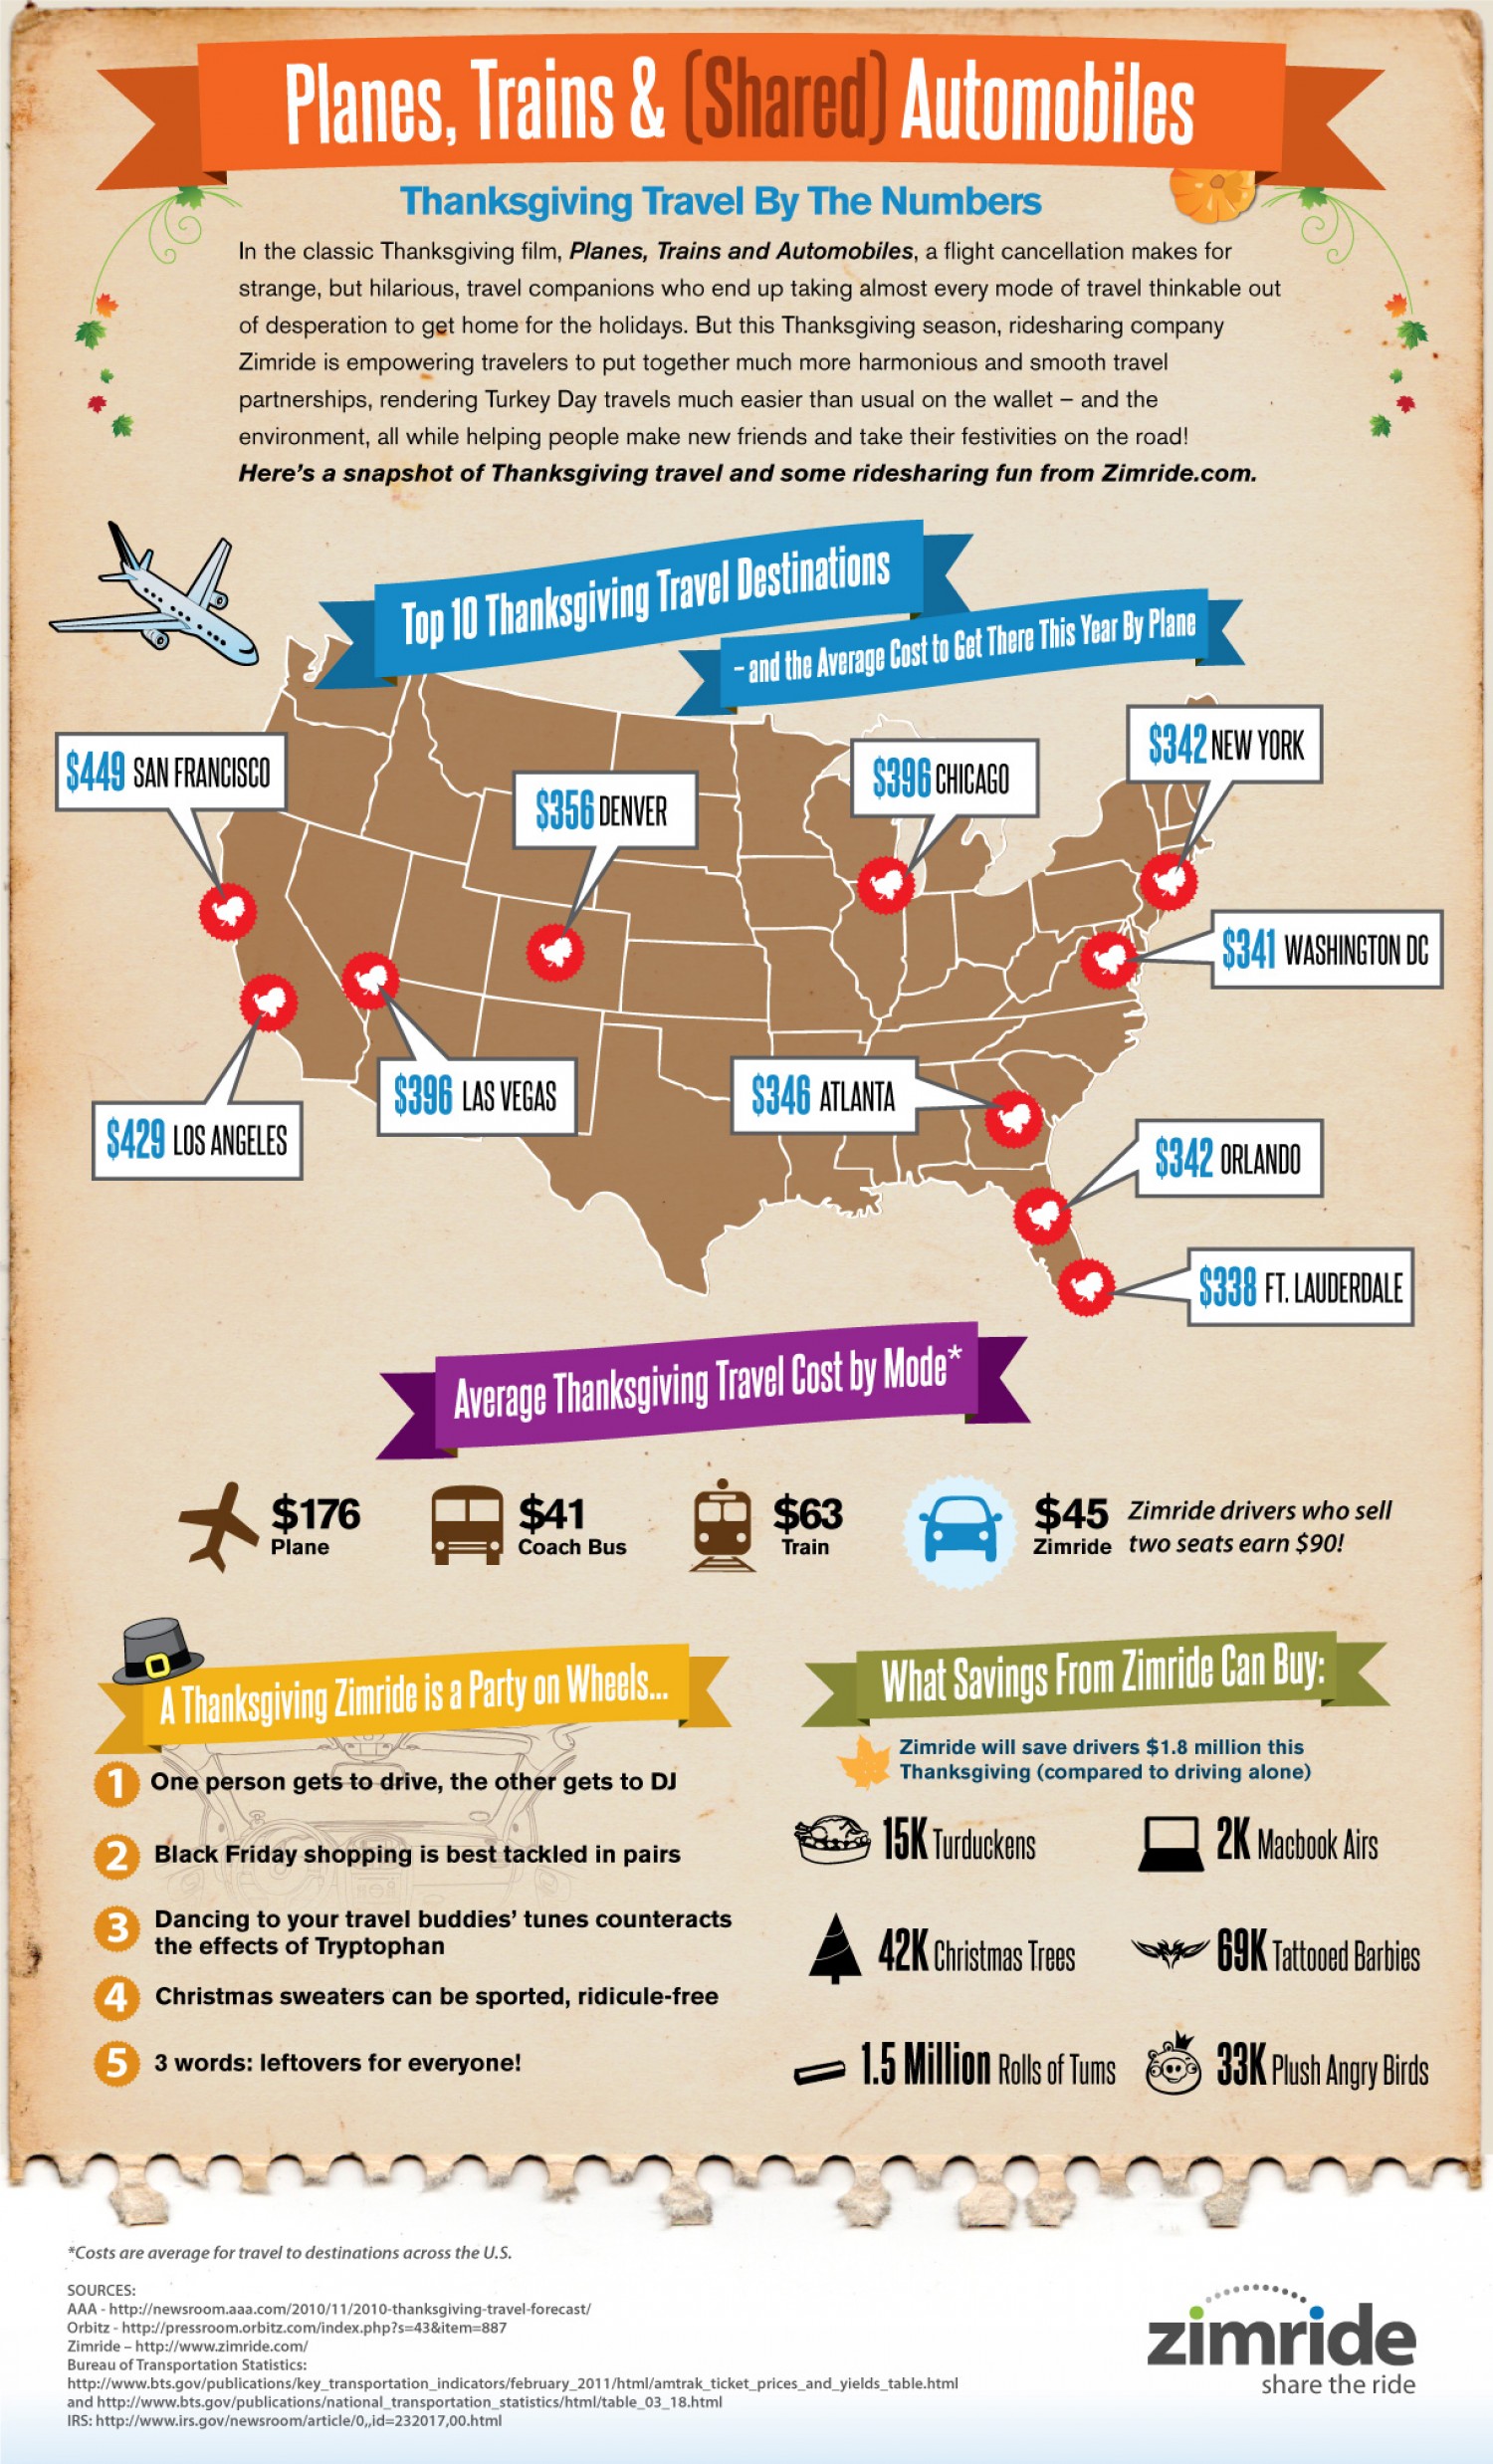
12. Top 10 Thanksgiving travel destinations and travel costs
source: Visually
13. Thanksgiving in numbers
source: Ereplacement Parts
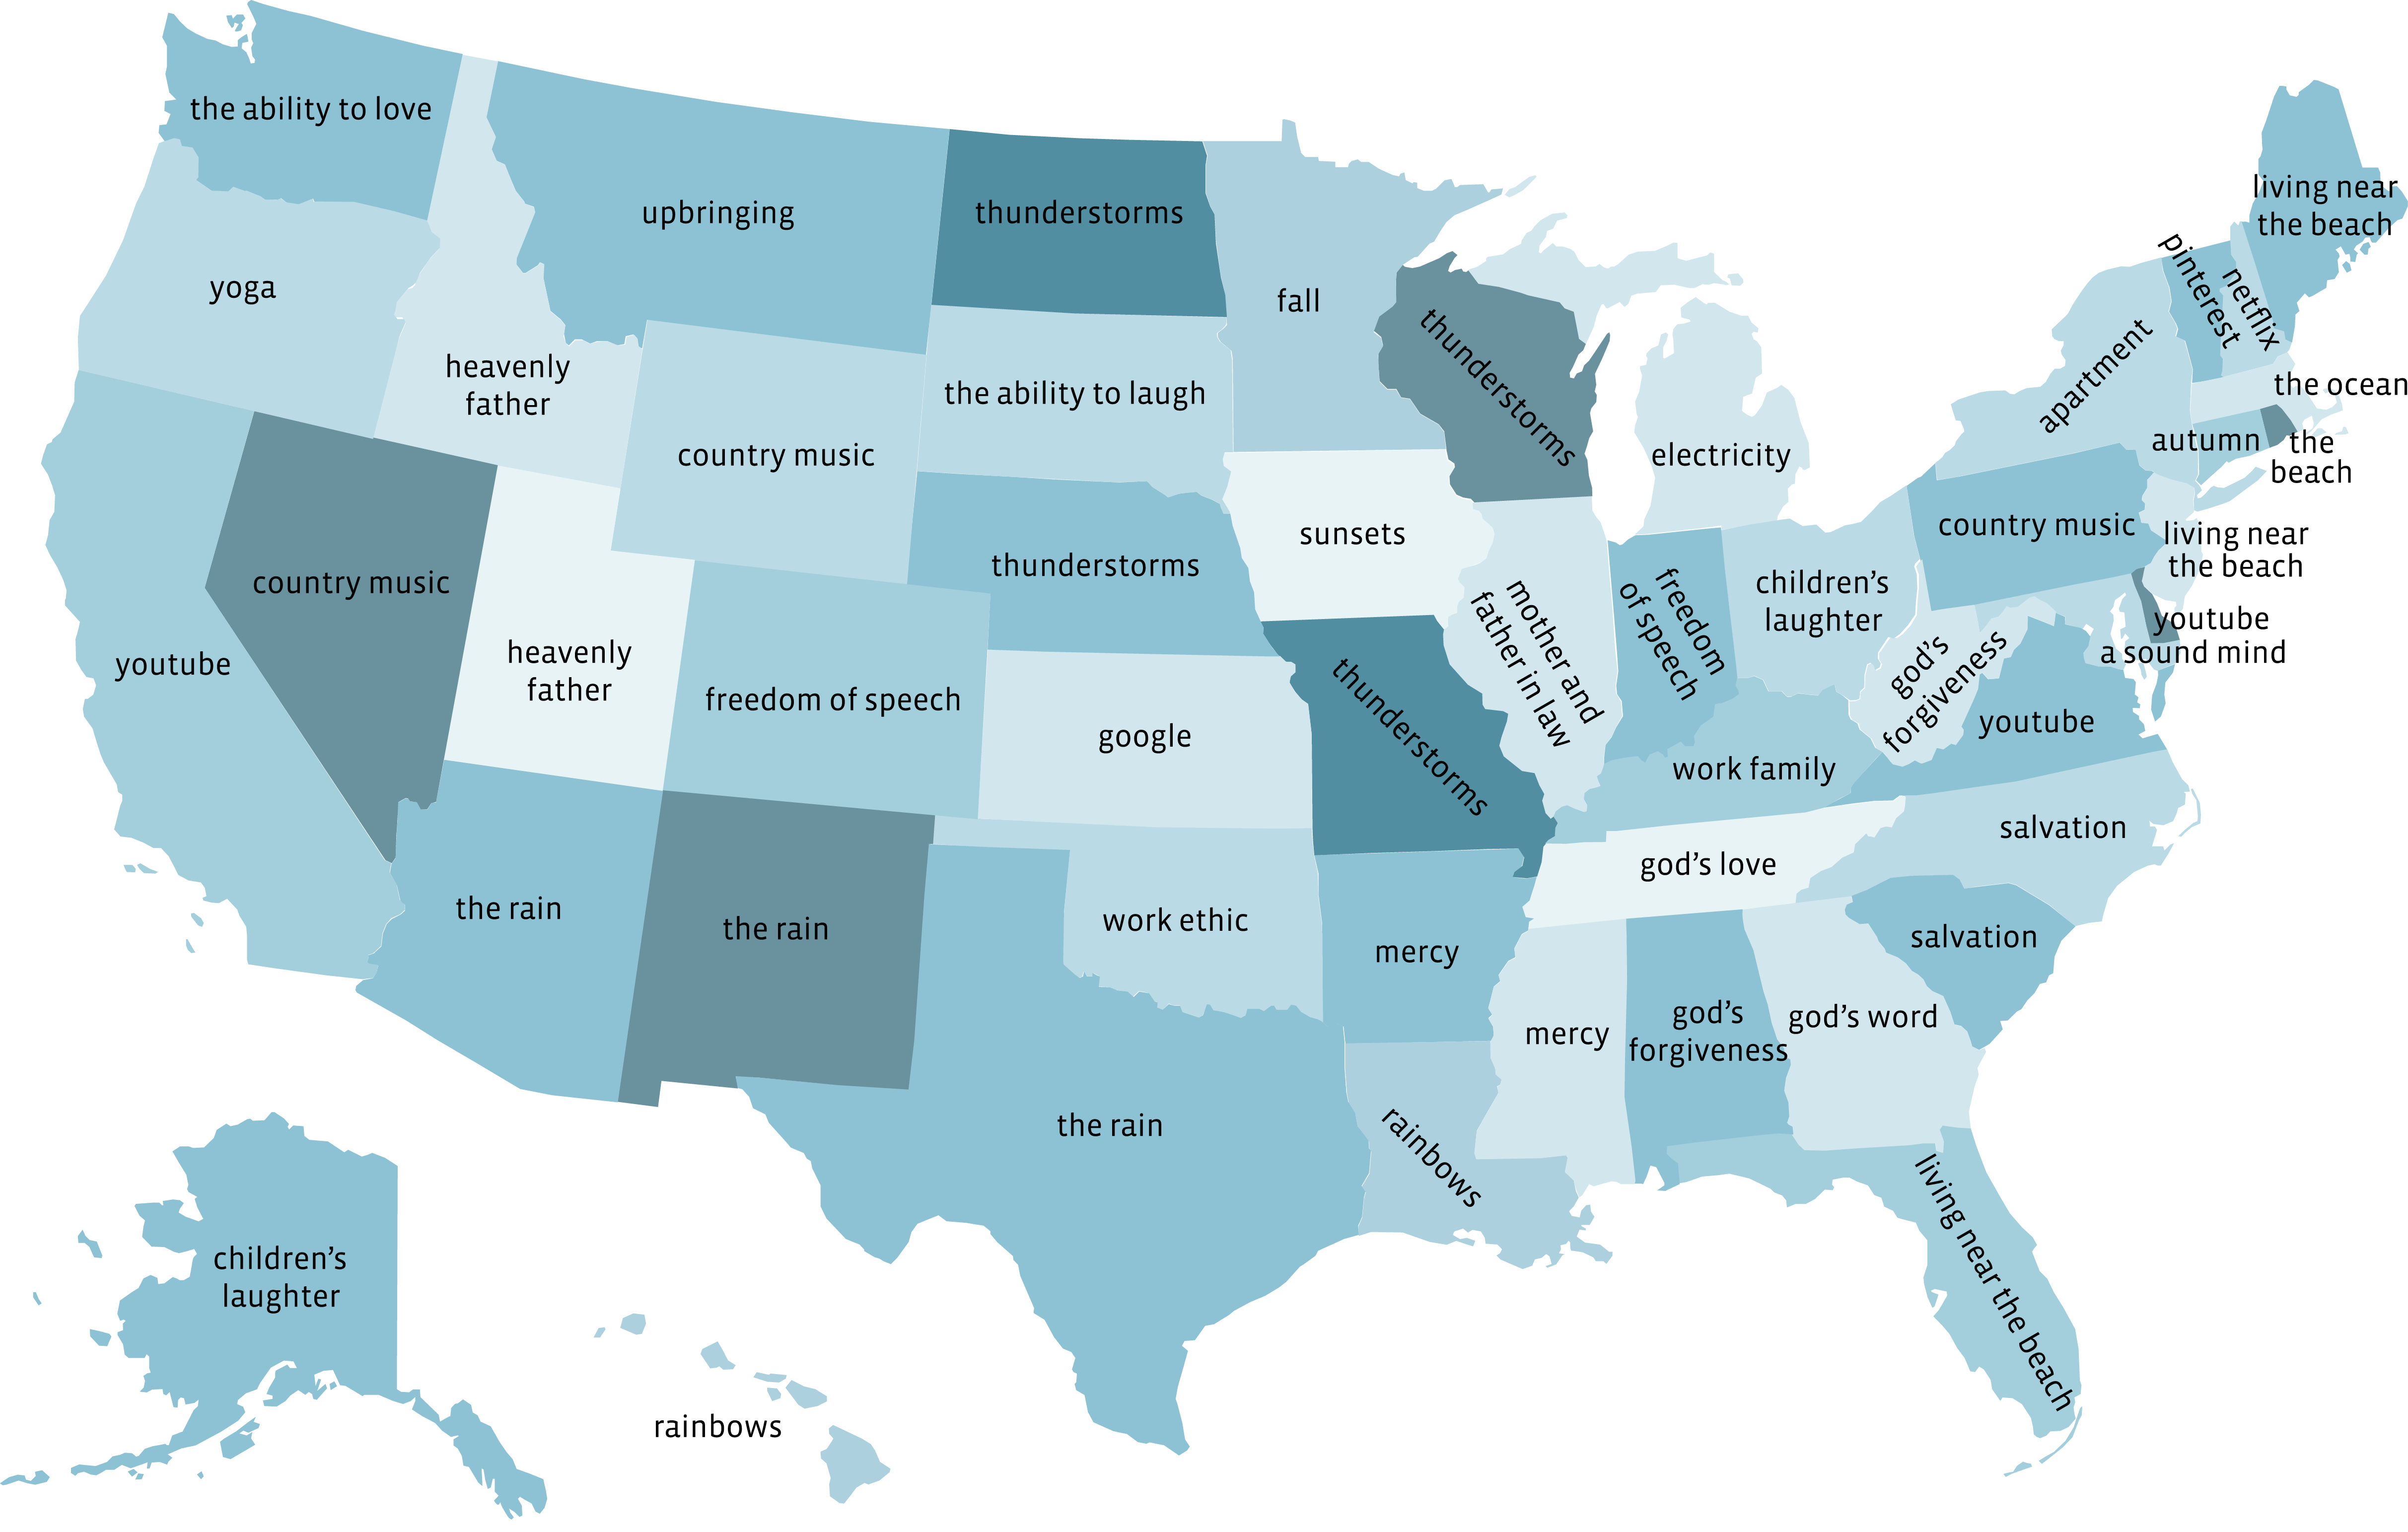
14. What are we most thankful for according to Facebook’s data?
source: Facebook


