#Business #Ideas

TomTom’s iPhone App update to version 1.8 with Multi-Stop routes


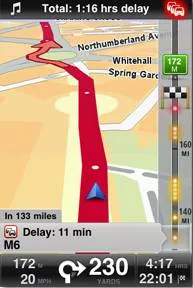
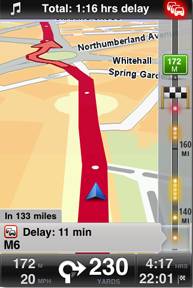
There was a new update to TomTom’s iPhone App released yesterday. Version 1.8 was complement with new Multi-Stop Routes functionality. It means that you can add up-to five extra points to your route without recalculating it, so you can for example pick up friends and visit places of interest more easily – and you only need to plan your route once.
Many bloggers (including Engadget) wrote that with this update TomTom releases HD Traffic data to iPhone. Dear bloggers TomTom HD Traffic service is available in the AppStore at least from March 2010!!!

After acquiring TeleAtlas – one the world biggest producers of geographic data – TomTom became undeniable leader on the GPS Navigation market. With it’s innovative products TomTom’s mission “to reduce traffic congestion for all” becomes possible.

source: TomTom
Say thanks for this article (0)
The community is supported by:
Become a sponsor
#Business
#Business #Featured
Introducing Planet Insights Platform: Easier, Faster, and More Cost-Effective Insights
Avatar for Sponsored Article
Sponsored Article 06.14.2024
AWESOME 1
#Business #Featured
Global Top 100 Geospatial Companies – 2024 Edition
Avatar for Muthukumar Kumar
Muthukumar Kumar 01.31.2024
AWESOME 10
#Business #Featured #GeoDev #Ideas #News
Bee Maps: Creating a Buzz in the World of Fresh, Affordable, and Real-Time Mapping Solutions
Nikita Marwaha Kraetzig 11.5.2024
AWESOME 4
Next article
#Ideas #Science

The art of geographic data

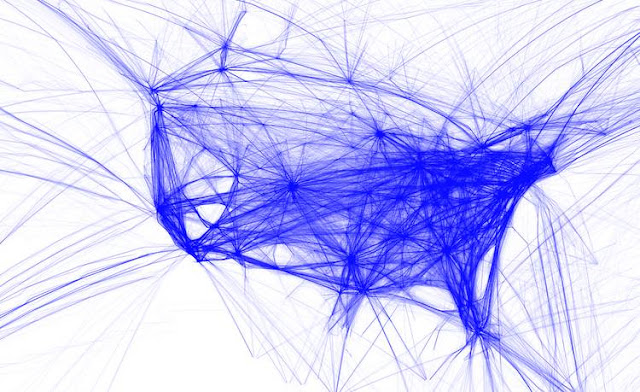
Geographic data which we know are mostly rasters or vectors. Tables. Attributes. Numbers. All very analytic. For some people boring. But is there a beauty in it? Not a beauty for a scientist but in a general sense… Is there an art of geographic data? Aaron Koblin – artist specializing in data and digital technologies – proved that its true. In his project called ‘Flight Patterns’ Koblin visualized airplane traffic over North America over 24h.


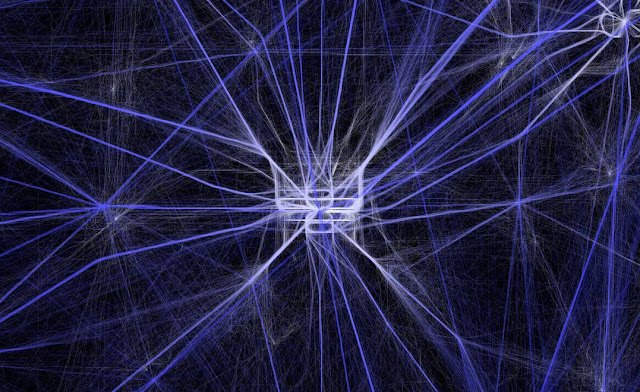
And the image of Atlanta International Airport:


We can see how the pattern is changing over time due to different time zones of east and west US.


Do you still have any doubts that geographic data can be an art?


source: Aaron Koblin

Read on
Search