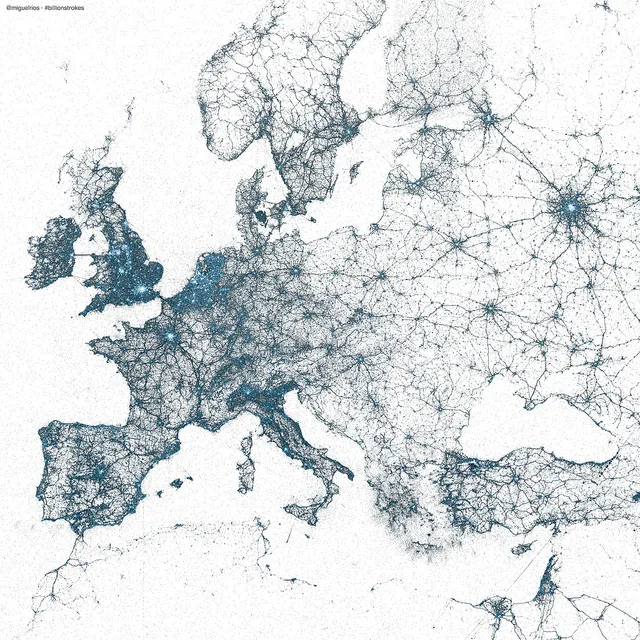

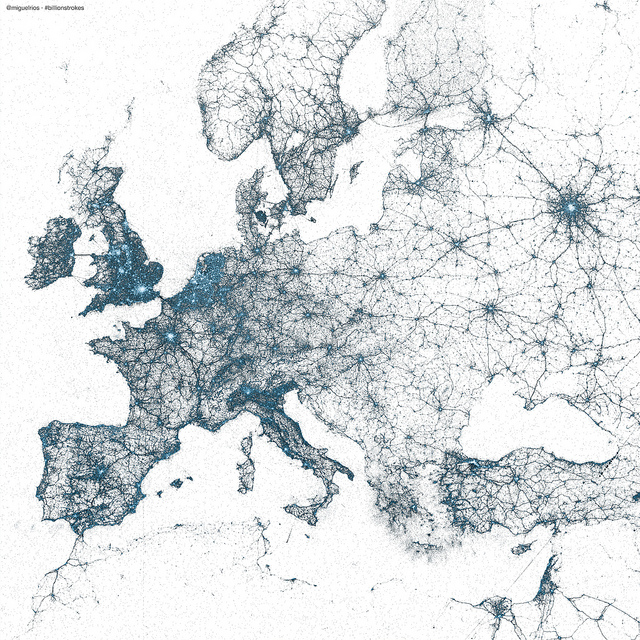
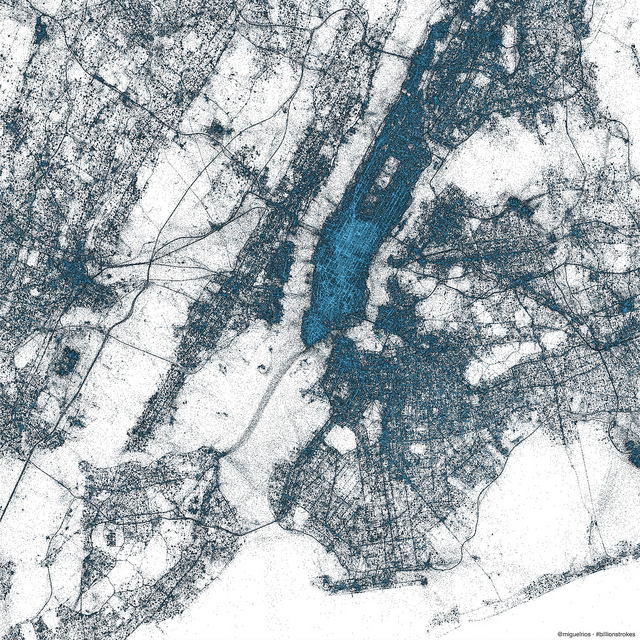
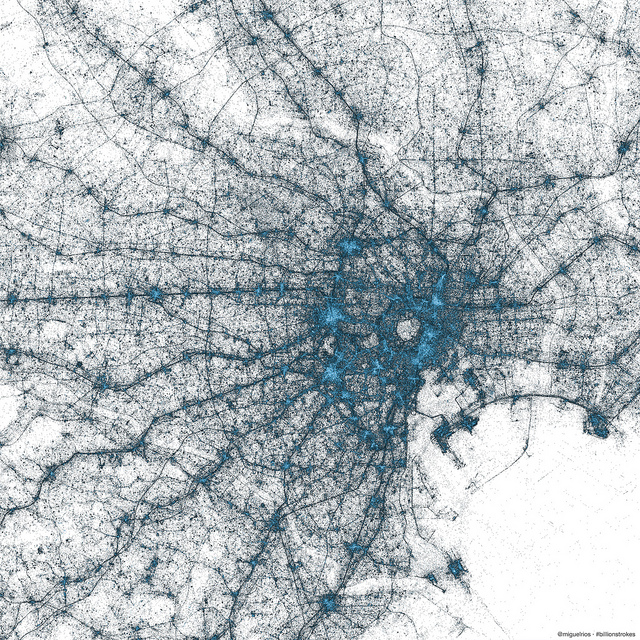
My first impression… wow. Every single geotagged tweet since 2009 was mapped by Visual Insights team at Twitter. Every dot represents a tweet, with the brighter colours showing a higher concentration of tweets. It’s truly amazing that it’s enough data to map the whole world. These are just tweets no other data layers…
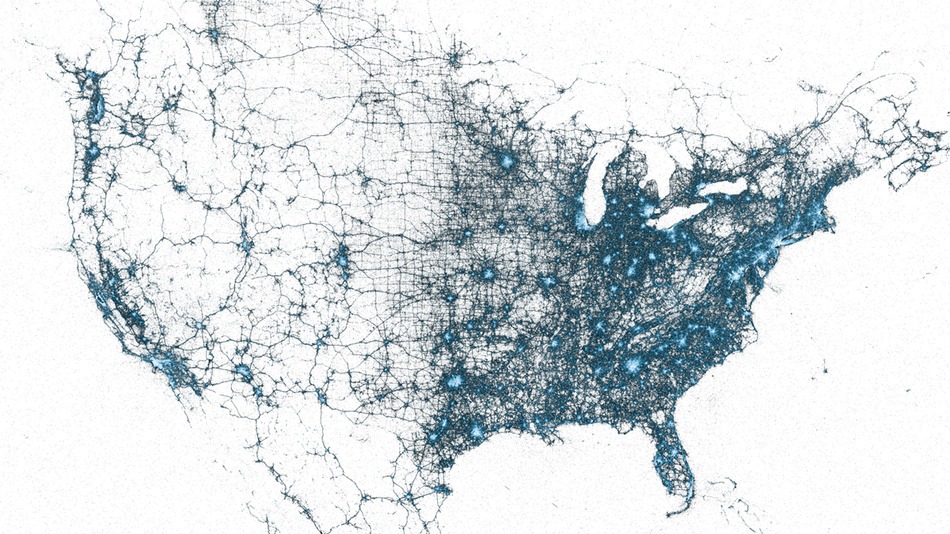
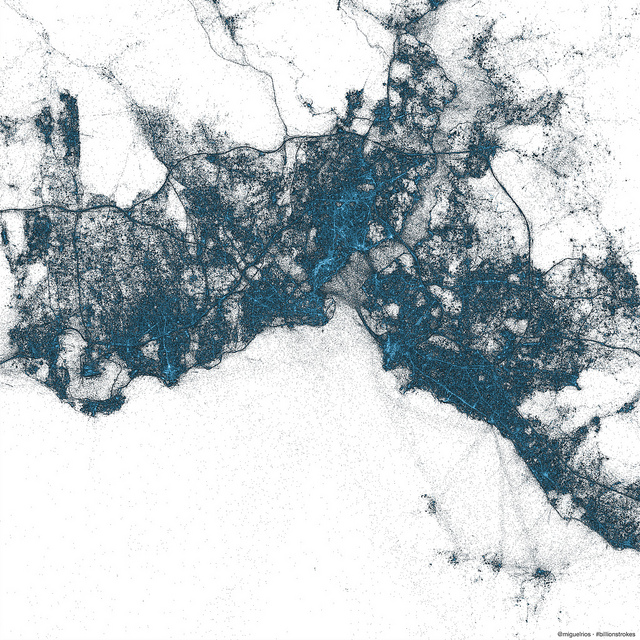
Below you can find tweets mapping Europe, USA, Istanbul, New York and Tokyo. You can find more places at Twitter flickr profile here.
Europe:
USA:
Istanbul:
New York:
Tokyo:

#Ideas

Next article
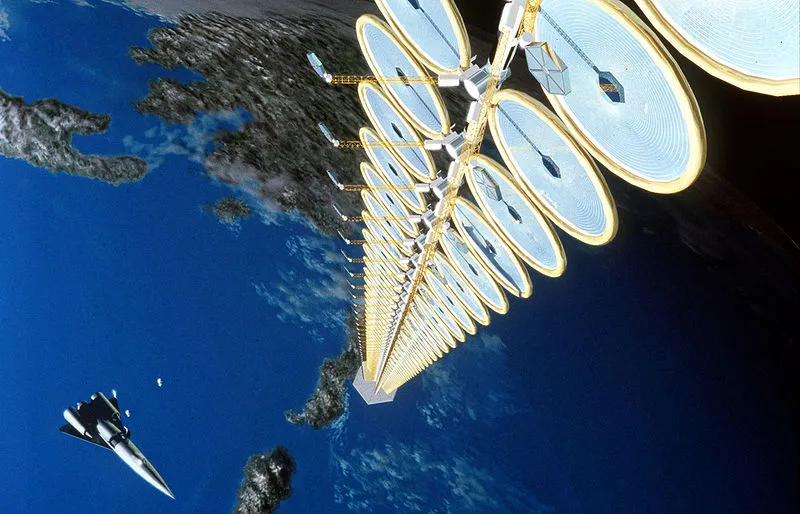
Space-based Solar Power: In the future We’ll have satellites that beam energy back to Earth


NASA’s Sun Tower Concept
Solar energy has often been regarded as one of the permanent and clean solutions to the ever increasingly demand for energy in the Industrialized world that we have inherited. This idea becomes geo-awesome when they visualize sending satellites to outer space that will enable tapping solar power and beaming it down to Earth! “Star Trek” inspired engineers, aren’t they?!
Although this idea has been around for a while now, the grandiose plan was quickly dismissed citing lack of technology and more importantly economic feasibility. Now, one of the Space pioneers and Former President of India, Dr. Kalam has unveiled an ambitious plan for an internationally developed Space Solar Power (SSP) System
A long-time champion of space-based solar power, Kalam says first steps will include the establishment of a “world space knowledge platform” under which specialists from the U.S., India and other spacefaring nations will join forces to develop a “societal” SSP mission. “This World Space Knowledge Platform, which is to be an International Virtual Laboratory, will take the form of a coalition of leading academic institutions in space and energy science and technology, [with] one or two in each of the partner nations. Guided and coordinated by the World Space Knowledge Platform’s International Advisory Committee, they would be directed toward bringing out an International Feasibility Study for SSP,” says Kalam. Source: AviationWeek.
In the past, NASA, JAXA and other space agencies around the globe have proposed several ideas that never saw the light of the day. To overcome these hurdles, Dr. Kalam is proposing an international venture similar to the lines of the International Space Station.
Satellites and Space stations being designed and built just for the sake of harnessing the solar energy may not be a geomatics dream but surely it is time for us geomatics engineers to start thinking about “Universal Geomatics” 😉 Remote sensing has been used in recent years to identify locations for placing wind turbines and for tapping tidal energy, now its time for us to start thinking of “where to place our Solar Energy Satellites”! Space is the next frontier!

