The Geography Of Economy
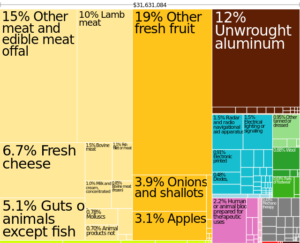
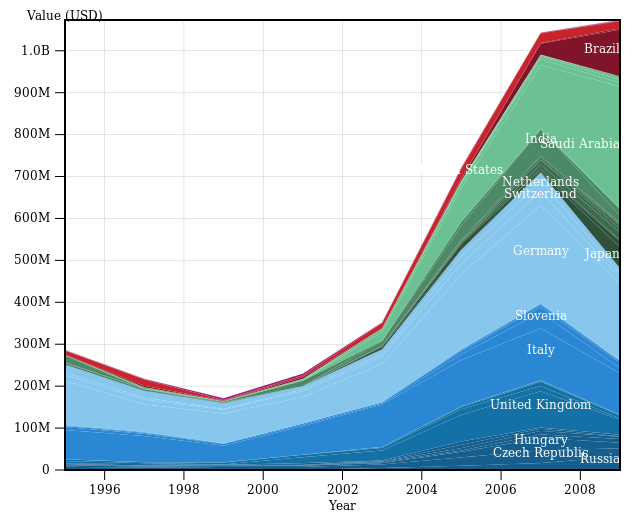
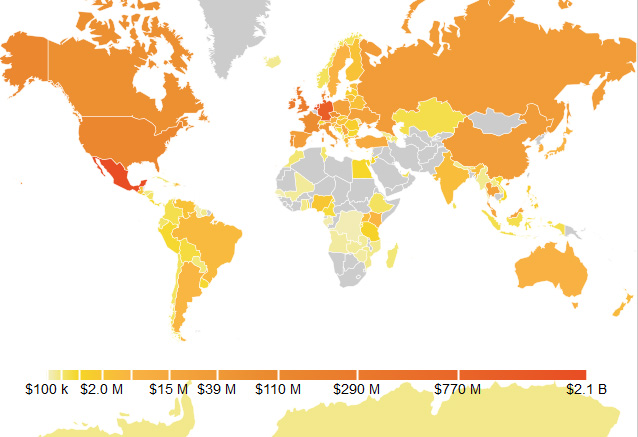
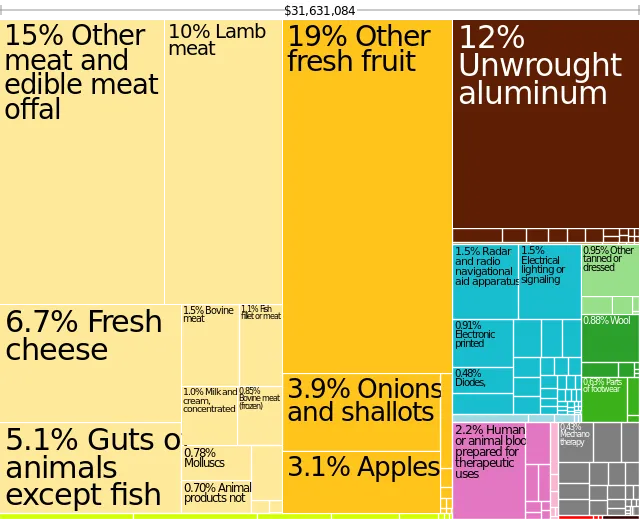
Geography implies movement particularly when spatial data have a temporal component. Macro-economical data present such a sort of information as imports and exports from origin to destination create moving tracks. We know these trajectories for instance from the tracks of ships on the oceans. MIT Media Lab worked on a tool that allows composing a visual tale about countries and products they exchange (import/export). It provides five different kinds of visualisation, which can be the traditional presentation of geographic data as choropleth maps but also proportional illustrations of good exchange between countries that allow a sensation of thematic scale. The open source tool is called the Observatory of Economic Complexity and uses bilateral data of roughly 200 countries, 50 years and around 1000 different products. I wanted to confront the common portrayal of spatial data as cartographic maps and thematic visualisation of information, which this tool is powerful to show. Please, see some examples at the bottom.
Website of project and source: http://atlas.media.mit.edu/
