Texting while Driving? GPS-enabled App on your phone will shut you off!
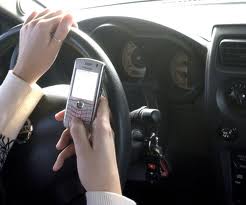
 If you are one of those folks that like multitasking while driving, especially texting while driving, ouch!, this might not be a good news for you but it is meant to save you a lot of danger and trouble.
Researchers have come up with a smart mobile App that is ever prepared to automatically shut off your ability to text, when you are making any attempt to do that behind the wheel because it knows you are driving.
This was made possible through the seamless integration of geospatial technologies (GPS), Smart phone keystroke analysis algorithm and other data.
Really awesome discovery, the article below couetesy of Larry throws more light to how this stuff works. Have fun!
“People have gotten good at multitasking, butsometimes this skill is taken too far, and the result can be deadly. Texting while driving a car is a prime example. Laws prohibit it, but many people still find it impossible to resist. Ideally, there would be a way to eliminate the temptation altogether, through safeguards on the cell phone itself. At the moment that’s not possible, but it may soon be.
Researchers at Pacific Northwest National Laboratory (PNNL) are studying how software on a cell phone could analyze keystrokes to determine when that phone’s user is distracted while composing and sending text messages. This doesn’t necessarily mean the person is driving, of course, but combined with GPS and other data, it may be possible to determine when a texter is behind the wheel. In that case, the phone could shut off texting functions automatically. Such a feature could take the form of a mobile app for any phone—independent of the manufacturer, operating system and wireless service provider.
“If you think of your brain as a CPU, multi-tasking means your brain is dealing with a large amount of information,” says Mike Watkins, manager of applied physics at PNNL, operated by the U.S. Department of Energy’s Office of Science. “Related to texting, even if you don’t have to look at your cell phone screen, you’re still cycling those mental resources.”
Such “cognitive timesharing” behind the wheel isn’t anything new—car stereos, argumentative passengers and even eating all contribute to distracting drivers. But texting is especially problematic because it involves manual, visual and cognitive distraction simultaneously. Sending or reading a text takes a driver’s eyes off the road for 4.6 seconds, according to the U.S. Department of Transportation’s National Highway Traffic Safety Administration (NHTSA), which estimates that at 88 kilometers per hour—the U.S. speed limit in many areas—such a lapse in concentration is like driving the length of an entire football field while blindfolded.
The NHTSA estimates that in 2010 more than 3,000 people were killed and 416,000 others injured in road wrecks caused by distracted driving in the U.S., including crashes involving texting or other cell phone use. In response to the larger problem, the NHTSA earlier this week announced a new grant program to provide about $17.5 million to states that have enacted and are enforcing anti-distracted driving laws, including anti-texting statutes.
The PNNL researchers are hoping their work can help in ways that laws cannot—using the phones themselves to flag those who can’t resist the impulse to text and drive. They tested their approach in a limited study a few years ago by analyzing the behavior of six study participants who were instructed to text while operating a driving simulator.
The texters used a Nokia model 6790 Surge phone that logged the duration and sequence of keystrokes during a 20-minute texting session and then during a 20-minute texting session while using the driving simulator. During simulated driving, the texters used several techniques to tap out short messages: by placing both palms on top of the steering wheel while texting, by using a single hand to text, and by taking both hands off the steering wheel and returning them intermittently to make steering corrections. Drivers would drive off the road, run red lights and commit other acts of poor driving, being tracked all the while.
The researchers then investigated the potential to use various keystroke dynamics as a means of determining if an individual was texting while driving. In particular, they focused on “keystroke entropy,” when keys were struck at irregular intervals, as an indicator that the test subjects’ attention was divided between texting and driving.
After evaluating the sensitivity of the keystroke entropy indicator against the number of keystrokes recorded, the researchers found they could accurately and relatively quickly identify when a test subject had been both texting and operating the simulator. They found normal texting took on more rhythmic patterns.
The study is limited, Watkins acknowledges, because it used so few participants and a simulator as opposed to an actual car. He and his colleagues are hoping to expand their test to drivers on a closed course, where safety would be more of a concern to participants.”


