#Ideas

Strava fitness app shows 100m runs and rides on a single map

Strava Geoawesomeness

Strava is a San Francisco-based start-up founded in 2009. It offers cycling and running tracking apps for multiple platforms. Although Strava works in a similar way to Endomondo and other fitness tracking apps, it managed to gather relatively large community. While they won’t reveal how many people use the app, they claim to be tracking over 1 million activities per week around the world. Not bad.

DATA, DATA, DATA

Similarily to Foursqaure guys at Strava seem to be understanding that their value is not only the app itself but also the data generated by its users. While Foursquare with 40 mln user base shifted its business towards Big Data, Strava has just started to explore this area offering a data service for city planners and departments of transportation which usually lack data about cycling and pedestrian route preferences.

COOL MAP

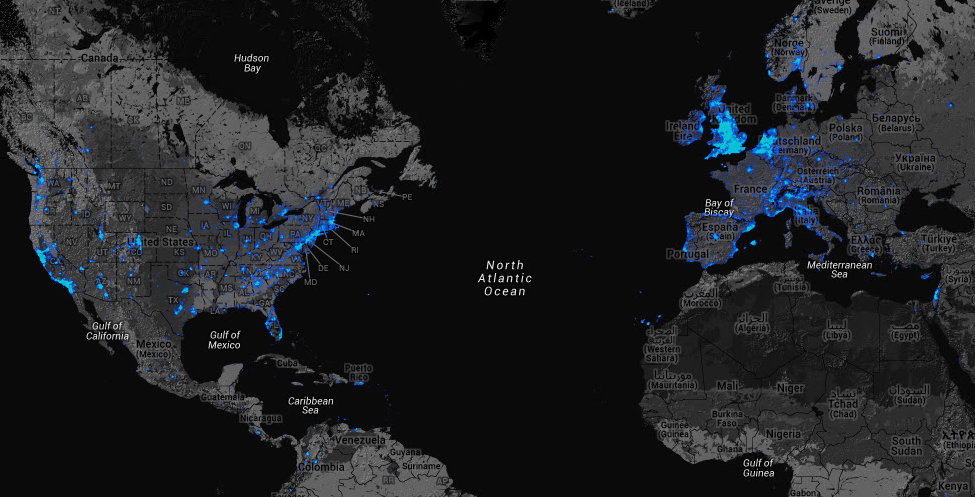
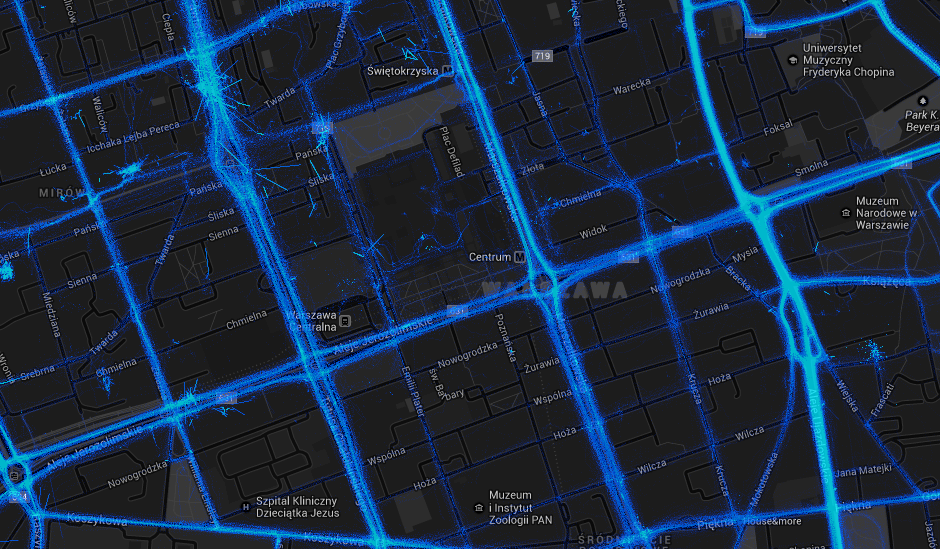
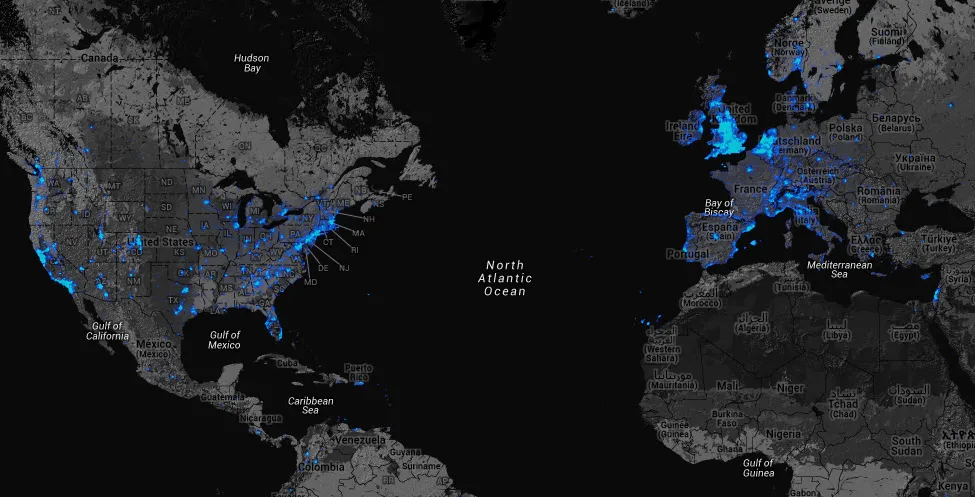
With having this in mind Strava released a really cool heatmap of global 77,688,848 rides and 19,660,163 runs. The map is based on Google Maps API. You can browse the data from all around the world, so you can also check your neighbourhood. In fact what you see is over 220,000,000,000 GPS data points displayed on a single map.

Strava Warsaw Geoawesomeness

Say thanks for this article (0)
The community is supported by:
Become a sponsor
#Ideas
#Business #Featured #GeoDev #Ideas #News
Bee Maps: Creating a Buzz in the World of Fresh, Affordable, and Real-Time Mapping Solutions
Nikita Marwaha Kraetzig 11.5.2024
AWESOME 4
#Contributing Writers #Fun #Ideas
Exploring New Geospatial Features on Google Maps
Sebastian Walczak 09.3.2024
AWESOME 2
#Contributing Writers #Environment #Ideas #Satellites #Science
Using SWOT Mission Data: Monitoring South Asian Rivers During Monsoon Season
Sebastian Walczak & Nikita Marwaha Kraetzig 10.19.2024
AWESOME 0
Next article
#Ideas

The Meteoroids Map from NASA: Never miss a meteoroid again!

ASGARDMeteoroids are always a source of curiosity and fascination. A celestial phenomenon that has been around perhaps since the beginning of time, an event that inspired a popular notion “Make a wish when you see a shooting star”. Ever wondered, what was that bright ball of fire?  how many meteoroids are visible each day in the night sky? Well, looks like now we have a website with a truck load of information that will delight and enlighten us.

NASA’s All-sky Fireball Network setup by the Meteoroid Environment Office to observe meteoroids and construct a model of the meteoroid environment is a network of 12 cameras spread out over North America that capture images of the night sky. The images from this network is then processed using All Sky and Guided Automatic Realtime Detection (ASGARD) software which detects meteors in real-time and automatically analyzes them. The result is a stunning and informative website for real-time meteoroid map for the entire planet – The ASGARD Web Log.

Meteoroids

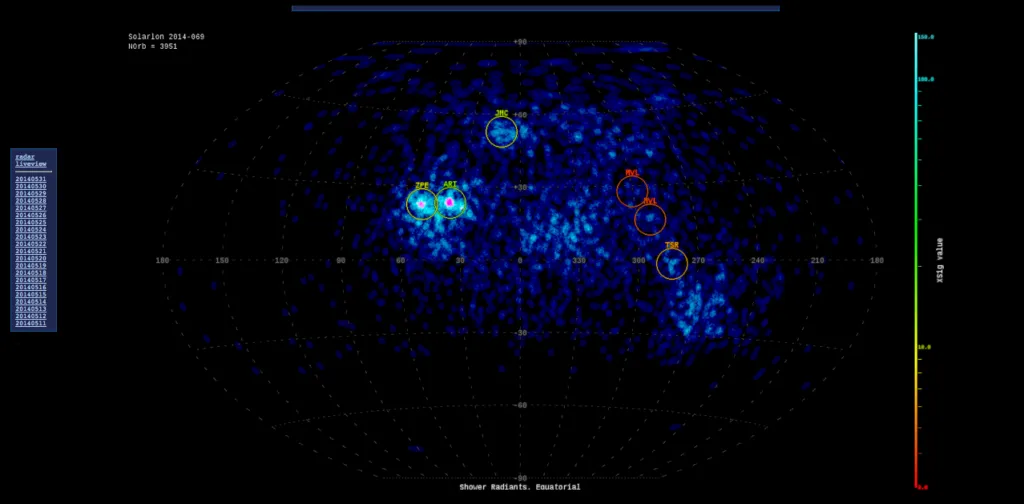
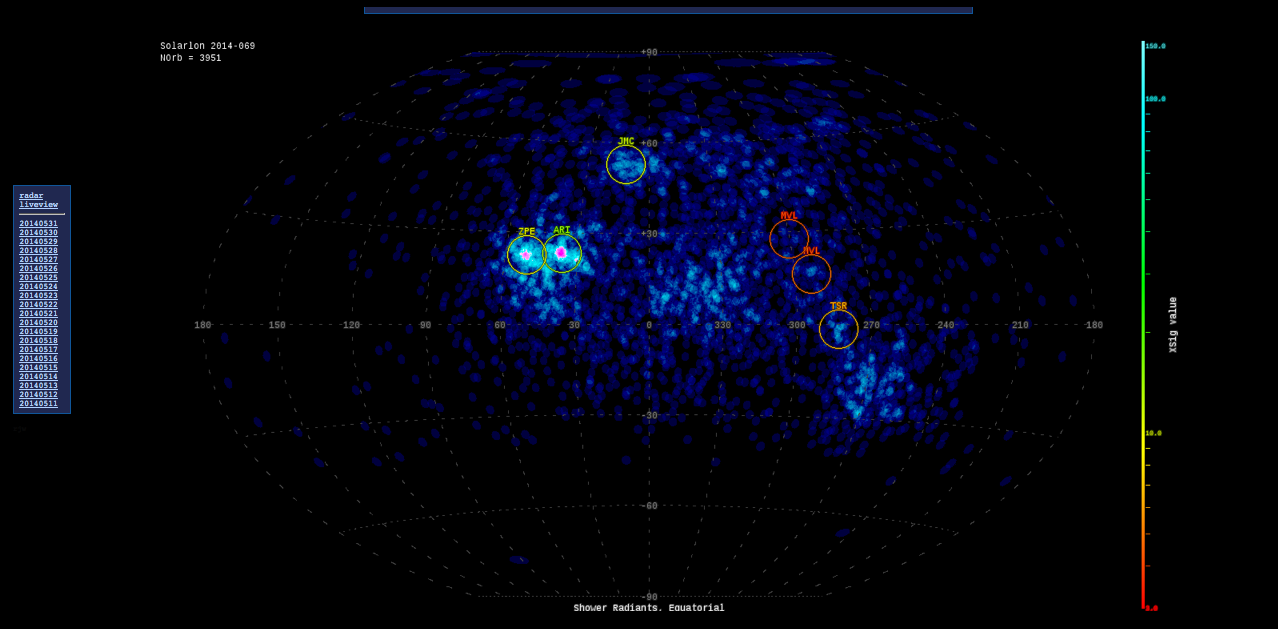
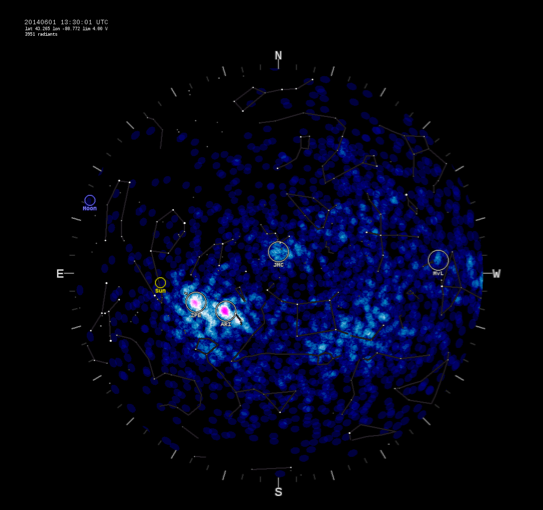
The AGCARD Web Log provides information regarding the fireballs in several different formats – Images, Videos and Text information regarding the orbit and has a repository of information for the last 3 weeks. In addition to the cameras, the MEO also utilizes a RADAR; Navigate to the RADAR option on the homepage for a real-time plot showing the locations of meteoroids as detected by the multi-station Canadian Meteor Orbit Radar (CMOR).

The answer to the question, how many meteoroids are observed each day – the CMOR measures approximately 4000-5000 individual meteoroids every day!

The Meteoroids Map from NASA: You’ll never have to miss a meteoroid again! That’s a wish come true 🙂

Read on
Search