
Elevation data plays a role in many aspects of the modern geospatial world. Regardless of the project, whether it is flood risk modeling, wind farm planning, infrastructure design, or 3D city visualization, a Digital Elevation Model is essential. These datasets serve as a representation of Earth’s surface. Beyond the acronyms DEM, DTM, and DSM, there is a story of technological innovation, precision, and perspective.
Why Elevation Data Matters
Every process that interacts with terrain — from water flow and erosion to urban expansion and renewable energy siting — depends on accurate elevation data. For hydrologists, it defines watersheds and flow direction. For engineers, it helps plan roads and pipelines. For environmental scientists, it reveals how ecosystems respond to landform changes.
In the age of digital twins, self-driving vehicles, and satellite-based climate monitoring, elevation is no longer just a background layer. It’s an active data dimension that influences predictions, decisions, and design.
The History of DEMs
The concept of a Digital Elevation Model (DEM) dates back to the late 1950s, when cartographers at the U.S. Geological Survey (USGS) began digitizing contour maps to calculate terrain heights automatically. Early DEMs were coarse and limited in extent, but the foundation was set: terrain could be represented as numbers.
The real breakthrough came with satellite radar missions. In 2000, NASA and the German Aerospace Center (DLR) launched the Shuttle Radar Topography Mission (SRTM) aboard the Space Shuttle Endeavour, mapping 80% of Earth’s land surface at 30-meter resolution. For the first time, near-global elevation data became freely available — a true revolution for GIS and environmental science.
Over the following decades, missions like ALOS PALSAR (Japan), TanDEM-X (Germany), and Copernicus DEM (Europe) pushed spatial resolutions down to meters or even decimeters, enabling applications that were once unthinkable at continental scales.
The Evolution of Digital Elevation Models (DEMs) by Geoawesome
Understanding the Terminology: DEM, DTM, DSM
Let’s clarify the most common acronyms you’ll encounter:
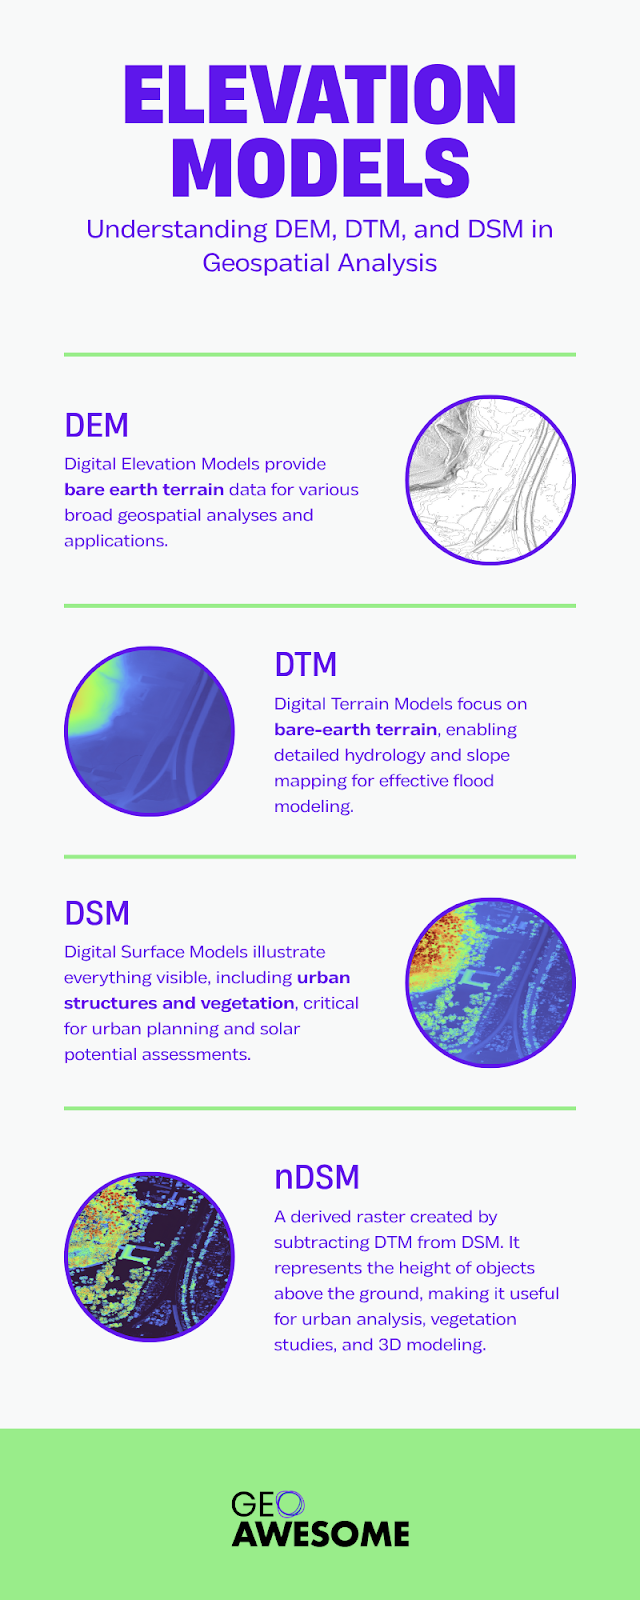
The DEM is an umbrella term, but the distinction between DTM and DSM is crucial.
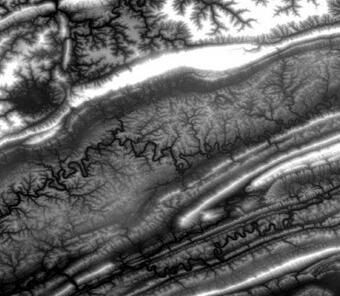
A DTM strips away vegetation and structures, exposing the true ground surface. It’s ideal for terrain analysis.
A DSM, on the other hand, includes canopies, buildings, and infrastructure; perfect for energy modeling, urban design, and LiDAR-based 3D visualization.
Other derivatives worth mentioning:
- REM (Relative Elevation Model) – Depicts elevation relative to nearby water bodies, widely used in floodplain and wetland studies.
- nDSM (Normalized DSM) – The difference between DSM and DTM, representing object heights like trees or buildings.
- CHM (Canopy Height Model) – Used in forestry to estimate canopy height from LiDAR data.
- Bathymetric DEMs – Extend below sea level, integrating sonar or LiDAR bathymetry for coastal and marine mapping.
These variations highlight how DEMs are not just “one dataset,” but a family of terrain representations tailored for specific questions about the Earth’s surface.
How DEMs Are Created
DEMs can come from a surprising variety of sources, each with different strengths and trade-offs:
- Photogrammetry – Elevation extracted from overlapping aerial or satellite images. Accurate and cost-effective for local mapping, but limited by vegetation cover.
- LiDAR (Light Detection and Ranging) – Laser-based systems that deliver sub-meter precision, ideal for DTMs and canopy models. Airborne LiDAR, such as that from USGS 3DEP, sets the benchmark for high-resolution elevation in the U.S.
- InSAR (Interferometric Synthetic Aperture Radar) – Uses radar phase differences from satellites (like Sentinel-1 or TanDEM-X) to derive surface elevation and even detect ground deformation over time.
- Radar Altimetry – Measures elevation along satellite tracks, often used over oceans, ice sheets, or remote regions.
Global DEM products like Copernicus DEM (derived from TanDEM-X) or NASADEM (an enhanced version of SRTM) combine radar data and optical imagery for consistent coverage and improved accuracy.
Private companies such as NTT Data (AW3D), Airbus (WorldDEM), and Maxar Technologies (Precision3D) now deliver global elevation data at resolutions down to 0.5 meters, supporting industries from infrastructure to autonomous navigation.
Where to Get Elevation Data
There’s no shortage of DEM sources today — the key is knowing where to look.
Open and free datasets:
- SRTM – 30 m global coverage, foundational for global-scale studies.
- ALOS PALSAR DEM – 12.5–30 m resolution, global.
- Copernicus DEM – 30 m and 90 m resolution, based on TanDEM-X.
- NASADEM – Updated SRTM data with improved void filling and calibration.
- ArcticDEM and REMA – High-resolution polar DEMs from stereo satellite imagery.
Commercial and high-resolution options:
- AW3D (NTT Data) – 0.5–2 m global coverage.
- WorldDEM (Airbus) – 12 m accuracy from TanDEM-X.
- Hexagon Elevation Data – Detailed topographic and bathymetric elevation models.
- Maxar Precision3D – City-scale elevation from stereo satellite imagery.
Data portals and browsers:
- USGS EarthExplorer – Download DEMs by AOI and time range.
- Copernicus Browser – Explore DEMs and Sentinel datasets online.
- Google Earth Engine – Process and visualize elevation data programmatically.
- OpenTopography – Excellent for LiDAR-based and community DEMs, with on-demand processing tools.
- Terrascope – European hub for Sentinel and DEM data analysis in the cloud.
Each of these platforms enables quick visualization, download, and integration of elevation data into GIS software.
How to Visualize and Analyze DEMs
Once you have your DEM, visualization and analysis are where the real insights emerge.
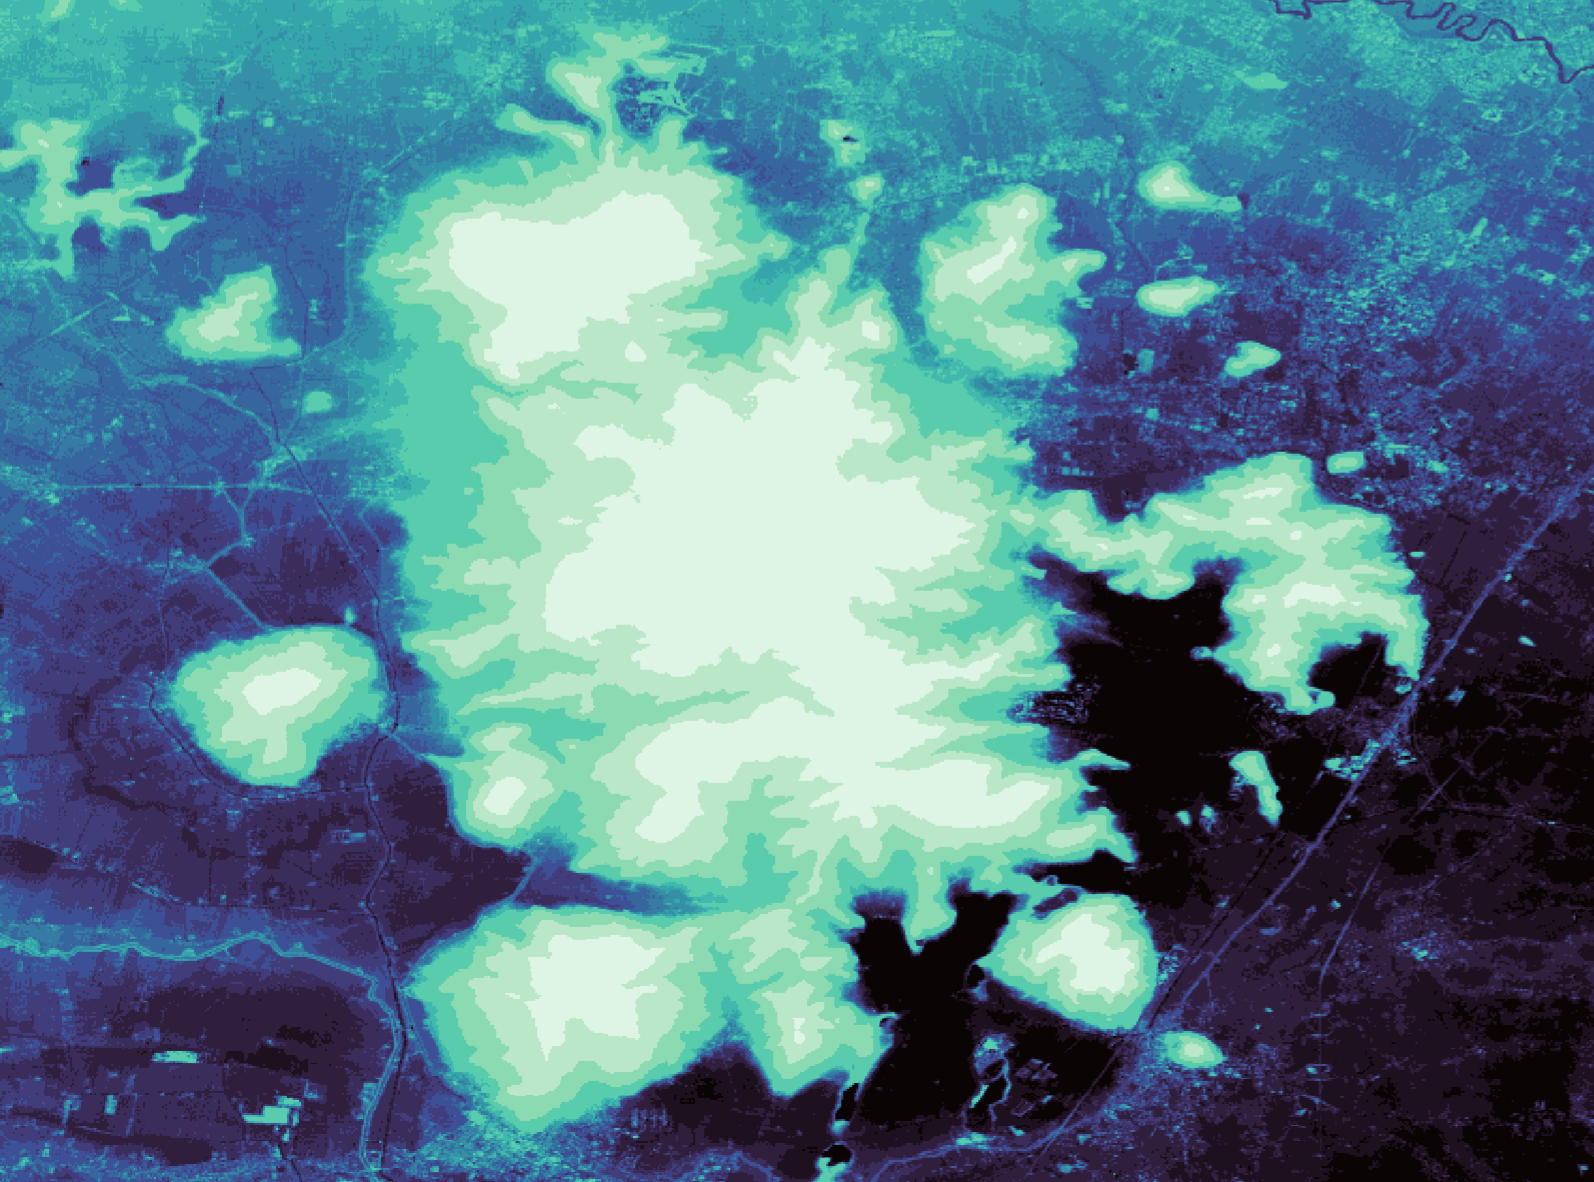
Copernicus DEM, Parco Regionale dei Colli Euganei, Height Map
In QGIS, you can easily:
- Create hillshades for realistic terrain visualization.
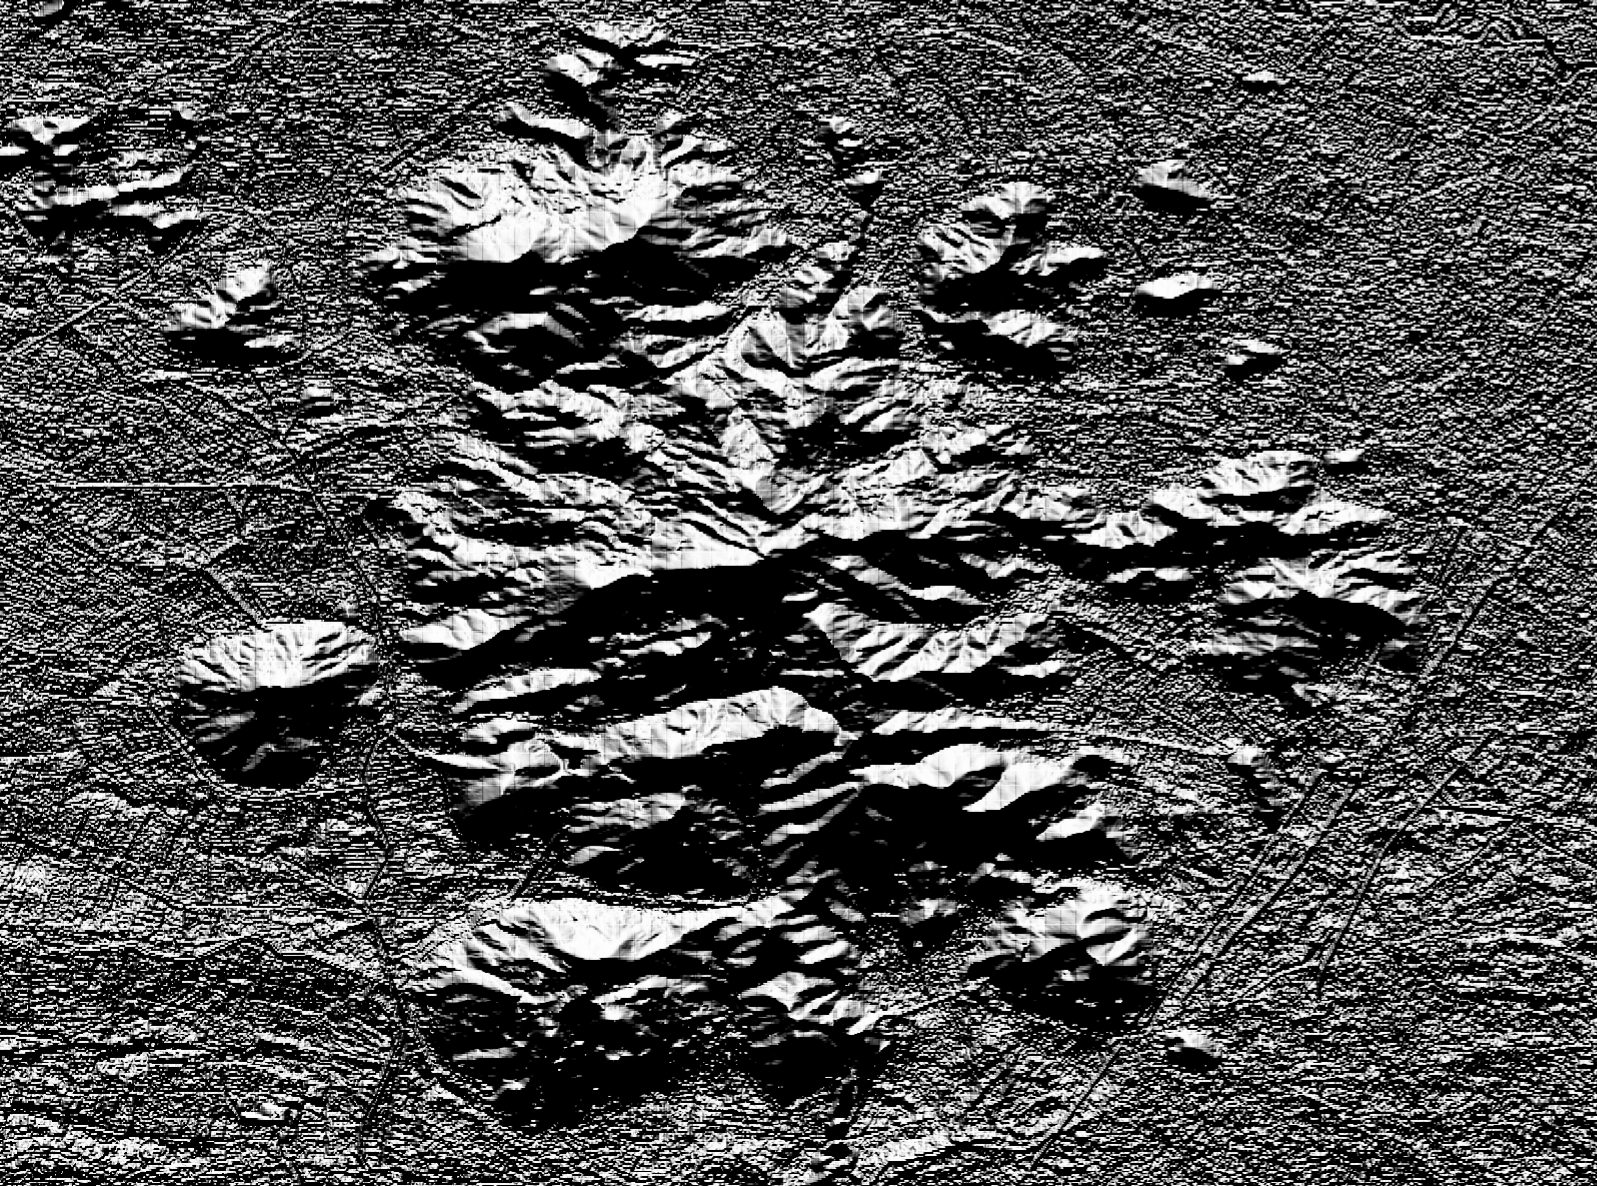
Copernicus DEM, Parco Regionale dei Colli Euganei, Hillshade Map
- Derive slope and aspect maps to understand topographic orientation.
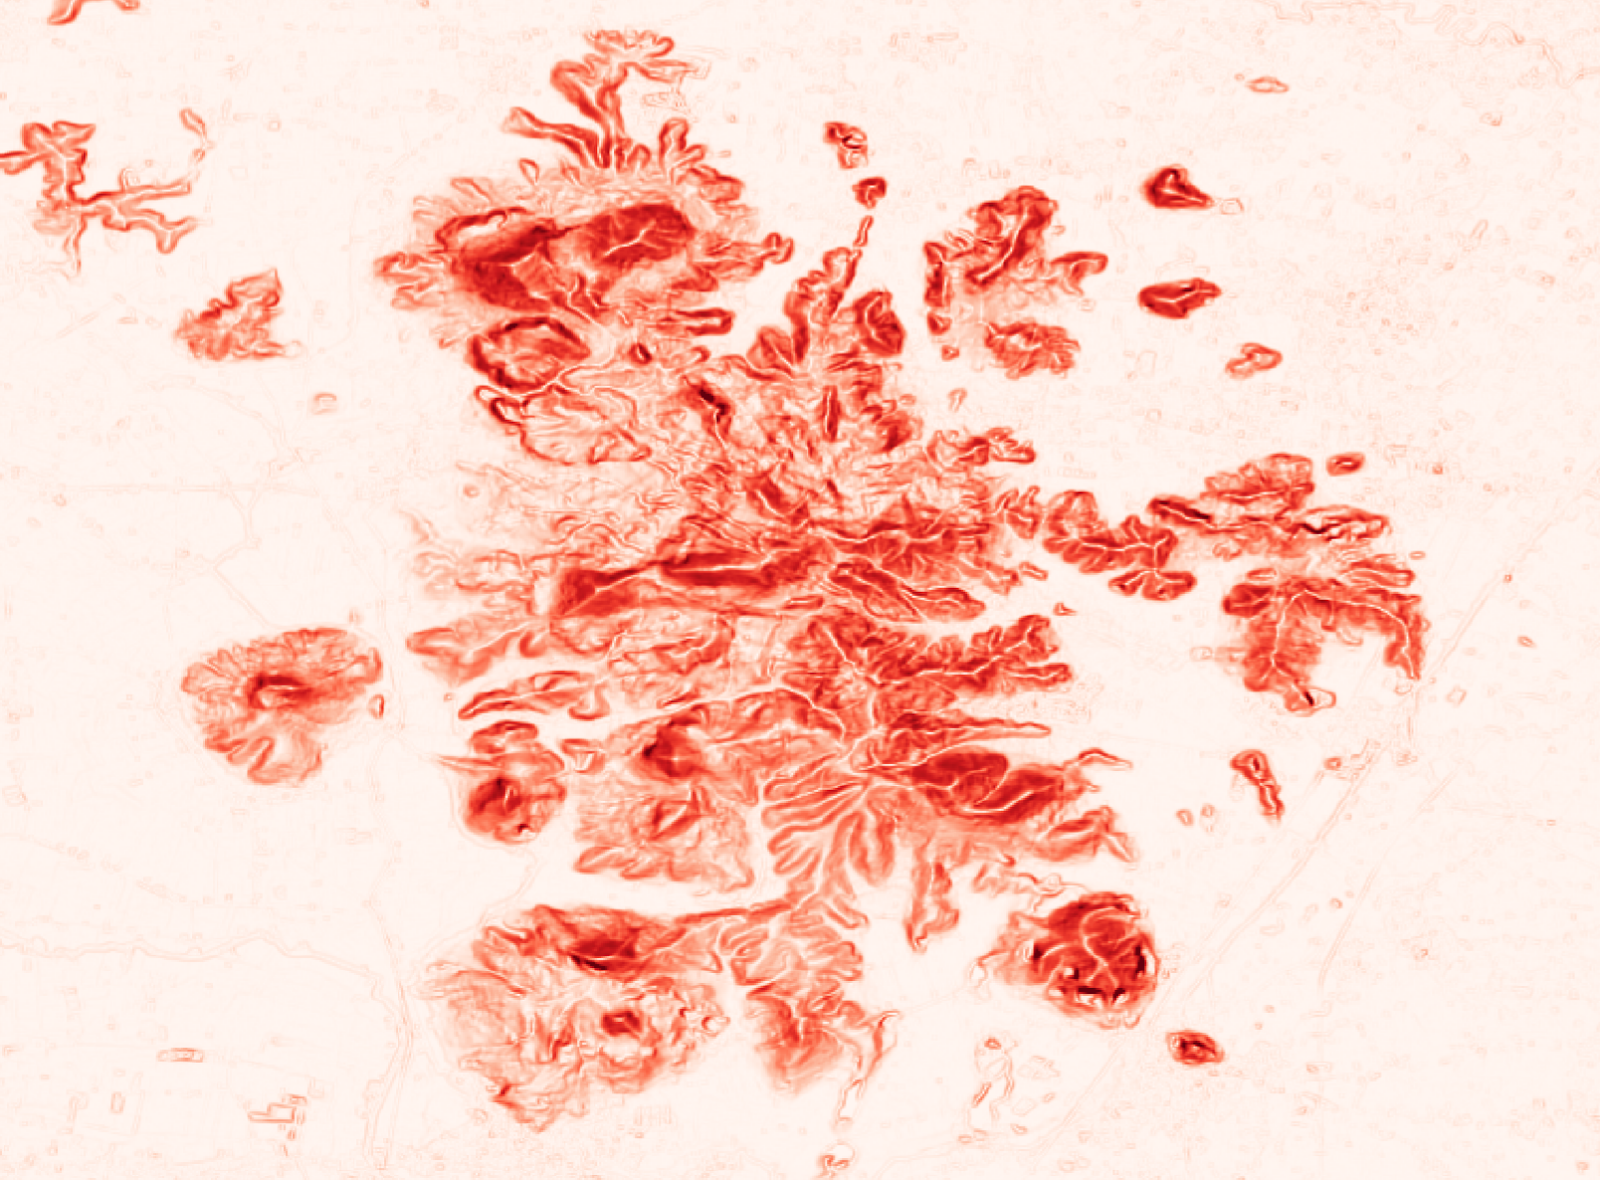
Copernicus DEM, Parco Regionale dei Colli Euganei, Slope Map
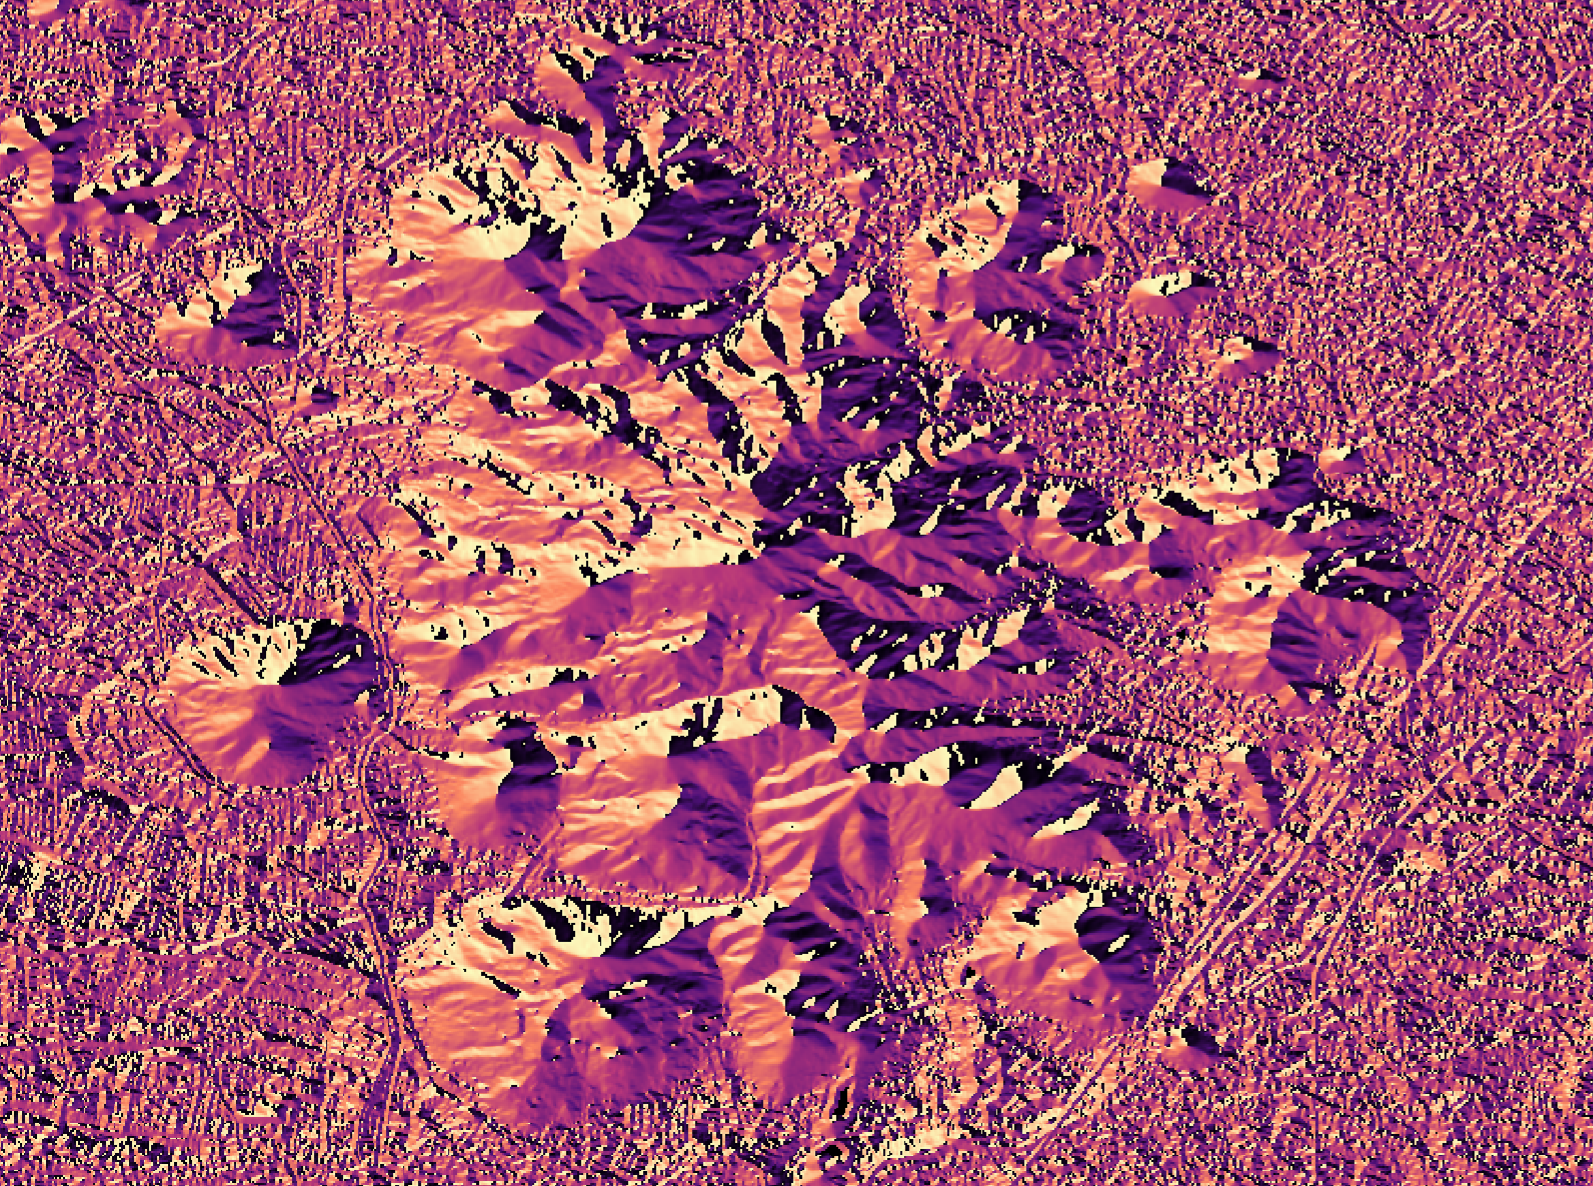
Copernicus DEM, Parco Regionale dei Colli Euganei, Aspect Map
- Generate contours and profiles to represent terrain structure.
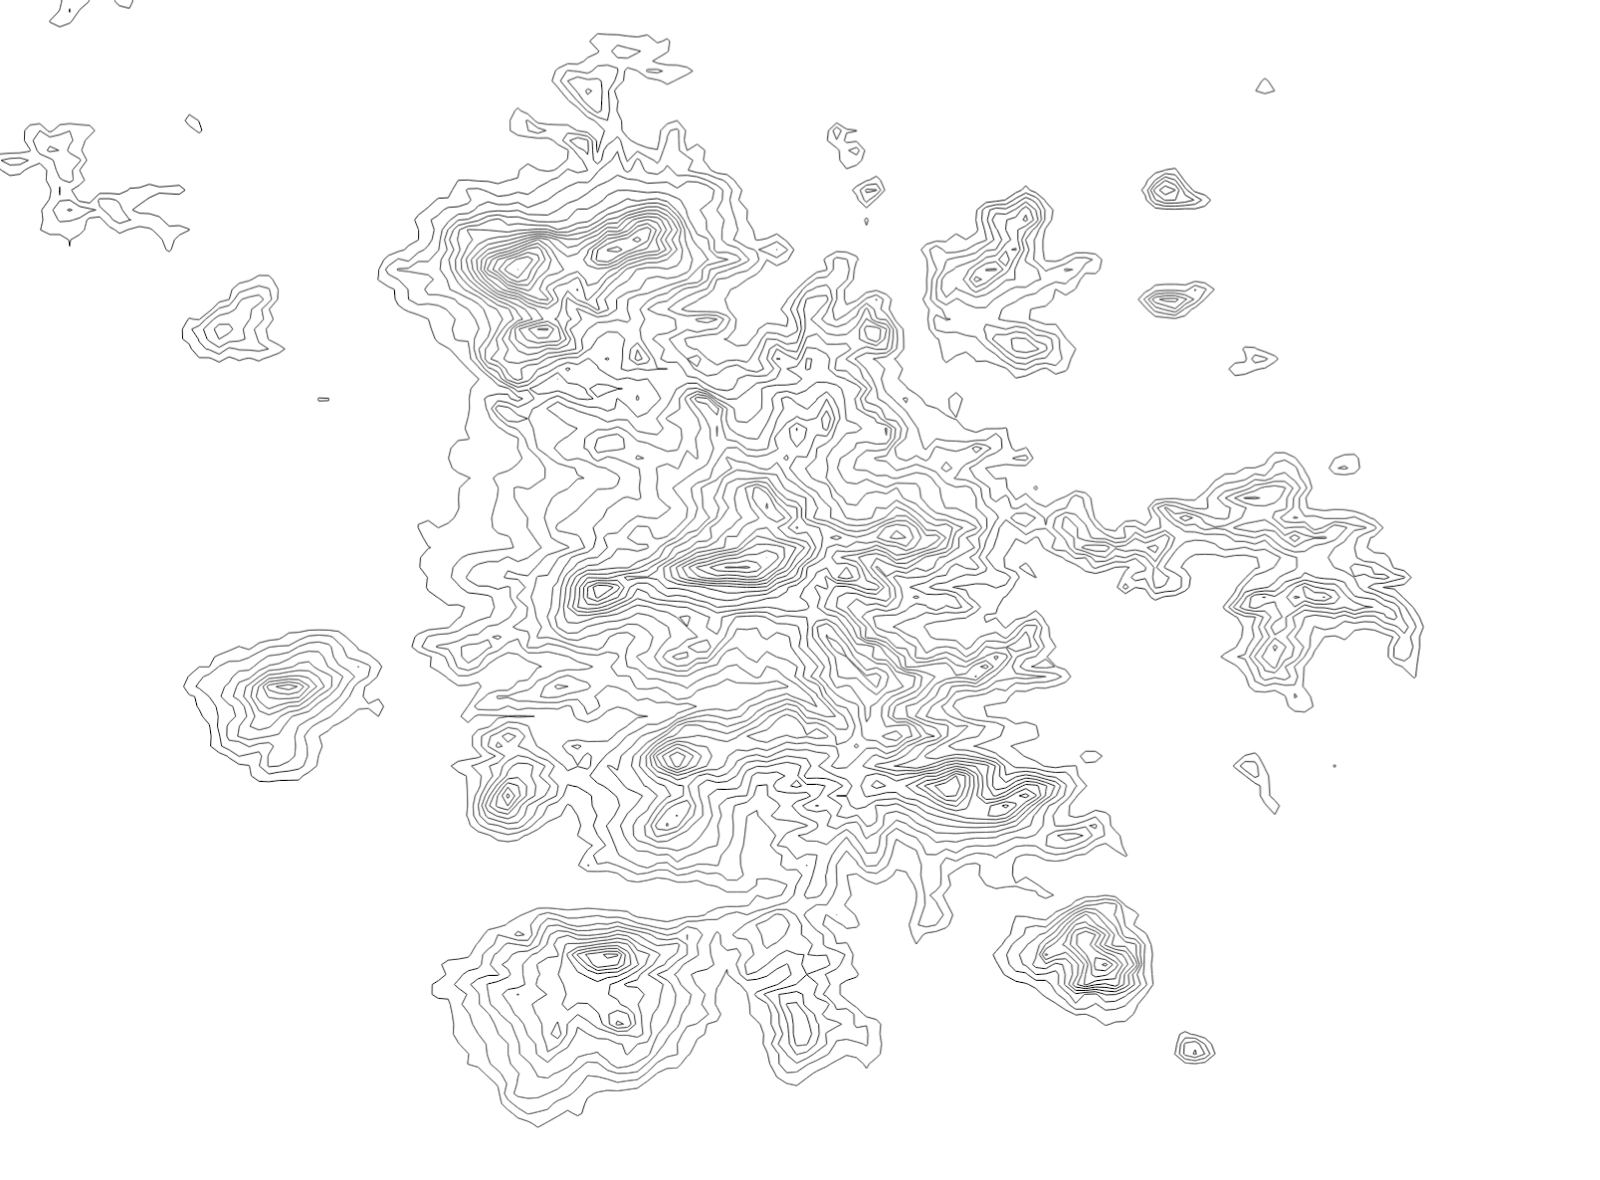
Copernicus DEM, Parco Regionale dei Colli Euganei, Contour Map
Other platforms, ArcGIS Pro or Global Mapper, provide similar functionality with advanced terrain correction, raster algebra, and 3D scene creation.
Elevation in 3D Web Maps
The next frontier for DEMs is interactive 3D visualization. Instead of static maps, users can now explore terrain dynamically in the browser.
- CesiumJS allows streaming and rendering of global terrain datasets, powering digital twins and 3D city platforms.
- Deck.gl integrates elevation data with 3D visual analytics, often used in data storytelling.
- Potree is perfect for point cloud visualization — ideal for LiDAR-derived DSMs.
- Mapbox Terrain and TerriaJS also provide APIs for elevation-driven web mapping.
These frameworks make it possible to build immersive dashboards, from glacier monitoring to infrastructure planning, without specialized desktop software.
The Future of Elevation Data
The next generation of DEMs will be smarter and more dynamic. AI-based enhancement methods are already improving vertical accuracy, noise reduction, and vegetation filtering. Projects like NASA’s Surface Topography and Vegetation (STV) and upcoming TanDEM-L missions promise near-real-time terrain updates.
Meanwhile, open initiatives — such as OpenTopography’s community LiDAR program and ESA’s Open Science initiatives — are democratizing access to high-quality elevation data. Combined with machine learning, these efforts are pushing us toward a future of continuously updated, sub-meter global terrain models.
Every map rests on a foundation of elevation. Whether it’s the slope of a hillside, the rise of a floodplain, or the skyline of a growing city, DEMs define how we perceive and model the physical world. Understanding their differences — and knowing where to find and apply them — is key to unlocking the power of spatial data.
Explore more guides in the GeoGuide Series by Geoawesome and keep building your skills in geospatial fundamentals that move the world forward.


#Ideas


Next article

17 Ways Geospatial Technologies Power the UN Sustainable Development Goals
The United Nations’ 17 Sustainable Development Goals (SDGs) provide a blueprint for tackling global challenges such as poverty, climate change, and sustainable cities. Geospatial technologies — from Earth observation satellites to GIS platforms — play a role in measuring progress, guiding action, and enabling smarter decisions. Here, we highlight how the geospatial industry supports each SDG for the greater good.
For more insights, explore the Geoawesome Geospatial for Good Report.

