Open Cities Mapping Project: Using Open data for Innovative Urban planning solutions
Data is certainly the biggest asset of the Internet Century and the World Bank, through its Global Facility for Disaster Reduction and Recovery (GFDRR) had launched the Open Cities Project back in November 2012 to create an open data ecosystem that will help provide innovative solutions to the urban planning and disaster risk management problems that many cities in South Asia face. The Open Cities project is a component of the larger Open Data for Resilience Initiative (OpenDRI).
Open Cities: Primary Objective
The primary goal of the Open Cities Mapping Project is to utilize GIS data such as road network, building and infrastructure maps and population data to help develop land use, emergency management and evacuation plans. These GIS models, tools and applications will greatly help the urban planner and administrators make better informed decisions.
Although GIS based models and applications have been around for a while now, most developing countries still lack detailed GIS infrastructure and a project like this is definitely going to add tremendous value both in terms of data and development of local expertise. Considering that all this information is available to the public as shapefiles and OpenStreetMap extracts (.osm file), it is going to be valuable for anyone who can think of a novel way to use this data.
Three Countries, Three Cities
Currently the Open Cities Mapping Project is active in three cities in South Asia: Colombo (Sri Lanka), Dhaka (Bangladesh) and Kathmandu (Nepal). These cities were chosen for their high disaster risk level, presence of existing World Bank activities, and local government cooperation in the project. Millions of people call South Asia their home and is one of the fastest growing urban regions in the world.
It is estimated that the total urban population will increase from 449 million in 2007, to 913 million in 2025, and subsequently to 1.32 billion in 2050. In addition, the GDP of SAR’s urban agglomerations contributes 25 percent to the region’s GDP, and is expected to increase significantly over the coming years. The growth and high population density in South Asia’s cities will continue to make them vulnerable to disasters if development is not properly managed. Only through a clear understanding of risks can communities achieve sustainable development and disaster resilience. The examples below highlight the work of Open Cities in three cities across South Asia to leverage community mapping and open data in the effort to meet these challenges.- Open Cities Website
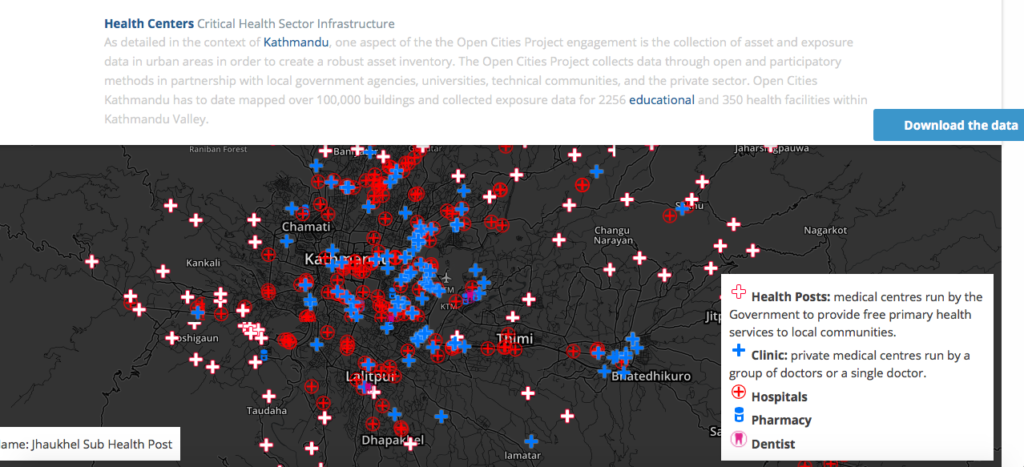
The Open Cities project website lists case studies such as 3D Buildings showing primary building use in Dhaka, the Road Network map for Colombo and Critical Health Infrastructure in Kathmandu.
Links
Here’s the link to the Open Cities brochure. If you are interested in understanding how the project was planned and other related reports, documented by the world bank – link.


