#Featured #Ideas

#MiniView Google Street View Map for Miniatur Wunderland

The Miniatur Wunderland in Hamburg is the largest model railway in the world with over 13,000 kms of railway tracks spread over an exhibition area of 1300 square meters. I wonder if Sheldon never mentioned this in the Big Bang Theory! Maybe now he might 😉

#MiniView Google Maps

Google has partnered with the Ubilabs, a German interactive mapping firm to map this miniature world using their toy-sized street view car!

GoogleMaps_MiniView

The level of detail present in the Miniatur Wunderland is clearly evident when you see the street-view 360s. Its definitely worth a visit and if you can’t make that journey to Hamburg just yet, well, guess you know that’s why Google Maps has street-view 😉 Here’s the link to the Miniatur Wunderland Street View
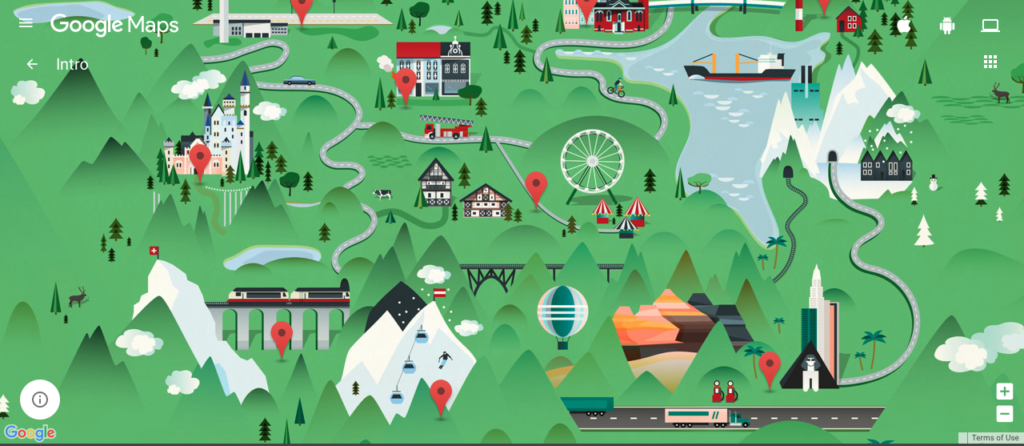
Google Maps - Miniatur Wunderland

Google Maps – Miniatur Wunderland

Street View in Miniatur Wunderland: a long-held dream

We have spent seven years grappling with the question of how we can showcase Hamburg’s most popular attraction and make it accessible to an even larger audience. At the beginning, the technology wasn’t sophisticated enough to create attractive 360° panoramas on such a small scale. In 2015, however, the time had come – and we were able to execute this globally unique Street View project on behalf of Google and Miniatur Wunderland. – Ubilabs

Cool project Google! #Geoawesomeness

Say thanks for this article (0)
The community is supported by:
Become a sponsor
#Featured
#Business #Featured
Global Top 100 Geospatial Companies – 2024 Edition
Avatar for Muthukumar Kumar
Muthukumar Kumar 01.31.2024
AWESOME 10
#Business #Featured #Ideas
Why Have Scientific Datasets Been So Widely Adopted in Earth Observation and What Role Does Data Quality Play?
GeoawesomeTeam 07.17.2024
AWESOME 4
#Business #Featured #GeoDev
Geo Addressing Decoded Part 2: Beyond Coordinates – Exploring the Depth and Impact of Geo Addressing
Aleks Buczkowski 05.2.2024
AWESOME 4
Next article
#Featured #Ideas

TorFlow: Visualising the Tor network

Tor is the online network which allow people to hide their anonymity in the Internet. So when you want to search the web via the network you connect to one of 5000 entry relays, you are redirected to one of 1000 exit relays and only than you connect to the website. Each request is done via different combination of relays, so in practice your IP is untraceable.

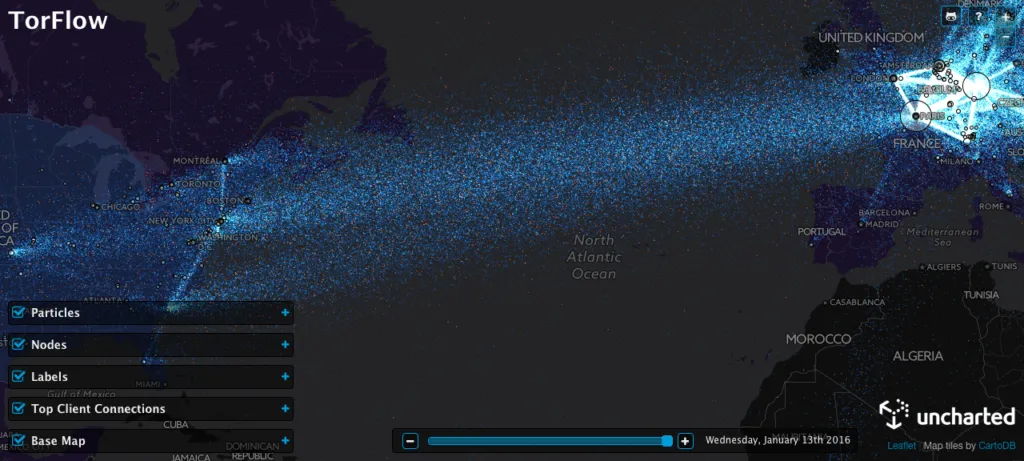
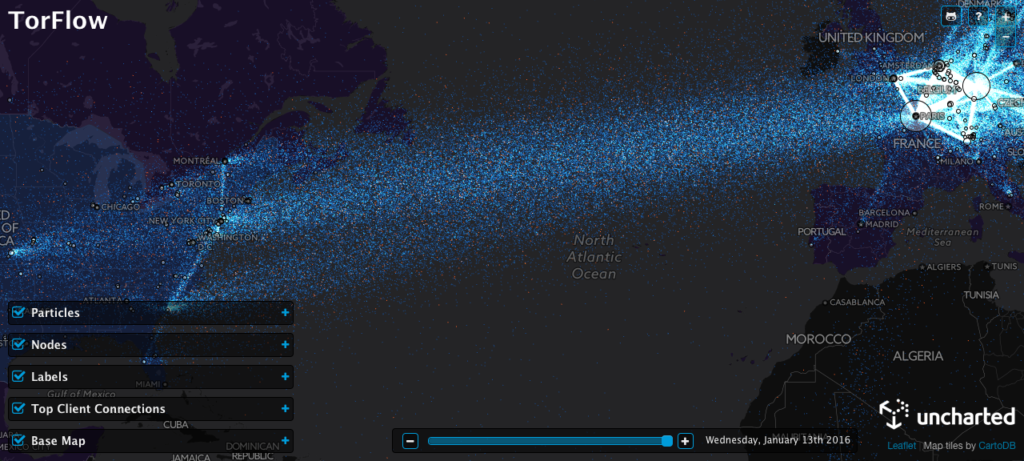
TorFlow is a #geoawesome map that visualises information about each connection between these relays on the Tor network. The first thing I noticed about the map was the number of connections that are made from Europe. You can hardly see through the vivd blue patch in the heart of Europe – A clear indicator of the importance and emphasis placed on online privacy especially in Germany and other EU countries. 

The TorFlow Map

The TorFlow Map

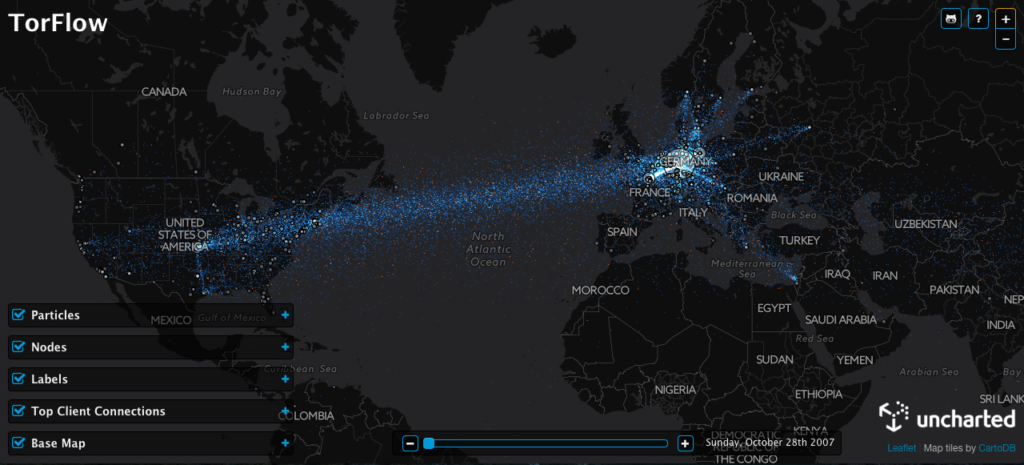
The map visualises tor connection information dating back from Sunday, 28th October 2007 and its interesting to see how much the use of Tor has increased over the years. 

Tor connections on 28th October 2007

Tor connections on 28th October 2007

Go check it out – TorFlow. If you are interested in the looking behind the map and taking a look at the source code then here’s the link to the TorFlow GitHub page.

Read on
Search