
 We do not live in times of peace. Although we don’t witness it the global cyber war is raging on. Norse Corp one of the leading cyber security firms developed an interactive map that shows just how serious it has become.
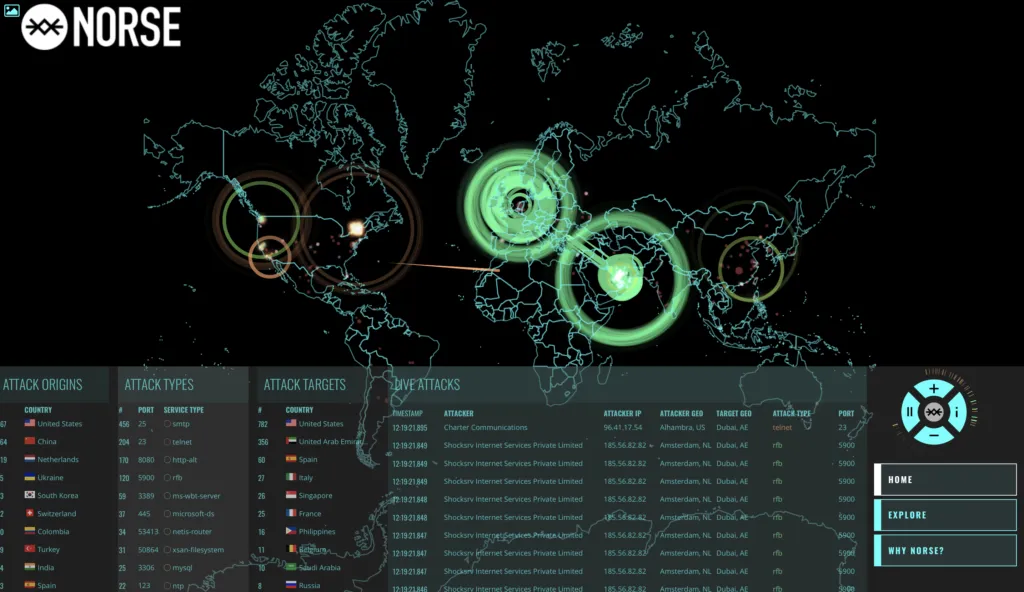
This mesmerizing map is hypnotic. If you watch long enough, the map will explode with colors, as mass-hack attacks blast across the globe. The tables below the map show the country of origin and target, attacks types and the real-time list of attacks.
What’s striking is that the map represents a tiny fraction of the full list of attacks. Norse is showing us only a small sample of its data, and still, you can easily see when massive, targeted and well-organized strikes happen mainly in the US and China.
This map is very scary as it makes you realize that we live in the times of war. Cyber war.


#Ideas


Next article
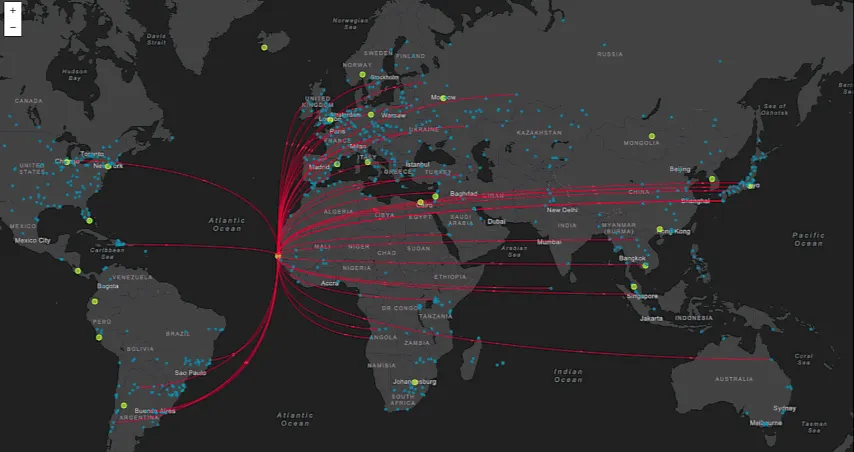
If you have ever faced the challenge of visualizing a flow of things on the map, you know that it’s not an easy task. There are multiple workarounds to do it but it was always a struggle. Common solutions for dynamic flow mapping include using straight lines and geodesic lines, both of which have significant visual limitations.
A new library for the ArcGIS JavaScript API called The Canvas Flowmap Layer allows you to solve this problem and map the flow of objects from an origin point to a destination point in an easy way. The solution is based on Bezier curves. The directionality of the flow can be mapped by using the info whether the curve is convex or concave but it can be also visualized as moving dots.
Let us know when you will be able to play around and it in practice.