Meet ResilientGrid – the startup that is using GIS to develop the next-gen infrastructure management software #TheNextGeo
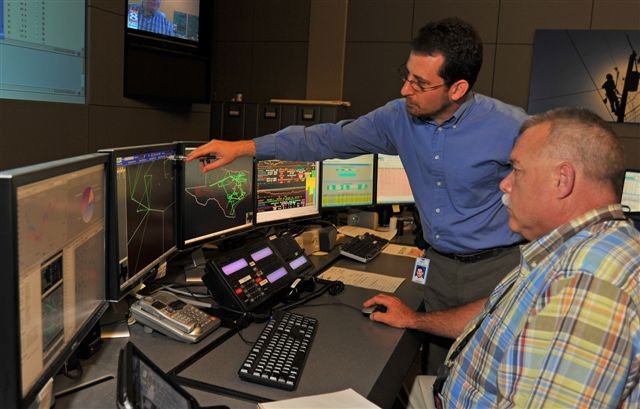
Infrastructure control rooms – for most of us that is something that we have only seen in movies and yet they have a huge impact on our lives. Electricity, road traffic, trains, airports and many other wonderful things that we take for granted on a daily basis wouldn’t function without one.
This week on The Next Geo, we are super excited to talk to Michael Legatt, the CEO of ResilientGrid to learn more about how his startup is developing the next-gen software for infrastructure management and how GIS plays a role in all this. Read on.
Many wonderful companies were born in garages, ResilientGrid was born in infrastructure control rooms. The operators in these control rooms identified several areas of risk including a lack of situational awareness, a lack of the requisite tools and application integration. The team at ResilientGrid is developing next generation solutions for smarter infrastructure management, with a vision to improve security, reliability, resiliency and integration for critical infrastructures.
Q: In your blog announcing the launch of ResilientGrid, you mention “Many wonderful companies were born in garages, ResilientGrid was born in infrastructure control rooms.” When did you realize that you want to start your own company? What were you doing before? What’s your “unfair advantage”?
A: Before starting ResilientGrid, I had a career across a few different industries. I started as a programmer on Wall Street, became a clinical psychologist, and spent ten years at ERCOT, the electric power grid operator for most of Texas. The decision to start my own company came out of the interactions I was having across the electric industry, where experts were recognizing that the challenges on the grid were increasingly about people, not technology. As far as “unfair advantage”, I’d say I’m really lucky to be in a place where several of my skills and training (computer science, psychology, energy systems engineering) all came together to try to help the industry solve this problem.
Q: Could you tell us a bit more about what you are working on? What problem are you trying to solve?
A: As the grid changes and becomes increasingly complex, the human beings who are working 24/7 to keep the lights on are facing new challenges they’ve never seen before. So many things are changing: people who have been working in the utility business for decades are retiring en masse, and the new employees coming to take their place have vastly different training and experiences. We have “big data” challenges all around – in fact, the systems operators are using typically are engineered without the recognition that the humans are part of the system. It is usually frustrating but manageable in normal situations, but in emergencies, the human being is ultimately set up to fail as the systems over-rely on their short-term memory, overly distract them with irrelevant information, and force more automation on them that doesn’t properly include them “in the loop”. In fact, if you look at root cause analyses for electric outages as far back as 1965, up to what’s happening in Puerto Rico today, whether things start because of weather, attack, or human error, ultimately human factors are always implicated, especially the dreaded “loss of situational awareness.” The system is changing faster, whether because of renewables, new control points (for example, my thermostat), and new cybersecurity needs.
Q: ResilientGrid Map primary focus is to reduce the clutter and help operators focus on the most important information. How does GIS/Location analysis play a role in this?
A: Ultimately, the GIS plays the role of a common “glue” to help operators understand where equipment is on the system, and how it’s connected. We do offer operators other views, but especially in emergency situations, the ability to see common points on a map becomes very valuable and it’s an instantly understandable and easy to agree on landscape for collaboration. The ability to add additional layers allows the operators to start to see the complex patterns between the data points, and even anticipate what is coming their way, and how fast.
Q: Many people who are reading this blog might have the same question as me at this juncture. Do you see yourself as a “geospatial” company or is GIS just the glue behind your product?
A: I don’t think of it as an either/or, but a yes/yes. We’re definitely a geospatial company because so much of what we do in critical infrastructure is around where things are. To me, geospatial is usually the best way to show information to operators, especially because of its ability to combine multiple layers to see the interaction effects (for example, a significant weather front, electrical outage, and difficulties that face a repair truck trying to get to the location). So from that perspective GIS is a large part of the “glue” that our operators are using for situational awareness, and so to do that well, we have to have strong human factors design and strong geospatial capabilities.
Q: One of the fascinating things about ResilientGrid Maps to me (as someone outside the control room) was the integration of Social Media layers in the grid network visualization. How does this play a role in operating and maintaining critical infrastructure?
A: Ultimately, it’s one of the recognitions that the way we interact with our customers are changing and that there are critical pieces of information that aren’t necessarily coming through traditional channels. Just like the CDC (Center of disease control and prevention in USA) can watch the migration of viruses through Twitter feeds, so too could utilities engage with customers around things like outages, understand behaviour changes (for example, a picture of a person with their new electric car). Don’t get me wrong – not all of this information ought to be in real-time operations, but other groups inside utilities are also working tirelessly to understand how their customers’ needs are changing over time, and these kinds of things may help them. One real-time example though is that if you could understand where a neighbour’s utility is experiencing outages (either through Twitter or something like the Outage Data Initiative), and you know there’s a storm coming your way through their territory, you could start to anticipate and prepare for the storm.
Q: The critical infrastructure industry has a reputation for being conservative and a bit averse to “trying” out new things. How do you go about convincing people in an industry like that to integrate a new solution like ResilientGrid Maps?
A: I think it’s important to keep the focus on why the utilities are conservative. An example – a friend once who had served on a submarine, he asked a commander why they weren’t using much smaller, more efficient generators, and the response was, “which would you like to be deep underwater with and trust to keep you alive? The brand new technology or the one that has been proven for decades”. It’s a way of thinking that comes from how deeply they care about their system, and how hard they work to protect it. As far as the second part, it comes down to supporting them, helping them to try and solve a problem they’re seeing, and also to be able to show that we have done it well. It really is about a commitment to work together to continue to improve everything, including our software, as the world around us changes.
Q: Where do you see ResilientGrid in 3 years from now? How do you think the market is going to evolve?
A: I think the grid is changing so fast, it’s hard to predict where things will be in a few years, but if the trends I’m seeing keep up, I’d say a few things:
- The recognition that many of the challenges utilities are facing can’t be fixed with a new piece of technology (in fact we probably have mostly already have the technologies we need). Instead, it’s about people, both human performance (reducing human errors and learning from/anticipating/avoiding challenges), and organizational culture.
- As we push towards more automation, we’ll have more “out of the loop syndrome”, which leads to loss of situational awareness. Basically as we add more systems to do things faster, if we don’t properly include humans in the loop, it is much harder for them to do their work.
- Industry growth in the “big data” space will accelerate, in terms of speed, breadth, and depth. The problem we already have will be only exacerbated: humans are drowning in big data, but thirsty for information.
- The need for critical infrastructure to collaborate effectively continues to grow. Most big challenges won’t be solvable by one person, in one control room, or by one company. It’s going to be more about information sharing and collaboration.
- End users will increasingly become a willing, active participant in the grid, rather than just a consumer that pays a bill once a month.
Q: As a startup founder, I am sure that there are many things that you must have learnt along the way. What was the most interesting feedback that you received so far?
A: That’s a great question. I always like to say that the most important thing I ever built wasn’t a piece of software or hardware, a procedure, or document, but rather a relationship with the operators. One of my favorite moments was with a customer some years ago, when I had a geospatial display under development showing some information. As they walked by, they looked at it, paused for a second, and said, “shoot – so that’s why they’re having that problem!”. That simple exchange, just someone walking past a projector, really helped crystallize the idea that we might be onto something really important.
Q: More often than not it takes a while to find a business model that works for you, have you cracked that code already?
A: I think the moment you think you have, you definitely haven’t. Working in an industry that’s changing so rapidly, something that works well today may need tweaking tomorrow. We definitely have continued to improve our business models thanks to amazing customers giving amazing feedback, and while it’s working well now, I’m looking forward to the opportunity to make it even better or respond to new needs as the market changes.
Q: You are based in Austin, Texas, how’s the startup scene there? Is it easy to hire people and get investments?
A: Austin is a great place to do a high-tech startup. I get to interact with many entrepreneurs, investors, and customers, all with the mindset of working to collaborate, doing things that are meaningful, and giving great feedback.
Q: Okay, this is a tricky one – on a scale of 1 to 10 (10 being the highest), how geoawesome do you feel today?
A: I really admire the work you’re doing at Geoawesome to have a deep conversation about GIS and the way you’re always focusing on doing more with it – seeing GIS as a critical part of something important. I also appreciate learning about these other startups, how they’re pushing the envelope on what you can do with geo. It’s an incredible time to be working in this space.
Q: Any closing remarks for anyone looking to start their own geo startup?
A: Thanks! I’d say that one of the best things to do is build strong relationships with people having the kinds of needs you’d like to support. Ask questions and learn as much as you can. After a while, try and show some geodata in a prototype and see what they think. Don’t start with a particular tech stack and then try and fit it to support your need… if you find there’s a geo need with no solution out there, if you can, go an make it happen! Geo tools are so important in our world, so anything you can do to help grow them can have a tremendous impact.
Q: Okay, before we end, We have to talk about this for sure! You have not one but two Ph.D.’s – one in Psychology and Power systems engineering! Looking back, do you think that both of these degrees come in handy at Resilient Grid? How did you even motivate yourself to do the second one 🙂
A: I found being a student really interesting and fun, and learned things in both programs that have had a tremendous impact on our work at ResilientGrid. I definitely would say that combining those two disciplines with computer science has helped me do something that would have been harder with just one of the degrees. But I also don’t want to over-inflate things. Even though the subject matter was so different, doing the second degree was much more straightforward in a lot of ways, because I had done it before. I knew what to expect, and because I’d done it before, I knew how to avoid some of the challenges I’d faced the first time around. Kind of like how driving a car for the first time was much more challenging than driving this morning. I hope that if I do have an addiction, it’s to learning more. I approached school as a great opportunity to learn, and happened to end up writing some stuff or getting a piece of paper at the end of it.
If you would like to contact Mike or ResilientGrid.
The Next Geo is supported by Geovation:
 Location is everywhere, and our mission is to expand its use in the UK’s innovation community. So we’re here to help you along your journey to success. Get on board and let’s start with your idea…
Learn more about Geovation and how they can help turn your idea into reality at geovation.uk
About The Next Geo
The Next Geo is all about discovering the people and companies that are changing the geospatial industry – unearthing their stories, discovering their products, understanding their business models and celebrating their success! You can read more about the series and the vision behind it here.
We know it takes a village, and so we are thrilled to have your feedback, suggestions, and any leads you think should be featured on The Next Geo! Share with us, and we’ll share it with the world! You can reach us at info@geoawesomeness.com or via social media ?


