

Old but funny, and worth reminding you the case. Fiat workers noticed a Street View car filming in their area – the Swedish city of Södertälje where also VW has a headquarters… so they jumped into a Fiat 500 and followed the Google Street View Car for 45 minutes… when they’ve realized they will pass the Volkswagen office they decided to make a joke:
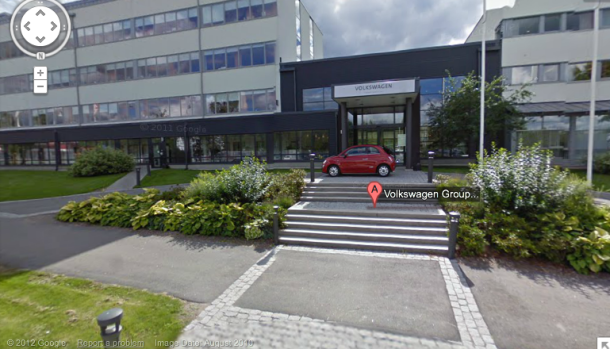
And as a result the red Fiat 500 is the primary thing in the Street View image of Volkswagen’s Swedish HQ. To see it in Google yourself, just hit up Maps and paste in “Volkswagen Group Sverige AB, Sodertalje, Sweden.” Cool idea, isn’t it?

#Insights

Next article
Twitter is a unique social media where people comment and share options… in a virtual world. And this is where you can see the value of the spatial information added to your virtual life – Location-Based Services bring back the virtual content to the physical Earth! LBS has a power to link the online-content to a certain physical location which creates a whole new dimension and context that allows to change the data and information into valuable knowledge.
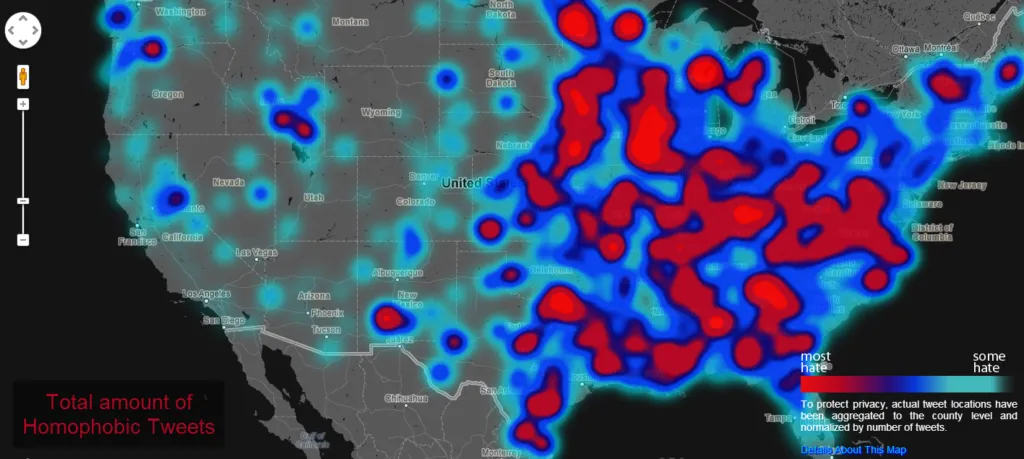
A great usage of this concept has been performed by Dr. Monica Stephens of Humboldt State University (HSU) who analysed millions of geotagged tweets identifying the geographic origins of online hate speech. Dr. Stephens’ students Amelia Egle, Matthew Eiben and Miles Ross analysed every geocoded tweet in the United States from June 2012 – April 2013 containing one of the ‘hate words’. They filtered 150,000 tweets which than they manually verified and selected those used in a unquestionably negative way.
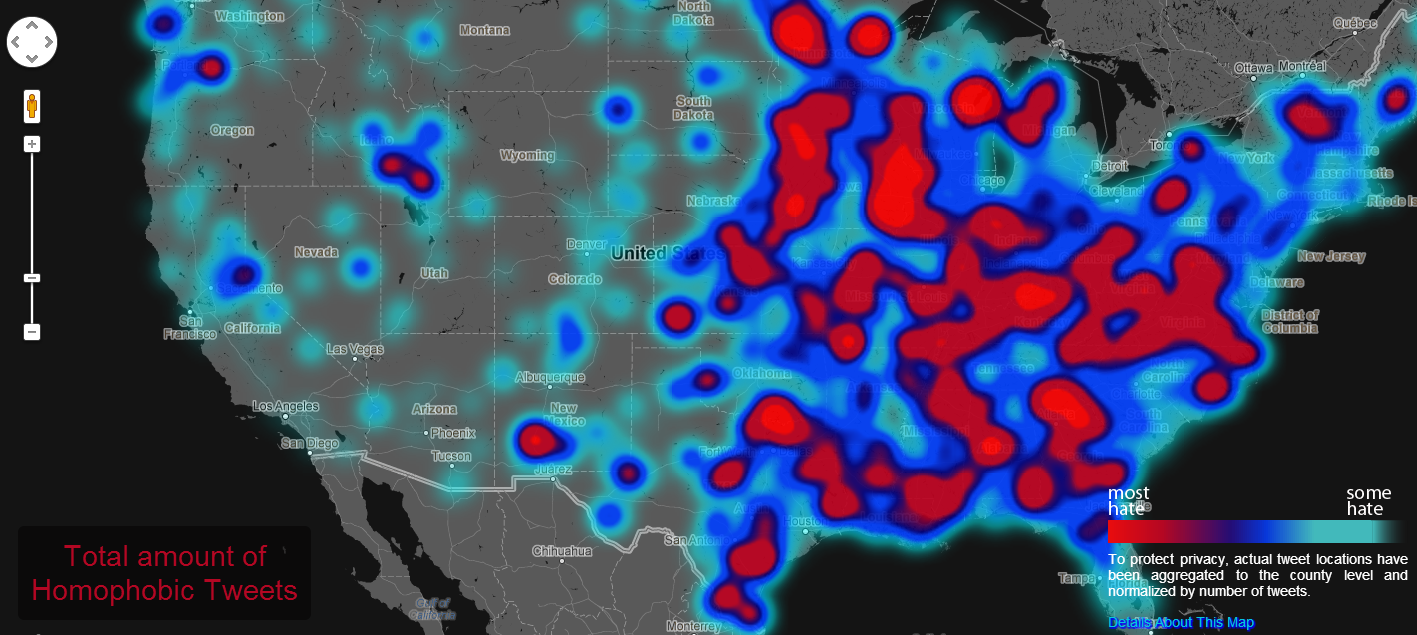
To produce the map all tweets containing each ‘hate word’ were aggregated to the county level and normalized by the total twitter traffic in each county. Counties were reduced to their centroids and assigned a weight derived from this normalization process. This was used to generate a heat map that demonstrates the variability in the frequency of hateful tweets relative to all tweets over space, so in other words proportional number of ‘hate words’, not just areas with the largest number of Twitter users.
I think it’s a cool project which shows how can you use location information as a source of knowledge. Of course such an analysis will never show the attitudes of the whole population (only among Twitter users who consciously or unconsciously geotagg tweets), but it’s a valid probe at the scale that was impossible to gather in any other way.
source: The Verge

