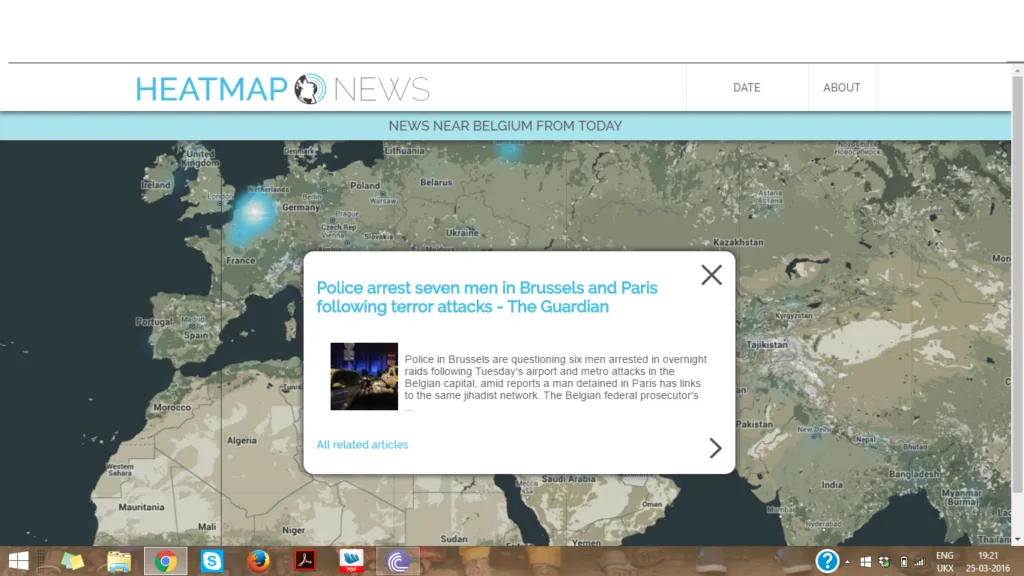

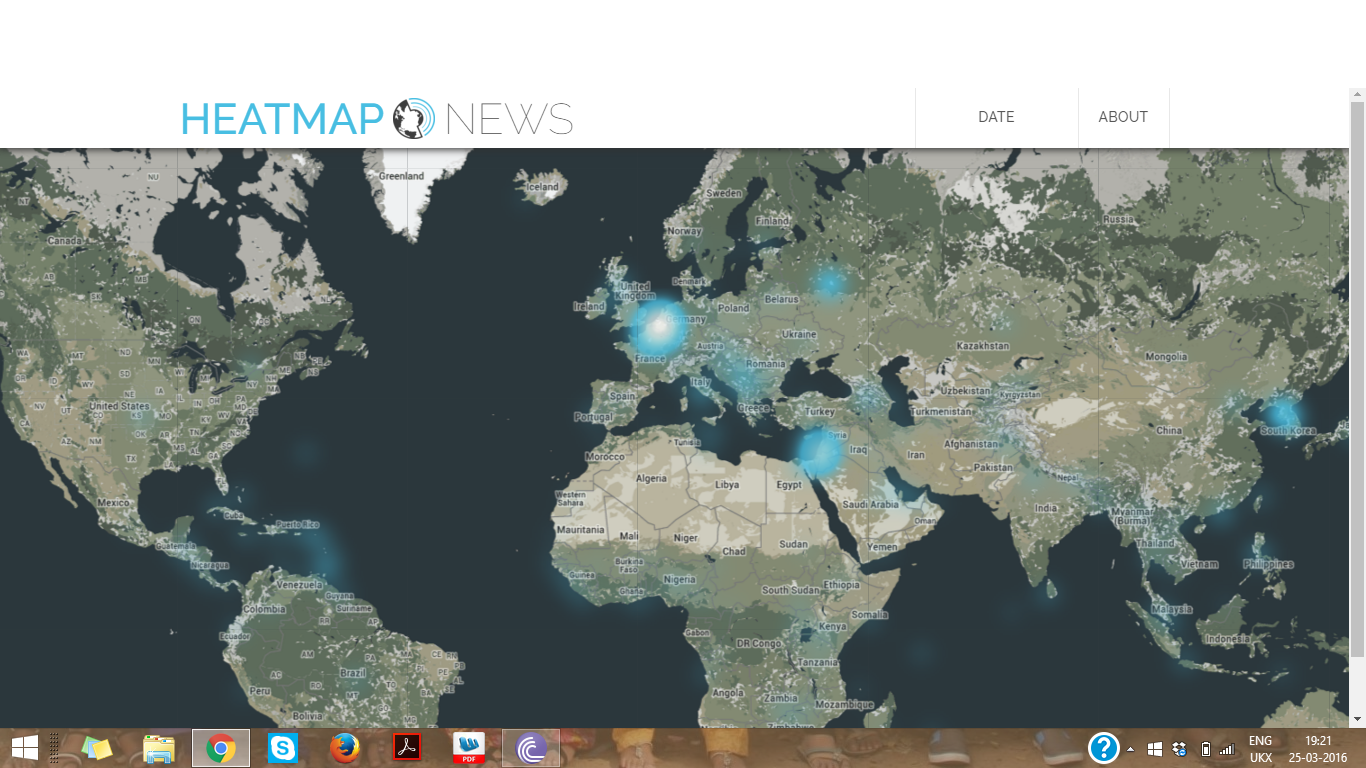
A map for visualizing the location based news for all those news maniacs out there. HEATMAP NEWS – This is an interactive map that intensifies a location to a smoky blue to bright white based on the degree of news. One can filter the news for recent hours or view an aggregate news over a week from the present day. Deriving the news is just simple, on selecting the hotspot – list of news/ articles pops up for the desired City/State/Nation.

Of course, there are options for a backward time travel to a specific date. And here, being so curious to test it, I have jumped to 25/04/2015 – A black day for Nepal, where the disastrous earthquake of magnitude 8.1 consumed the lives of over 8000 people leaving 21,000 injured.
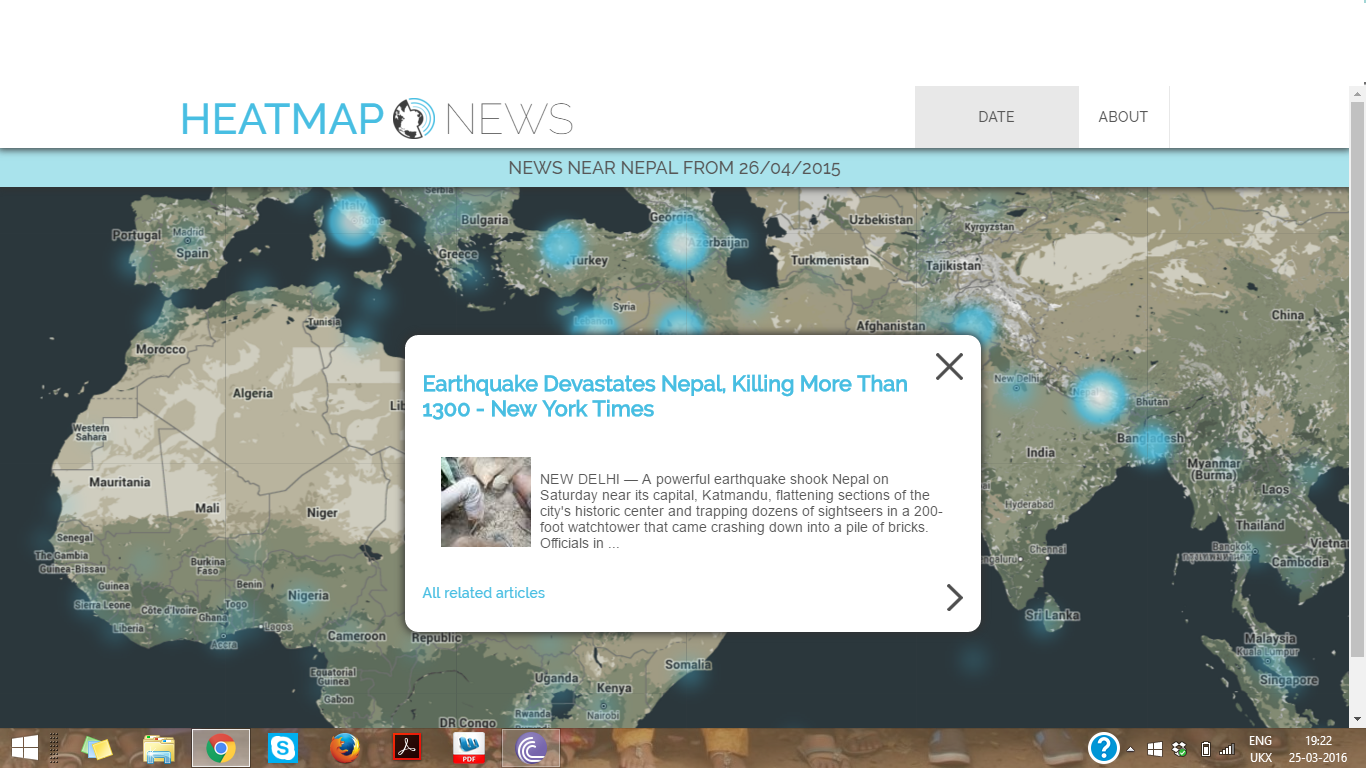
Heatmap News on 26/05/2015
But a complication with its usage is that one should type the date of the day after, if you want to hop into a desired date. Which means for news regarding the Paris attack instead of 30/11/2015, 31/11/2015 must be used. This issue is due to the fact that a surge of news/article occurs a day after any disaster or calamity. The source is provided by Google News and is being collected since 18/08/2014, and no details will be obtained for any date before it. It also has some limitation of mediocre performance which makes it not so used/known. However, “Read you forget, see you remember”, in that perspective Heatmap gains in displaying a global view and magnitude of news from a region.


#Ideas


Next article
Geography is a great discipline of science. It helps us understand the natural world and how we, as humans, affect it. A famous saying says that “Geography is what geographers do”… Take a look at the famous top geographers that did something else…
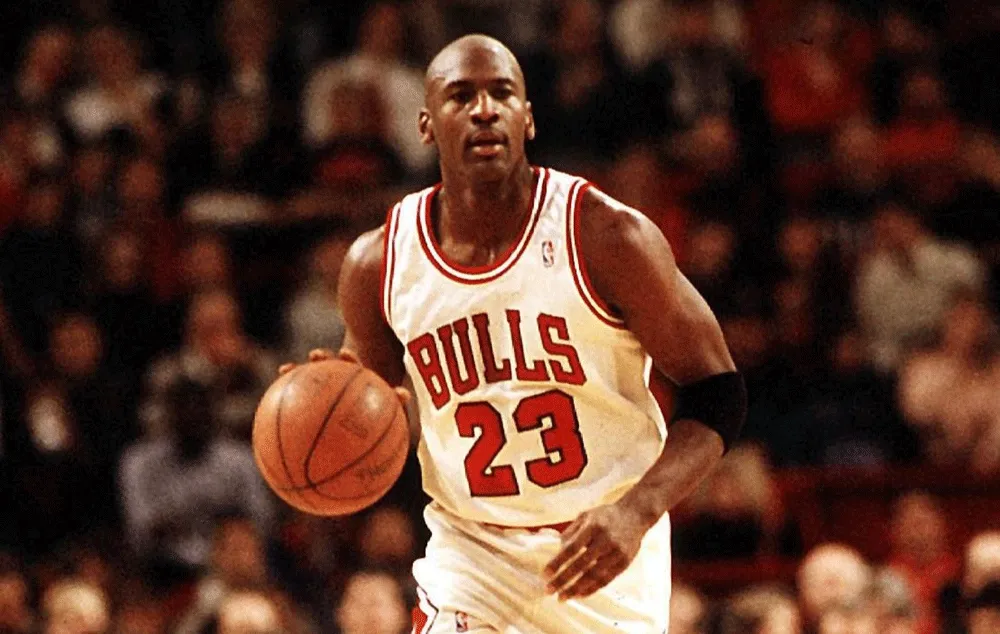
Degree in geography by Michael Jordan
Before Michael Jordan became the greatest player in the history of NBA, he graduated with a degree in this field from the University of North Carolina Chapel Hill in 1986.

Michael Jordan
Student of geography – Prince William
Prince William, the Duke of Cambridge, studied it at the University of St. Andrews in Scotland having switched from studying the history of art. Good choice!
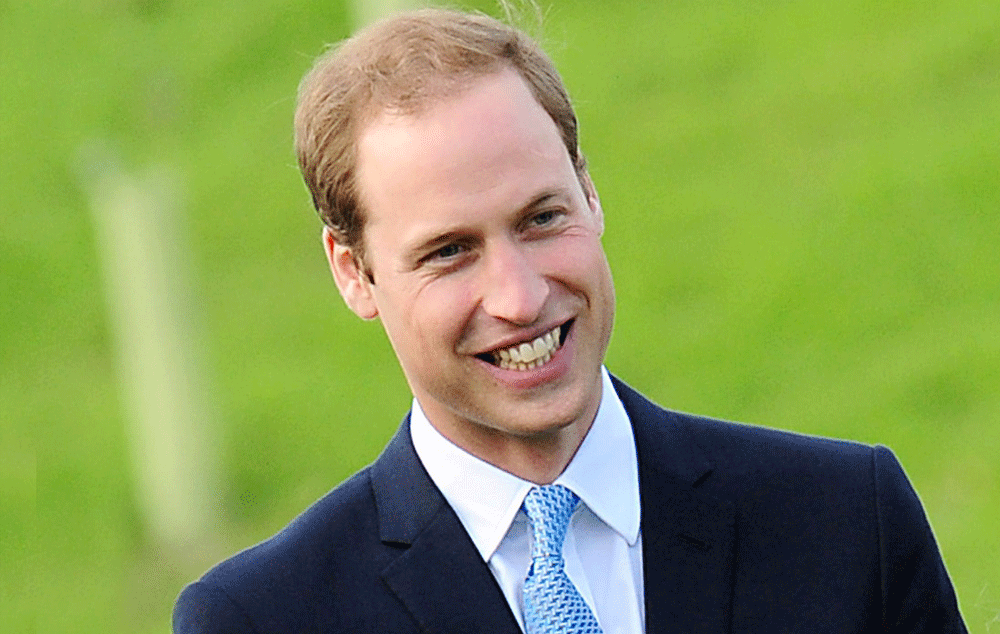
Prince William
Unusual geographer – Mother Teresa
Blessed Mother Teresa (1910-1997), was not exactly a student of geography but she taught this subject at covenant schools in Kolkata, India before she founded the Missionaries of Charity.
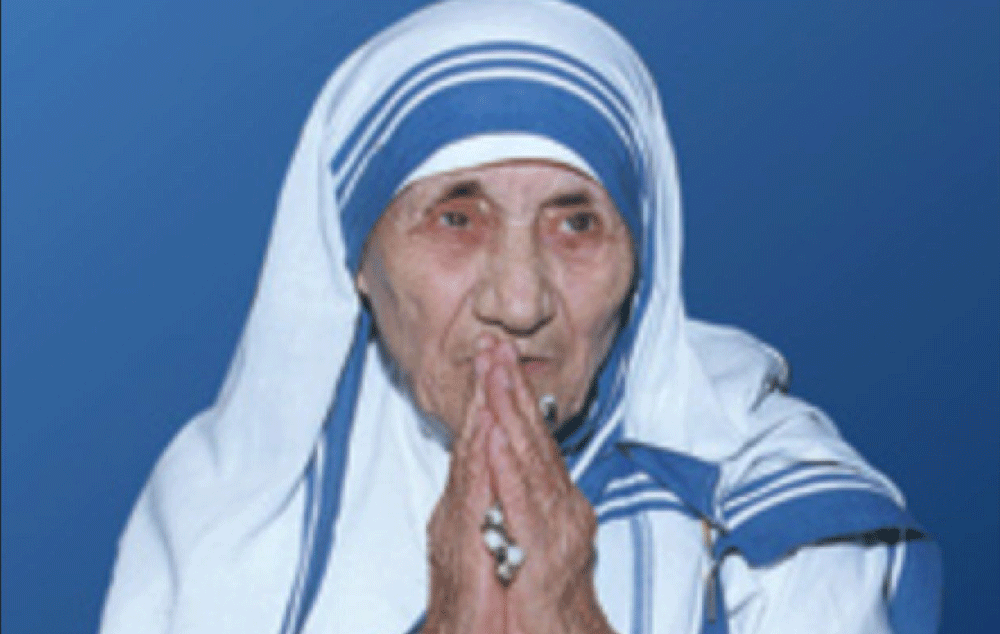
Mother Teresa
Geographer, dictator, Augusto Pinochet
Augusto Pinochet (1915-2006) the former dictator of Chile is well known as geographer. He actually wrote a few books on geopolitics.
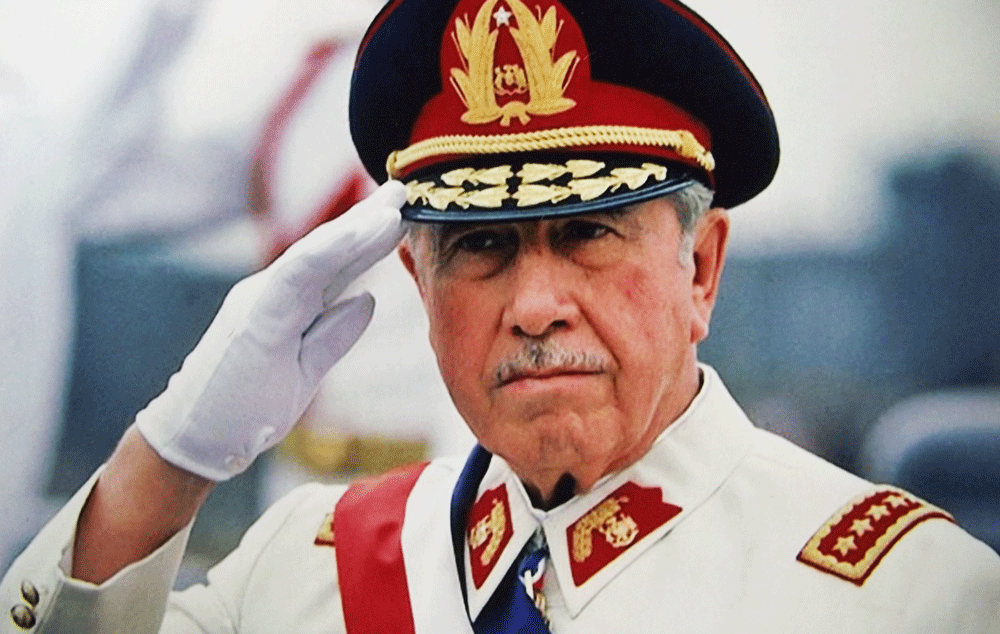
Augusto Pinochet
Philosopher, geographer, Immanuel Kant
Immanuel Kant (1724-1804) is one of the greatest philosophers of all times. He is also a well-known geography scholar and lecturer.
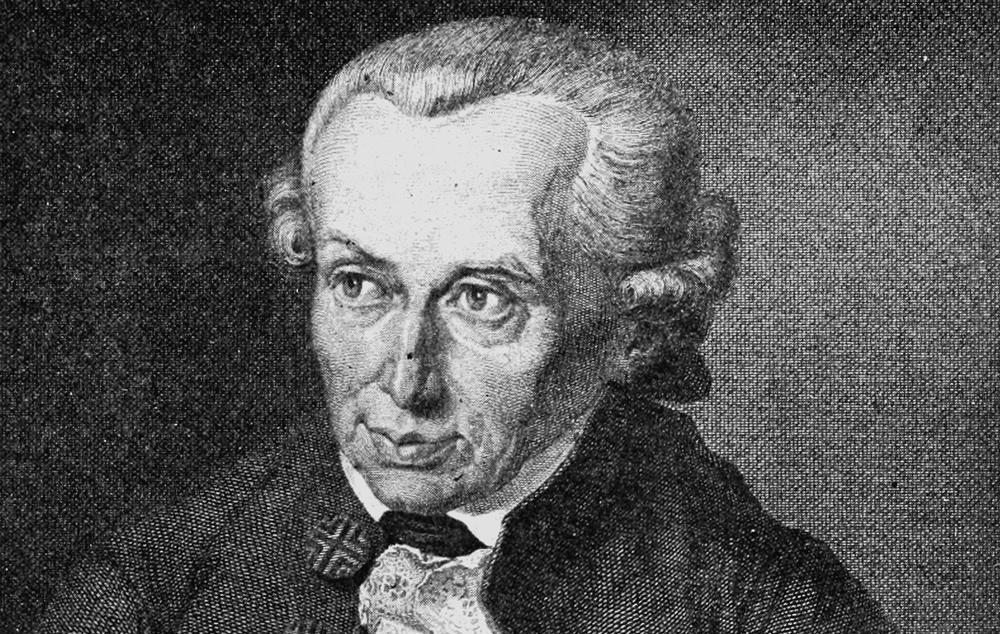
Immanuel Kant
Did you like this post on famous geographers? Read more and subscribe to our monthly newsletter!

