#Ideas

Google Maps Maker Finally in UK

Google-Map-Maker

Google has announced that it is finally expanding Google Map Maker to the United Kingdom. The service uses crowdsourced concept of Open Street Maps where users create the content of maps. Google initially launched it map areas it could not access, like Vietnam, Pakistan and later North Korea. Afterwords it was subsequently expanded to other countries, including America, as users where actually keen to improve the accuracy of their neighbourhoods. Google said that technical issues prevented the Maps maker service from reaching the UK before.

“Contributing to Google Map Maker can quickly transform a simple map into a more detailed and accurate representation of a city’s local treasures,” Google said in a blog post. “More than 40,000 people around the world are making contributions and improving Google Maps through Google Map Maker each month. Now it’s your turn to help, whether marking the trails through Brecon Beacons National Park in Wales, adding all your favorite shops in London’s Soho Square, or improving driving directions to St Ives in Cornwall.”

Source: Google Lat Long Blog

Say thanks for this article (0)
The community is supported by:
Become a sponsor
#Ideas
#Ideas #People #Satellites #Science
AI Assistance in Creating 3D City Visualizations
Sebastian Walczak 04.12.2024
AWESOME 1
#Business #Featured #Ideas
Why Have Scientific Datasets Been So Widely Adopted in Earth Observation and What Role Does Data Quality Play?
GeoawesomeTeam 07.17.2024
AWESOME 4
#Business #Fun #Ideas #Science
Next Generation Map Navigation: Is It Based on AR Smart Glasses?
Nianhua Liu 07.19.2024
AWESOME 2
Next article
#Featured #Ideas #Science

GeoFlow Plugin For Excel Will Let Make Spatio-Temporal Visualizations Directly From Excel!

Excel is really powerful tool for playing with big data (especially with Power Pivot plugin) however spatial visualization of this data requires going back and forth to GIS software, joining tables or geocoding. Doable but time-consuming. Starting from now Microsoft teases us with a tool that will make it much easier to show data on the map… Last week Microsoft is announced the public preview of project called “Geoflow for Excel”.

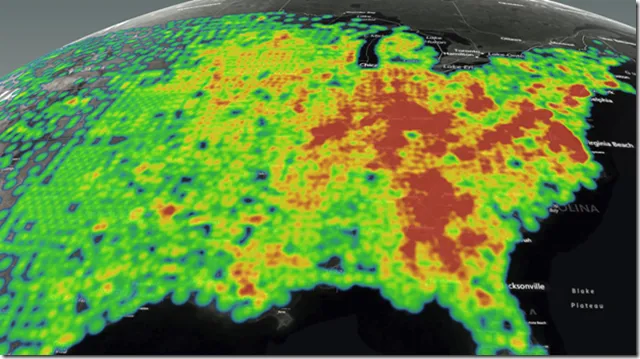
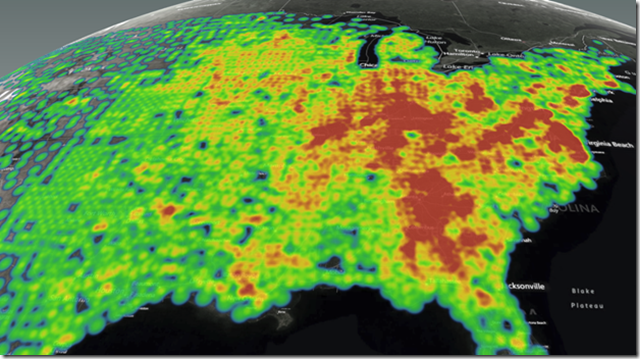
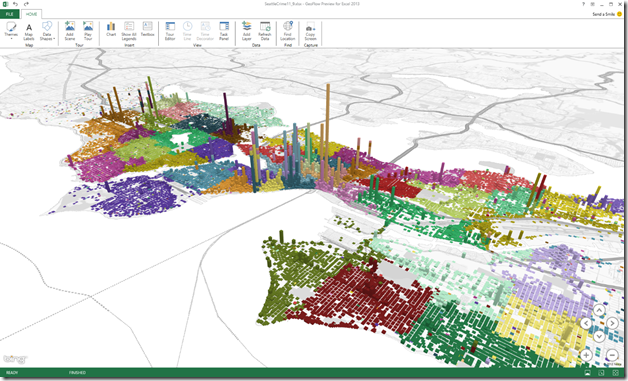
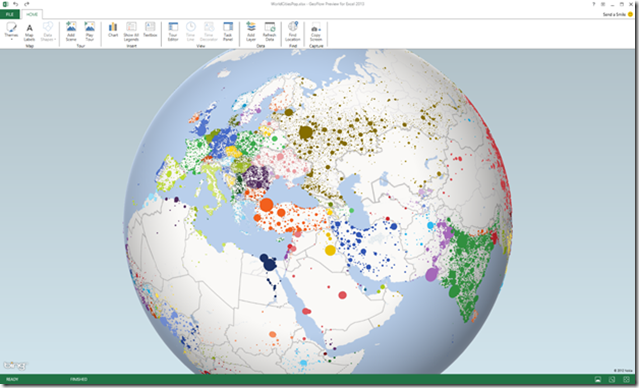
Essentially GeoFlow is a tool (Excel plugin) for visualizing geospatial and temporal data. It allows users to plot up to 1 million rows of data stored in an Excel workbook, including Excel Data Model or PowerPivot, on a Bing Maps. The data can be visualized as 3D columns, heat maps, and bubble visualizations, which is not perfect from cartographer’s point of view but enough to discover new insights based on visual analysis of data in space and time.

Check out couple of maps to see what can you do with GeoFlow:

clip_image006_thumb_4AFADAECclip_image002_thumb_6AD96474

clip_image004_thumb_7B052C6D

Not bad at all. On Excel blog you can find some tutorials how to play with the tool.

Of course this is not the first time users of Excel can create maps. Last summer, Esri Maps for Office was announced as a new location analytics tool linking ArcGIS Online data to Excel. Users of other spreadsheets tools like Google Docs can leveraage similar functionality from Google Fusion Tables. However it’s about time that Microsoft finally makes some use of it’s Bing maps (which I personally never use). I will play with the tool and give you some more insights about it soon. Meanwhile check the video below:

Read on
Search