With the coronavirus pandemic continuing to spread in many countries as economic activity revives, Google has ramped up its efforts to help people stay safe when they’re out and about. The next time you fire up the latest version of Google Maps on your smartphone, you will receive an option to activate COVID-19 data on the map.
By enabling this layer from the top right corner layers button on the app, you will be able to see the seven-day average of confirmed coronavirus cases in an area per 100,000 people. The layer display is color-coded to indicate whether cases are increasing or decreasing.
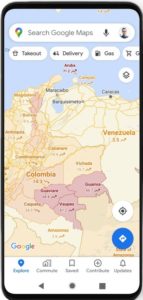 The layer’s colors indicate:
- Grey: Less than 1 case
- Yellow: 1-10 cases
- Orange: 10-20 cases
- Dark orange: 20-30 cases
- Red: 30-40 cases
- Dark red: 40+ cases
“Trending case data is visible at the country level for all 220 countries and territories that Google Maps supports, along with state or province, county, and city-level data, where available,” Sujoy Banerjee, Product Manager, Google Maps, explains, adding that the feature is being rolled out to both Android and iOS users simultaneously.
The data for this new Maps layer comes from multiple sources. These include authoritative sources, such as Johns Hopkins, the New York Times, local health agencies, and municipal corporations. But interestingly, one of the data sources is Wikipedia. Google already relies on these sources to power COVID case information in Search, and now this capability is being expanded to Google Maps.
You may recall that Google first updated Maps with new COVID-19 travel alerts when cities first started to reopen in June. The navigation app tied up with local transit agencies to tell commuters if their trip was likely to be affected by COVID-19 restrictions, and notified drivers about restrictions along their routes.
Google Maps’ crowdedness prediction feature for public transit is also helping users to see the times when a transit station is historically more or less busy, while also allowing them to check for insights like temperature, accessibility, and security onboard.
