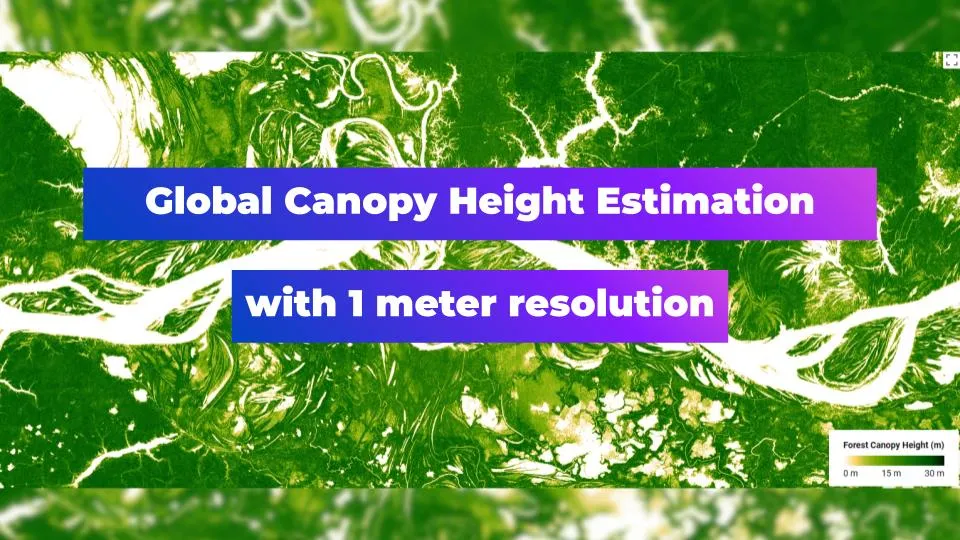
Global Canopy Height Estimation with 1 meter resolution!
That’s just a geoawesome news! The quality of satellite-based products is improving year by year! Here’s a perfect example of mapping the elements of Earth’s environment globally. Meta Sustainability group and the World Resources Institute have recently released a Global Canopy Height map at 1m resolution.
What is Global Canopy Height Estimation?
Global Canopy Height Estimation refers to the process of determining the height of forest canopies around the world using various remote sensing techniques. This estimation is crucial for several ecological and environmental studies, including biodiversity assessment, biomass estimation, and climate change research.
Gathering of the data
To generate this global map there was a need to collect 18 million satellite images from 2009 to 2020, highlighting the data from 2018 to 2020. Over 1 trillion pixels resulted in an impressive 15+ TB of data! What about the accuracy? From information provided by the authors the mean absolute error is 2.8 meters. To generate the model AI tool such as DiNOv2 was used, which enables for accurate assessment of carbon stocks.

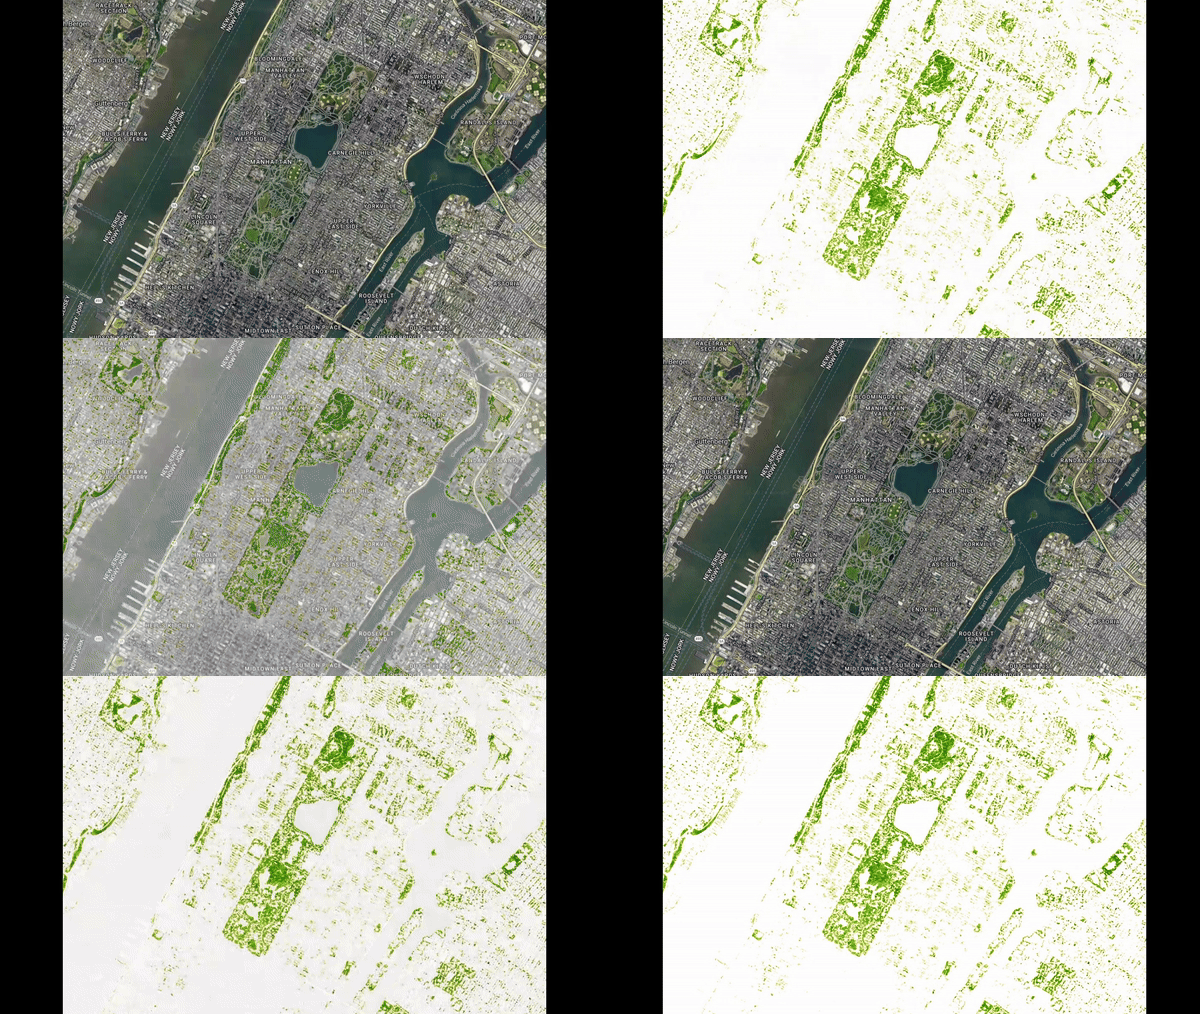
Canopy height in NYC, Google Earth Engine
Comparison with data from 2005 and 1km resolution, Belem, Brasil, South America, Source: Google Earth Engine
Spreading the news!
Thanks to the authors it’s possible to check out the possibilities of The Canopy Height map by yourself! Follow the link for online application. Case studies above were created using Google Earth Engine and uploading the following variables:
- Newest version: 1 meter resolution map:
var canopy_ht = ee.ImageCollection(“projects/meta-forest-monitoring-okw37/assets/CanopyHeight”)
- Older version: 1 kilometer resolution map:
var dataset = ee.Image(‘NASA/JPL/global_forest_canopy_height_2005’)
Know the difference: Global Canopy Height Estimation vs. nDSM
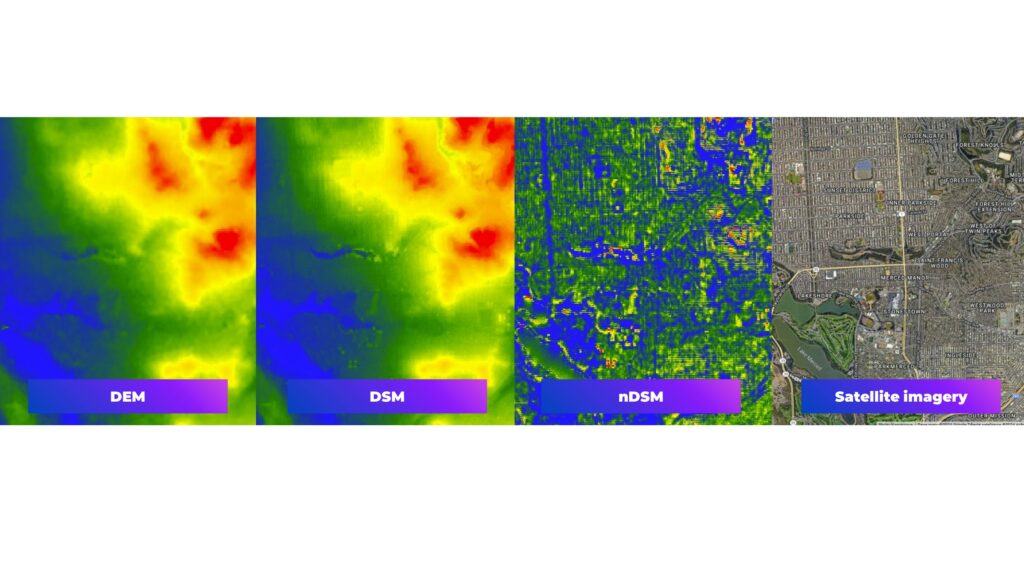
Mentioned Height map may sound familiar to nDSM – Normalized Digital Surface Model, but it’s limited only to the processed and modeled height of the canopy. nDSM presents the height of all surface structures above the ground, eg. buildings, infrastructure and vegetation. It’s generated by raster differencing DSM and DEM rasters. Example below is a visualization of DEM (Digital Elevation Model), DSM (Digital Surface Model), nDSM and satellite imagery for the west district of San Francisco. In nDSM visualization it’s notable that buildings are included next to tree cover in parks.

Know the difference. DEM, DESM and nDSM model
Conclusions
The recent release of a Global Canopy Height map at 1 meter marks a significant advancement in satellite-based monitoring. Utilizing the AI tool DiNOv2, this initiative analyzed satellite images, resulting in a highly detailed map that significantly improves the assessment of carbon stocks. This breakthrough demonstrates how AI tools are instrumental in enhancing the quality and precision of satellite-derived products, offering more reliable data and automation processing for ecological studies and environmental management.
Source: gee-community-catalog.org
Did you like the article? Read more and subscribe to our monthly newsletter!


