
Modern geospatial AI has become remarkably good at prediction. Given enough historical data, models can forecast flood extents, traffic congestion, or infrastructure stress with impressive accuracy. Recent advances, such as Prediction-to-Map flood forecasting, show that complex spatial predictions can now be produced far faster than traditional numerical models.
Yet accuracy alone often fails at the moment decisions matter. When conditions change, planners and responders ask questions that predictive models struggle to answer. Why did flooding concentrate here instead of there? If we block this road or close that floodgate, what breaks downstream? Is a certain outcome even physically possible given the constraints of the system?
This gap has become increasingly visible during recent extreme events, where cascading infrastructure failures revealed that many breakdowns were not caused by missing predictions, but by poor understanding of dependencies and constraints. As several analyses of modern infrastructure risk point out, models trained on past patterns often struggle when the rules of the system are stressed or altered.
This article argues that spatial systems require more than learning patterns from data. They require geospatial reasoning: the ability to respect physical constraints, understand connectivity, and reason about “what if” scenarios. It is written for geospatial practitioners, data scientists, and planners who already use GeoAI, but want to understand where learning ends, where reasoning begins, and why combining both is essential for real-world decision support.
What Geospatial Learning Does Well?
Modern geospatial learning is strong at large-scale pattern recognition. By processing vast amounts of satellite imagery and sensor data, GeoAI systems can extract building footprints, classify land cover, detect vegetation stress, and monitor change at a global scale.
A major advance has been the rise of geospatial foundation models, trained on diverse Earth observation data to generalize across tasks and regions. These models can segment complex scenes, describe imagery, and adapt to new problems with minimal additional training, even in data-sparse settings.
Learning also excels at creating spatial embeddings, compact representations that allow places to be compared, clustered, or searched for similarity. Work on satellite embeddings and large-scale spatial representations shows how embeddings make it possible to compare places, search for similarity, detect anomalies, and transfer insights across cities, ecosystems, and countries
Together, these capabilities have lowered the cost of turning raw geospatial data into useful signals. Learning gives us powerful eyes on the planet. The question is where this approach begins to break down.
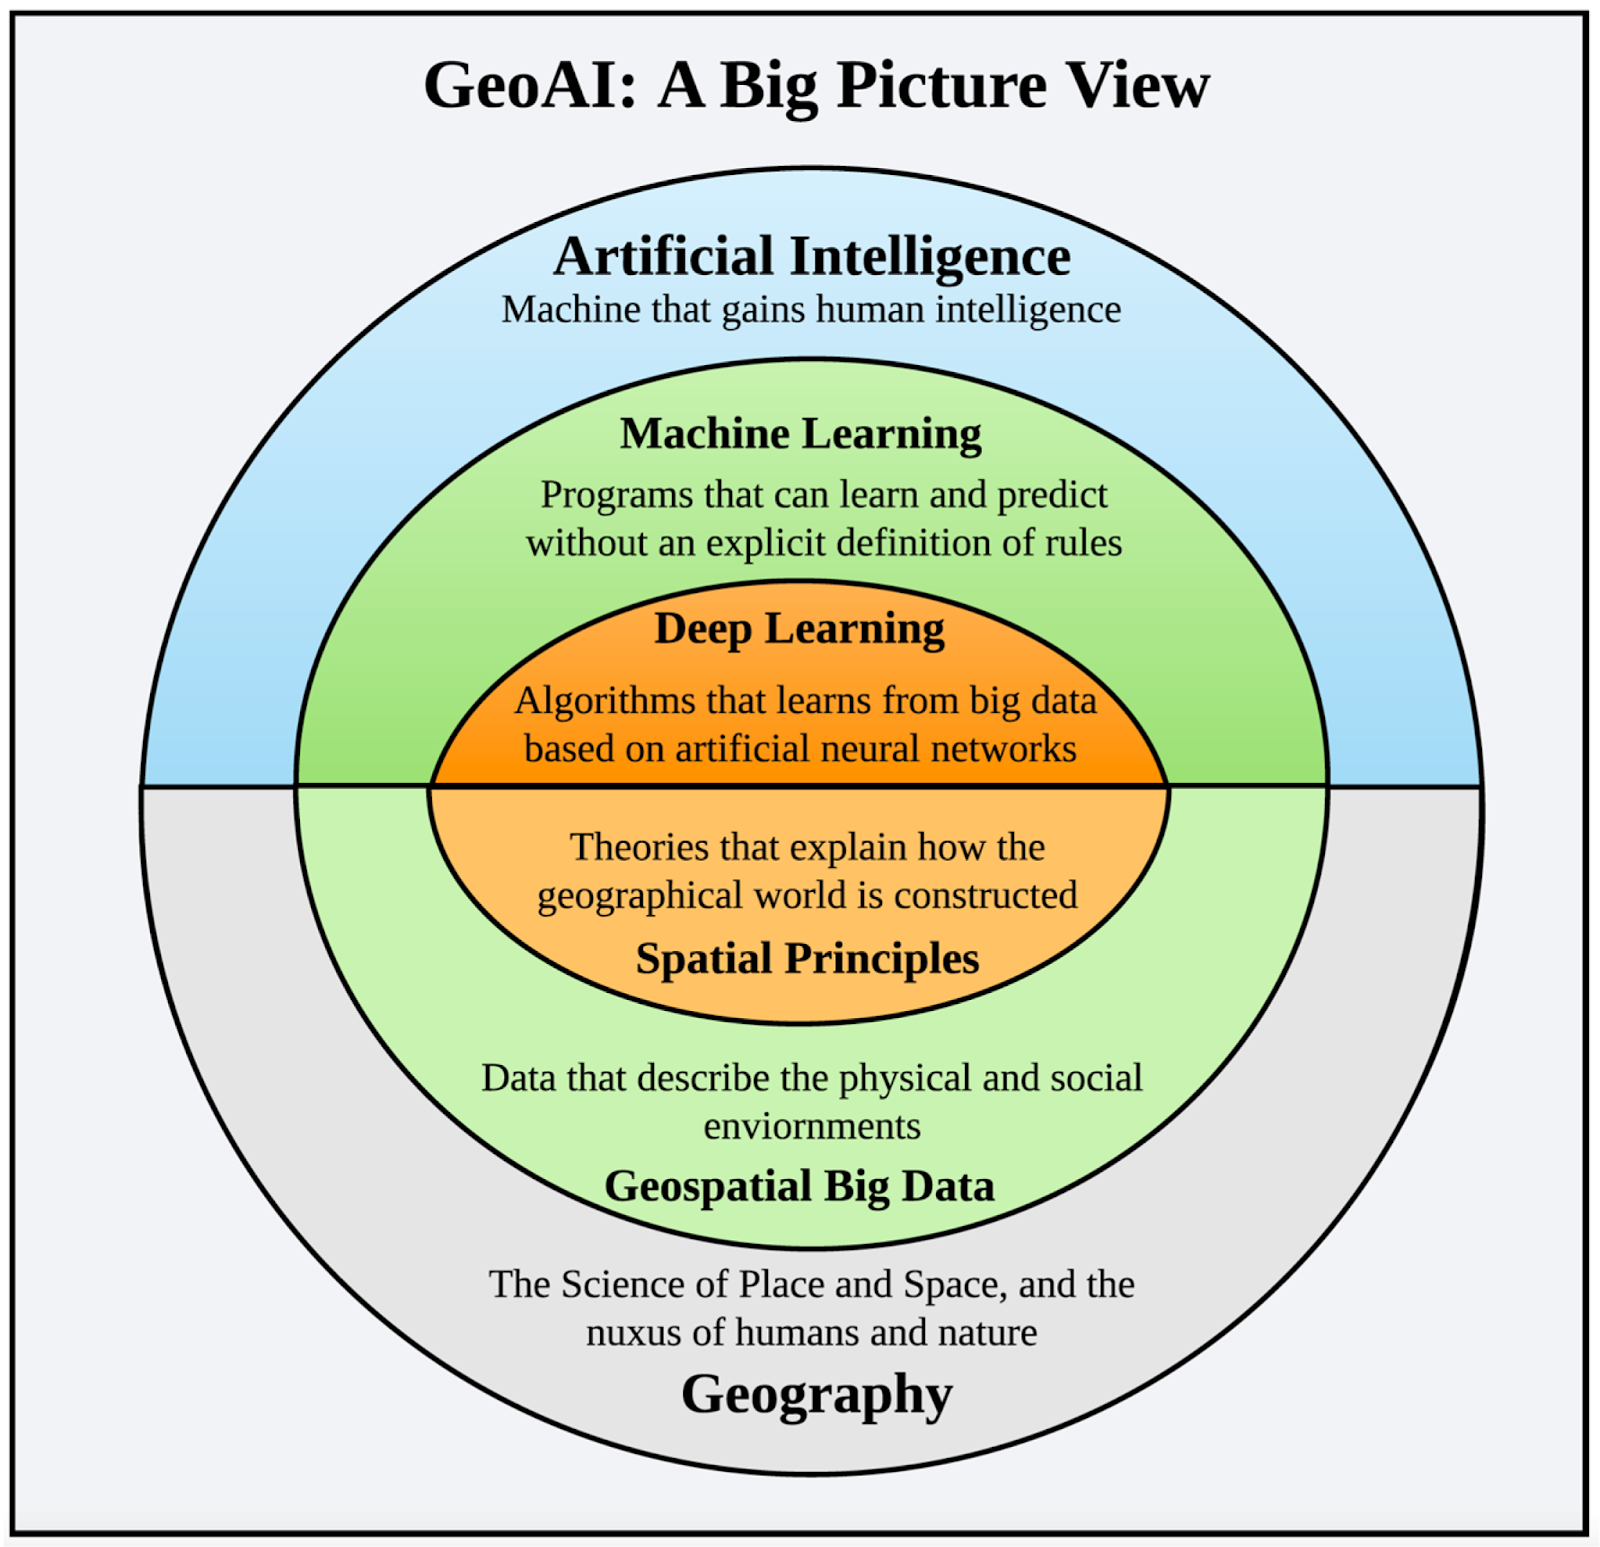
Source: MDPI
Where Learning Falls Short?
Learning can estimate what is likely. Reasoning determines what is possible.
As spatial systems grow more complex, the gap between recognizing patterns and understanding mechanisms becomes clear. A core limitation of geospatial learning is its reliance on correlation without awareness of physical constraints. Models may associate flooding with certain visual patterns in imagery, yet fail when terrain, vegetation, or flow dynamics differ from the training data, a weakness widely discussed in analyses of the limits of AI in water resource management.
This issue appears clearly in flood modeling. Evaluations of AI-enhanced versions of the National Water Model show that while learning can improve accuracy, models that ignore dominant physical processes systematically underpredict flooding when conditions shift.
Learning also struggles with topology and connectivity. Geography is governed by networks, yet many models treat spatial data as independent pixels. This leads to failures when disruptions propagate through systems, a problem documented in studies of spatial reasoning errors in AI and benchmarks on LLM spatial reasoning.
Finally, purely data-driven models lack counterfactual reasoning. They extrapolate from the past but struggle to assess interventions that change the system itself. Research on causal machine learning for flood damage estimation shows why prediction alone is insufficient in rapidly changing environments.
Learning can estimate what is likely. Reasoning determines what is possible.
What Geospatial Reasoning Actually Means?
If geospatial learning provides the eyes of a system, geospatial reasoning is the brain. It takes detected patterns and evaluates them against rules about how the physical world works. Instead of stopping at “there is a road here,” reasoning asks whether that road is the only access to a hospital, or what happens if it is blocked.
At its core, geospatial reasoning is a shift from statistical guessing to structural thinking.
First, it respects rules and constraints. Certain constraints are non-negotiable: water flows downhill, vehicles cannot pass through solid barriers, and land uses cannot overlap arbitrarily. Many failures in AI systems stem from violating these basic physical truths, a limitation highlighted in analyses of why AI struggles with real-world physical tasks.
Second, reasoning focuses on relationships rather than isolated features. Geographic entities exist within hierarchies and systems. A drain belongs to a pipe network, which sits inside a watershed. This relational view underpins the concept of geospatial knowledge graphs.
Third, geospatial reasoning propagates effects through space and time. A failure rarely stays local. If a substation goes down, reasoning traces which neighborhoods or services depend on that connection, reflecting the logic of flow and dependency that defines spatial systems.
Finally, reasoning enables “what if” and “what must be true” questions. Instead of predicting what usually happens, it evaluates interventions and constraints. This shift toward scenario-based reasoning is increasingly emphasized in work on geospatial reasoning with foundation models.
Learning helps AI recognize the pieces on the board. Geospatial reasoning gives it the rulebook to understand the consequences of each move.
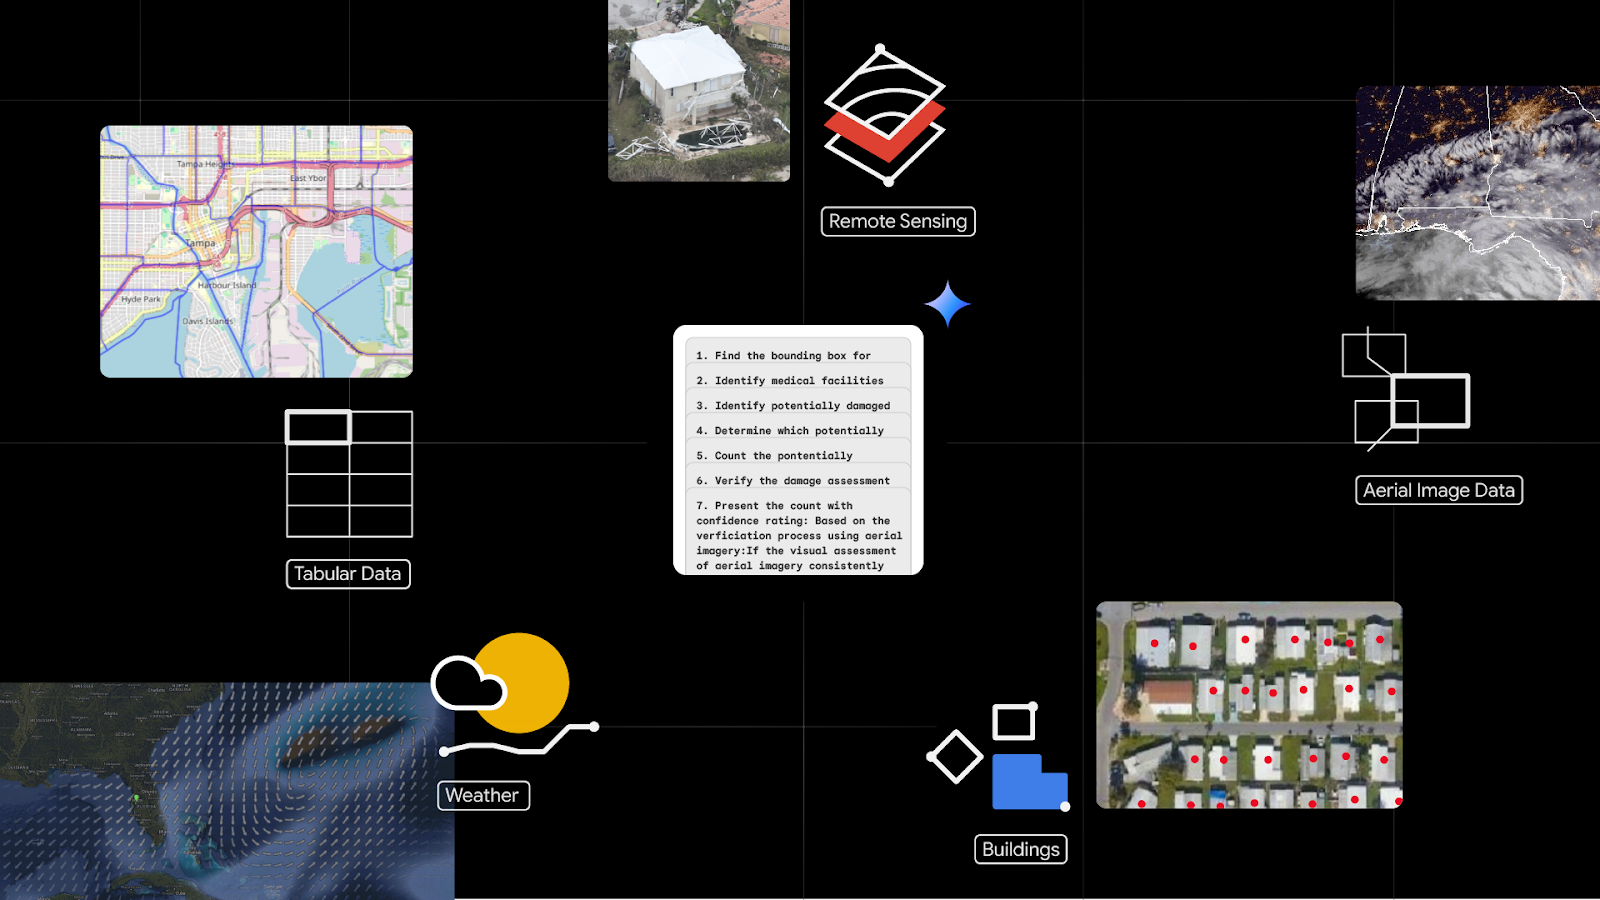
Source: Google Research
Why Geography Demands Reasoning?
Geography is fundamentally different from most data domains. While many datasets treat records as independent, spatial systems are defined by proximity, flow, and dependency. This makes purely predictive models fragile when applied across regions or scales, a limitation highlighted in work on spatial generalization in machine learning.
This difference comes from a few core spatial properties. Geographic systems are shaped by two factors: connectivity, as roads, rivers, and power lines form networks whose effects propagate, and directionality and flow, as physical rules like gravity constrain what is possible. Ignoring these constraints is a common source of error in hydraulic and infrastructure modeling, as shown in examples of common mistakes in hydraulic models. Geography also exhibits spatial dependence, where the state of a place is influenced by its surroundings, a foundational concept in spatial topology and relationships.
Because of these properties, geographic systems behave as systems of systems. Without explicit reasoning about structure, constraints, and relationships, prediction alone is not enough.
The Role of Graphs and Data Cubes
To bring geospatial reasoning into practice, two data structures matter most: graphs and spatial data cubes. Graphs encode relationships explicitly, treating buildings, roads, pipes, and substations as connected entities rather than isolated features, which allows systems to trace dependencies and understand how effects propagate through networks. Spatial data cubes add time to this picture by stacking maps across days, months, or years, preserving how places evolve instead of freezing them in a single snapshot. Together, these structures align digital representations with how the physical world actually works, enabling reasoning about connectivity, change, and consequence rather than relying on opaque predictions.
Where Geospatial Reasoning Matters Today?
Geospatial reasoning is already changing how high-stakes decisions are made, especially in areas where static maps are no longer sufficient.
In the insurance industry, reasoning is replacing one-size-fits-all hazard zones with contextual risk assessment. Instead of pricing risk solely on whether a property falls inside a flood or wildfire boundary, insurers increasingly use geospatial data for insurance to account for proximity, elevation, directionality, and mitigation. This allows underwriting to reflect local conditions, such as drainage improvements or reduced exposure to wind-driven fire paths, a shift already reshaping pricing and portfolio management, as described in how geospatial analytics is changing insurance.
Geospatial reasoning is also central to climate adaptation planning. Rather than planning for average conditions, cities increasingly plan for threshold scenarios, using adaptation playbooks to link physical changes like sea-level rise or extreme heat to concrete actions. This approach, reflected in climate adaptation playbooks and broader assessments of adaptation costs and strategies, enables proactive rather than reactive decisions.
In these domains, geospatial reasoning does more than refine predictions. It connects spatial data directly to action.
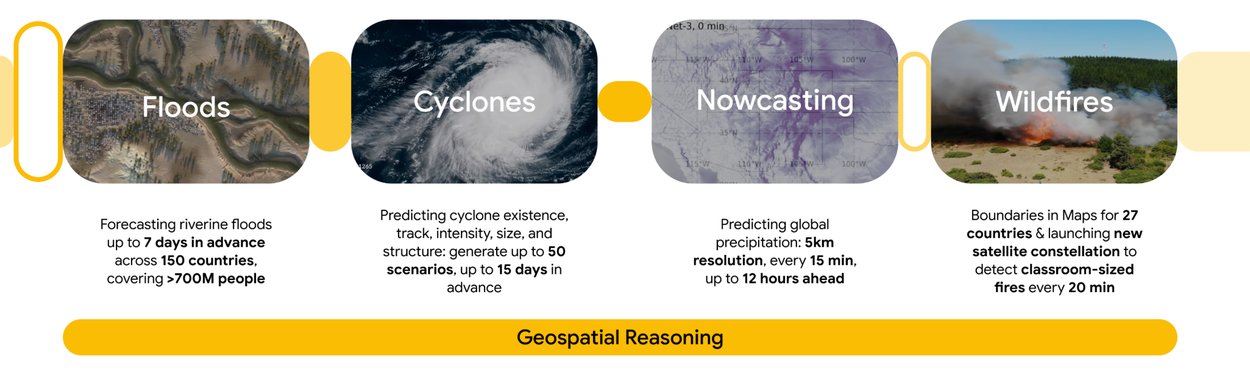
Source: Google Research
From Predictive Maps to Decision Support
Geospatial AI is shifting from producing predictions to supporting decisions. For years, the goal was to answer “what is likely?”, resulting in maps that forecast risk or change. Today, decision-makers increasingly need systems that help answer a different question: “What should we do?”
This is where geospatial reasoning sits on top of learning. Learning extracts patterns from vast datasets. Reasoning evaluates those patterns against constraints, dependencies, and consequences, turning predictions into guidance that can actually be acted upon. The emphasis moves away from interpreting probability surfaces and toward evaluating options, trade-offs, and outcomes.
Looking ahead, the future of GeoAI is not about replacing learning, but grounding it. Learning will remain the eyes of the system, detecting patterns at scale. What comes next is grounded intelligence: models that combine data-driven learning with physical rules, topology, and causal structure, allowing systems to reason about what is possible, not just what is likely.
As these systems mature, geospatial reasoning will also become more accessible. Natural-language interfaces and agentic GIS tools are lowering the barrier between spatial expertise and action, enabling more people to ask meaningful “what if” questions and receive transparent, explainable answers.
Learning gives us vision. Reasoning gives us judgment. Together, they are what will make GeoAI truly useful in the real world.
Further Resources
- https://www.youtube.com/watch?v=g9F-_tCakL8&t=1s
- https://www.youtube.com/watch?v=ZyH3-7pBBiQ&t=1s
- https://medium.com/@guneetmutreja/beyond-pixels-a-new-era-of-geospatial-reasoning-with-alphaearths-embedding-calculus-6dcf073db057
- https://arxiv.org/abs/2505.17136
Did you like this post? Read more and subscribe to our monthly newsletter!


#GeoAI


Next article
Cities are often described as collections of buildings, roads, and green spaces. In practice, they function through connections. What matters is not only where things are, but how they depend on each other.
This became clear during the 2003 North American Blackout. A surge in electricity demand on a hot day in Ohio caused power lines to sag into trees, triggering a chain reaction across the grid. Within minutes, roughly 50 million people across the United States and Canada lost power, not because of a single failure, but because the network itself amplified it.
Events like this are hard to reason about with maps alone. Geospatial graphs model places as nodes and connections as edges, making it possible to analyze flow, dependency, and vulnerability across entire systems. This article introduces geospatial graphs from a practical perspective for practitioners who want to move beyond geometry and understand cities as networks.
What Is a Graph?
- In computer science, it is a simple way to describe relationships. At its core, a graph has only two elements: Nodes (or vertices) represent entities or locations within the network. In a city, a node could be a street intersection, a bus stop, a power substation, or even an entire building.
- Edges (the links) link the nodes together. They represent relationships or paths, such as road segments, water pipes, rail lines, or fiber-optic cables, following the basic ideas of graph theory definitions commonly used in network analysis.
If this sounds abstract, think of a family tree or your LinkedIn network. You are a node, and your connection to another person is an edge. Cities work the same way, just at a much larger scale.
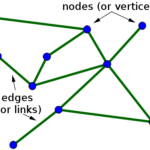
Source: Math Insight
Why Maps Alone Are Not Enough?
Traditional maps, whether paper maps or the navigation app on your dashboard, are built on Euclidean space. They focus on exact coordinates, precise geometry, and straight-line distances.
Cities and people, however, do not operate this way. We rely much more on topological thinking, which focuses on how elements are connected rather than their exact shape or distance. When navigating a city, it often matters less how long or curved a road is and more whether it connects two places at all.
This distinction between geometry and topology underpins how maps and graphs differ. Geometric representations preserve shape and distance, while topological ones preserve connectivity, an idea commonly discussed in comparisons of geometrical versus topological space.
Transit maps make this difference obvious. Metro and subway diagrams deliberately distort geography so that connections between stations and lines are easy to understand. Stations that are far apart in reality may appear close together, while others are stretched apart, because the goal is not geographic accuracy but clarity of movement.
For cities, the key question is often not how far Point A is from Point B, but whether a viable path exists between them and how that path interacts with the rest of the system.
Where Graphs Already Exist in Geospatial Data?
Graphs already underpin many geospatial systems, even if they are not always described that way. River networks, road systems, logistics chains, and urban infrastructure all rely on connected structures rather than isolated spatial objects.
This becomes clear when looking at recent research on applications of graph theory in geospatial analysis, which brings together examples ranging from hydrological modeling and transportation networks to digital twins and urban infrastructure systems. Across these domains, graphs are used to represent flow, dependency, and vulnerability in ways that traditional geometric representations struggle to capture.
The key takeaway is that graphs are not a niche abstraction. They already sit at the core of many geospatial workflows, providing a common language for understanding how complex spatial systems behave as a whole.
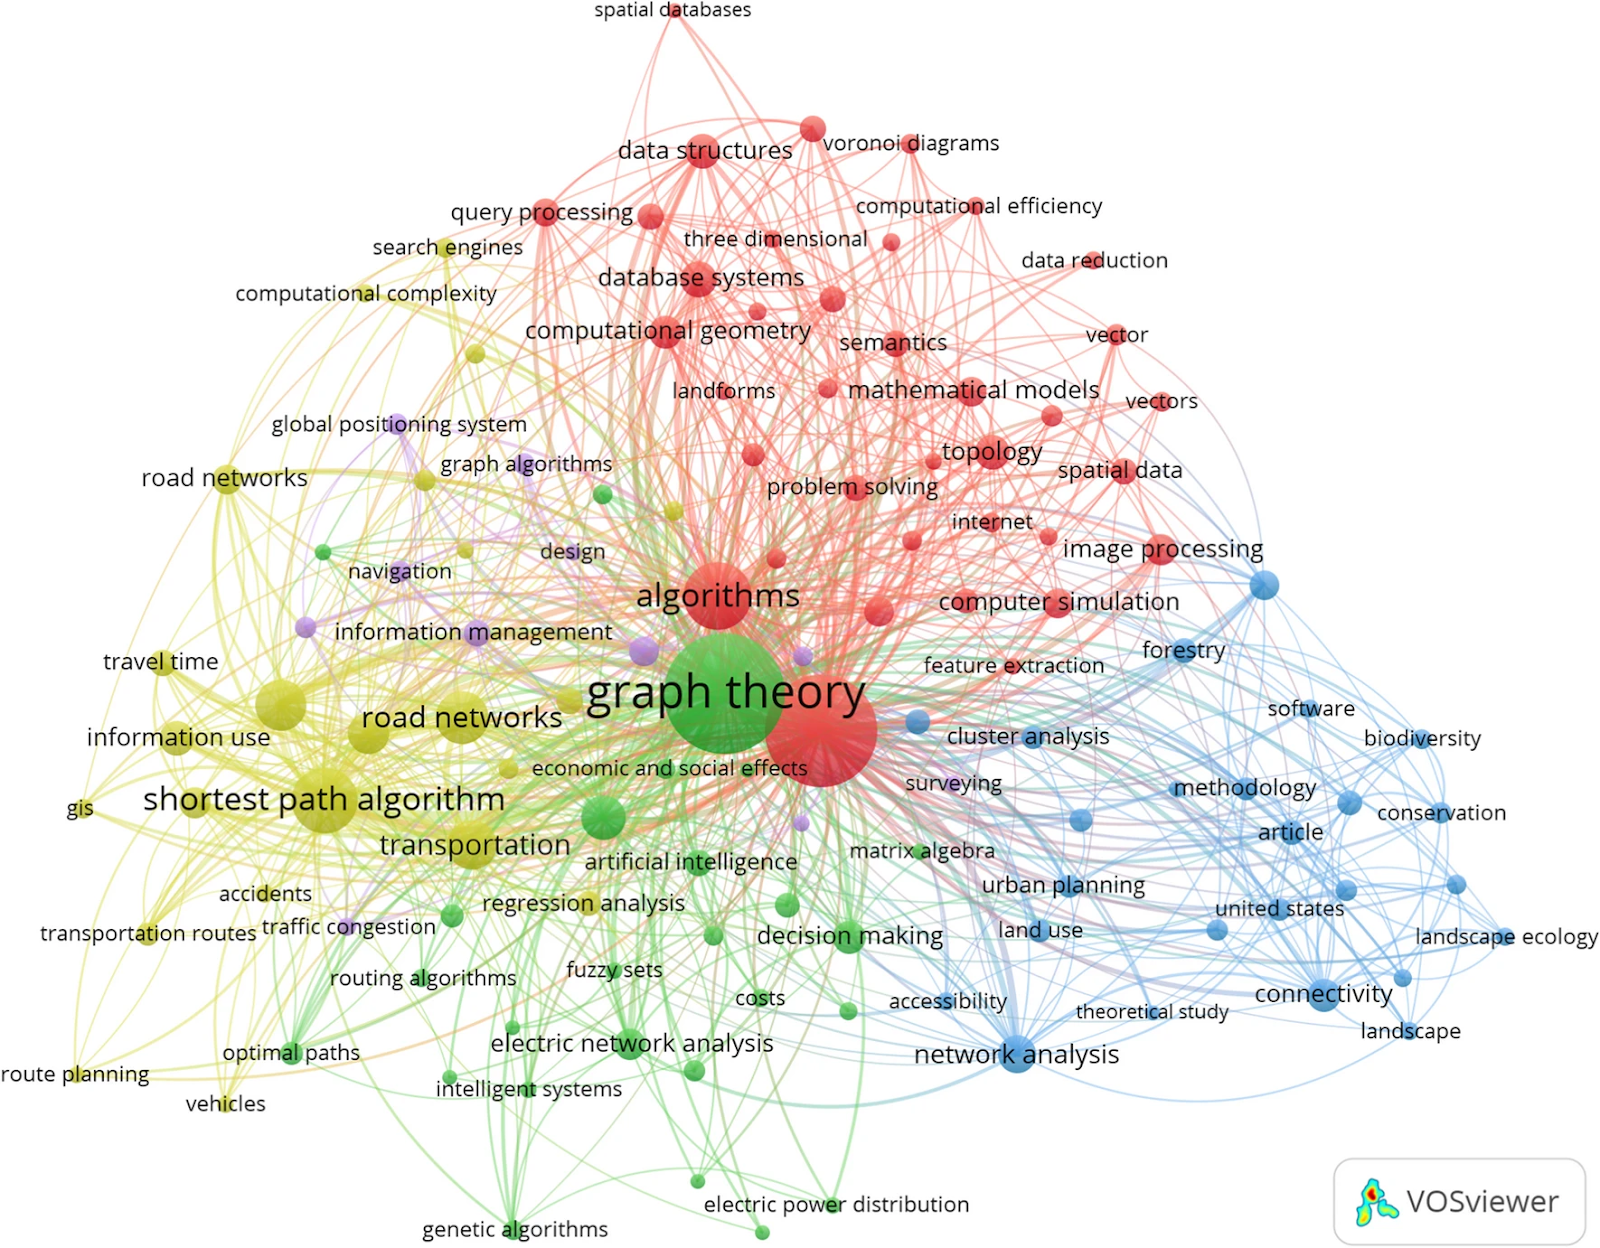
Graph theory applications for advanced geospatial modelling and decision-making. Source: Springer
What Becomes Possible With Graph Thinking?
Once a map is converted into a graph, you can start asking questions that are difficult or impossible to answer with geometry alone. One of the most useful ideas here is centrality, which helps identify which parts of a city matter most for keeping the whole system functioning.
A particularly powerful measure is betweenness centrality. It captures how often a node, such as a road intersection or transfer station, lies on the shortest paths between other parts of the network. An intersection with high betweenness centrality acts as a bridge, connecting otherwise distant areas of the city.
If such a node is blocked or fails, the impact is rarely local. Because so many routes depend on it, disruption spreads quickly across the network, leading to congestion, delays, or even system-wide breakdowns. This way of reasoning about importance and vulnerability is central to how network analysts interpret urban systems, as described in practical explanations of betweenness centrality and related centrality measures used in network analysis.
Practical Example: A City District as a Graph
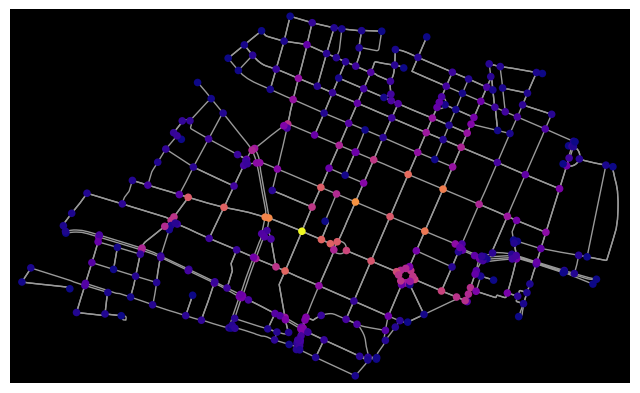
Using a Python library called OSMnx, you can turn any city district into a graph in just a few lines of code. In this example, the street network of Maxvorstadt in Munich is downloaded from OpenStreetMap. Intersections are treated as nodes, and road segments as edges.
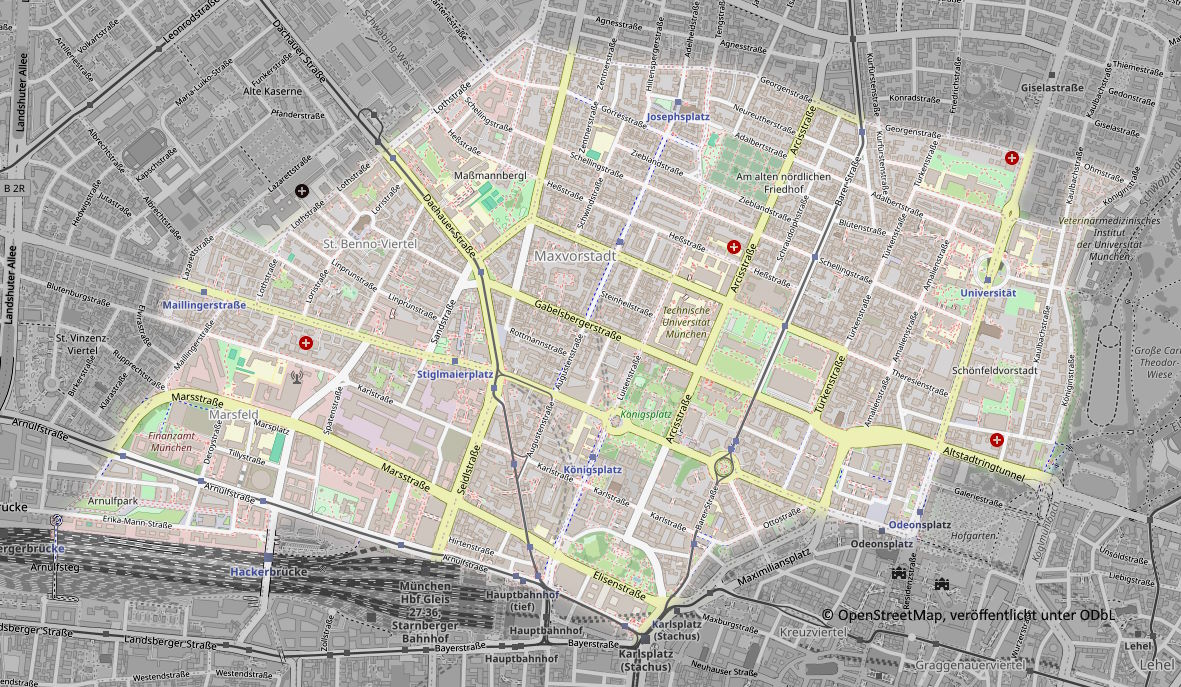
Maxvorstadt District Map. Source: Bei uns in München
OSMnx automatically estimates travel speeds and travel times for each road segment using OpenStreetMap tags. This allows the graph to represent how traffic actually flows through the street network, including the effects of one-way streets and different road types, rather than relying only on geometric distance. The key step is computing betweennesas centrality, which highlights intersections that act as bridges for movement across the district.
You can replace the district name with any neighborhood you know. Running this at the district scale keeps the analysis fast, while still revealing which small parts of the network quietly carry the most importance.
In the output visualization, most intersections appear in dark blue, indicating low centrality, while a small number stand out in warmer tones like yellow and orange. These highly central nodes account for a disproportionate share of movement across the district, acting as critical bridges in the network.
Why This Matters for Real Decisions?
Graph thinking is already influencing real-world planning decisions. For example, in Astana, where rapid urban growth is expected to push the population toward 2.5 million by 2035, planners used graph-based analysis to understand how traffic and accessibility were distributed across the road network.
By examining measures such as traffic polarity and network connectivity, they identified districts that were becoming overly dependent on a small number of critical routes. These areas were especially vulnerable to congestion and disruptions. Instead of expanding roads everywhere, planners focused on targeted changes that improved the structure of the network itself.
The resulting interventions included adding new through-streets to break up oversized blocks, relocating logistics centers outside the city ring road to reduce heavy vehicle traffic in the core, and increasing overall road density to introduce redundancy. The Astana case shows how graph-based reasoning can move beyond diagnosis and directly guide resilient infrastructure design.
How Graphs Connect to Modern Geospatial AI?
Graph Neural Networks (GNNs) extend graph thinking into modern geospatial AI. Instead of treating roads, sensors, or intersections as isolated features, these models learn directly from the structure of the network, capturing how activity and disruptions propagate through connected systems.
Recent work on UAV and ground-sensor graph models for urban prediction demonstrates this shift. By feeding real-time data from drones and ground sensors into a city-scale graph, the model learns relationships between different parts of the network. This makes it possible to anticipate downstream effects, such as how an incident on a highway can translate into delays on specific bus routes minutes before they occur.
This approach matters because it aligns AI with how cities actually function: not as collections of points, but as interconnected systems where local events can trigger city-wide consequences.
Limitations
Graphs are powerful, but they come with important caveats.
Reporting bias is a major issue when graphs are built from complaint or service data. For example, studies using NYC 311 service requests show that wealthier neighborhoods often appear to have more problems simply because residents report issues more frequently, not because infrastructure is objectively worse.
Messy data is another challenge. Geospatial graphs often combine multiple datasets with inconsistent identifiers, naming conventions, or missing links. Problems like entity resolution and schema mismatches are well documented in discussions on data quality in network analysis and can easily lead to disconnected or misleading graphs.
Finally, there is the snapshot problem. Cities change continuously, while most graphs represent a single moment in time. Updating graphs dynamically remains difficult at scale, a limitation highlighted in research on dynamic and temporal graphs used for evolving systems.
Maps remain essential for understanding where things are in space. But to understand how a city moves, adapts, and sometimes fails, connections matter more than coordinates. Graphs make those connections explicit, revealing how local decisions can trigger city-wide consequences.
As cities generate more real-time data and geospatial AI continues to evolve, graph-based approaches will play an increasingly central role. Future research is moving toward dynamic graphs, graph-based learning, and hybrid models that combine geometry with network structure. These directions promise not just better predictions, but better questions about resilience, accessibility, and equity.
Seeing cities as graphs does not replace maps. It complements them. Together, they offer a way to design urban systems that are not only larger or faster, but also more robust and better prepared for the challenges ahead.
Further Resources
- https://arxiv.org/abs/2405.07664
- https://www.youtube.com/watch?v=-fs8ozxKklQ
- https://graphwise.ai/blog/geoai-how-graphrag-unlocks-complex-geospatial-knowledge/
How do you like this article? Read more and subscribe to our monthly newsletter!

